 Multi-family
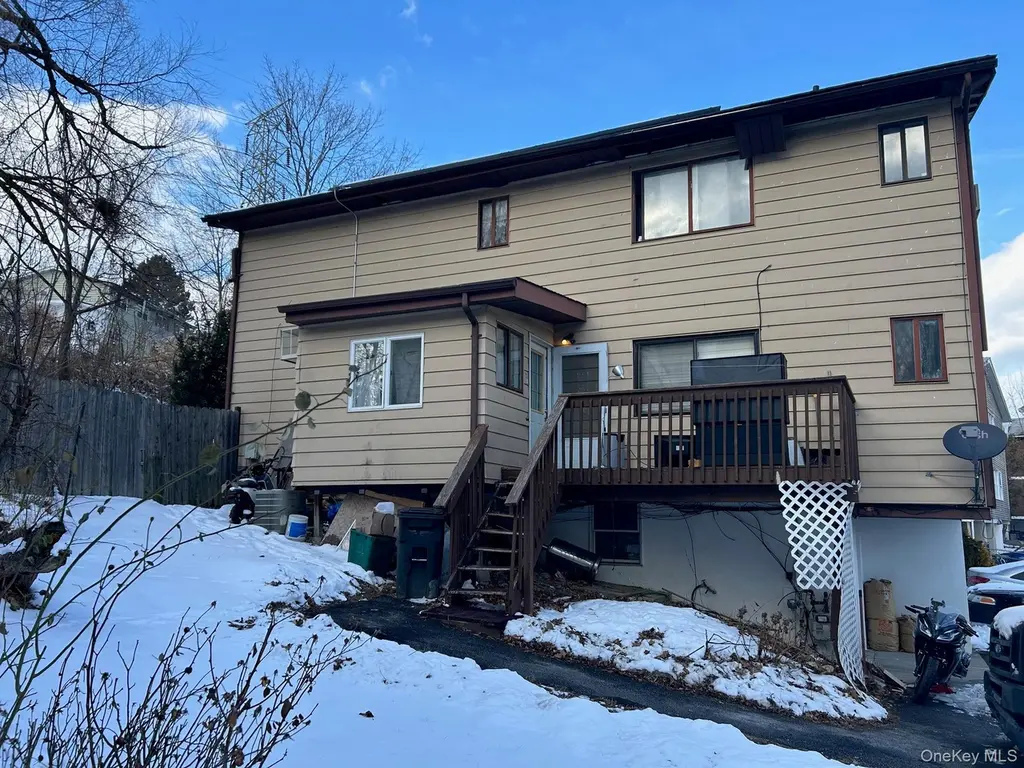
16 Spring Brook Rd · Nanuet, NY
Flood risk 1/10 · Minimal
- FEMA flood zone
- X (unshaded)
- Chance of flooding over 30 yrs
- 0.0%
- Est. flood insurance / yr
- $473 – $860
Fire risk 1/10 · Minimal
- Est. fire insurance / yr
- $691 – $1,283
Heat risk 5/10 · Moderate
- Hot days now (above 97°F)
- 7 days/yr
- Hot days in 30 yrs
- 15 days/yr
Wind risk 4/10 · Minor
- Chance of severe wind over 30 yrs
- 23.0%
Air-quality risk 4/10 · Minor
- Unhealthy air days now
- 3 days/yr
- Unhealthy air days in 30 yrs
- 6 days/yr
Risk factors via First Street. Map © Google.
Why this score? — see what drove the C- grade
The composite is a weighted blend of 9 inputs, each scored 0–100. Each bar is that input's sub-score; the figure is the points it added to the 100-point composite (weight × sub-score).
- Cash flow +21.5/30.0
- ARV discount +7.5/15.0
- DSCR +6.9/10.0
- 1% rule +6.8/10.0
- Livability +3.5/5.0
- Rent growth +3.4/5.0
- Schools +2.6/10.0
- Condition / age +2.5/5.0
- Appreciation +0.0/10.0
$675,000
🖨 Deal sheet 📄 Offer letter ✓ Due diligence
Multi-family units
County records classify this as Multi-Family (2-4 Unit). Listing-text estimate: 1 unit. estimate disagrees with records
Listing remarks MLS
Discover the Perfect Home ! This property offers the ideal living arrangement . Lower level has a separate access to a family room, 2 bonus rooms and a full bath. 2nd level the main part of the home has the kitchen, dining living room primary bedroom with full bath, 3rd level has a 2nd primary bedroom with a full bath, 2 additional rooms and a full bath. Bring the family back together schedule an appointment today and explore the endless possibilities awaiting you. Don't miss out on this chance to make a smart investment for your future!
Key facts
- 7,405 sq ft lot
- Built 1973
- Listed 75 days
Neighborhood map
What this means for you Summary
Snapshot
- This is a 4-bed/3.0-bath multifamily listed at $675k.
Deal economics
- At list price, monthly cash flow is $1k ($12k/yr) — positive.
- The deal already cash-flows at list — no discount required.
- Meets the 1% rule at list price ($8k rent vs $675k).
- Recommended offer: $634k (6.0% below list) — sets the bar for market timing.
- Cap rate 8.1% vs local median 2.3% in Nanuet — top-decile yield for the area; either an underpriced asset or a hidden risk that comps aren't pricing in. Stress-test before assuming the spread holds.
Location & tenants
- Location reads 70/100 on livability (#466 in NY) — a middle-class / working-renter tenant base. Strengths: commute A+, employment A+, housing A+; Watch: amenities F, cost of living F, health & safety F.
- East Ramapo Central School District (Spring Valley) (suburban): math 22% / reading 34% proficiency, ranked #576 of 590 in NY (top 98%) — low school quality limits family demand, transient renter base, plan for 1-2y turnover; 68% free/reduced lunch — lower-income household profile, screen leases tightly.
- Market conditions: Rents rising (+3.5%/yr); 118 active listings in the ZIP; 2 comparable units currently listed for rent nearby; high-income renter base; 429 units permitted in Rockland County in 2024 (231 in 5+ unit buildings).
- At $7,958/mo this rent would consume 82% of the median local household income ($116k/yr) (locally 842% of renters already pay >50% of income on rent) — very limited rent-growth headroom before tenants either downsize or default.
Forward outlook
- Local home prices are declining (-3.0%/yr); year-one equity from $5k of loan paydown is wiped out by about $20k of value loss. Plan a longer hold.
- Rockland County population projected at +7% by 2050 — modest demand growth; plan on rents tracking national, not racing it.
Negotiation context
- It's been on market 75 days — a 6% lower offer ($634k) is reasonable based on typical stale-listing flexibility.
- 10 sale attempts since 29y ago with the ask held roughly flat each time — persistent listings suggest the price (not the market) is what's stuck; bring a comps-based counter.
- Current owner paid $355k; list at $675k implies a 90% gain — meaningful room to come down on a strong offer.
Risks & watch-outs
- Watch-outs: property tax is 2.6% of price.
- Climate carrying-cost: extreme-heat days projected 7→15/yr by 2055 (HVAC capex compounding) — expect insurance premiums to compound above CPI over the hold.
Questions for the listing agent
- It's been on market 75 days. Have you received any prior offers? Is the seller open to a 6% concession, seller financing, or rate buy-down credit?
- Built in 1973 — when were the roof, HVAC, electrical panel, plumbing, and water heater last replaced?
- Property tax is high relative to price — has the assessment been appealed recently, and will the sale trigger a re-assessment?
- Why hasn't it sold? Are there any deal-killer items the seller is aware of (foundation, flood, title, zoning, code violations)?
- Is there a deadline driving the sale (1031 exchange, divorce, estate, relocation)? That informs how much negotiation room exists.
- Schools are B-rated — typically a magnet for longer-tenancy family renters. What's the average tenant stay here, and is there a school-zone premium baked into asking?
- What's the average days-on-market for RENTAL listings here right now (not sales)? A rising rental-DOM trend means longer vacancies and softer asking-rent achievability than the comps imply.
- What's the recent tenant-quality profile in this submarket — average credit score on applications, eviction rate, late-payment / NSF rate, and stable-employment percentage? A property-management company in the area should have these aggregated.
- How much new apartment / multifamily construction is in the pipeline within 1–3 miles? Heavy new supply (>2% of stock underway) typically softens rents 12–24 months out; light construction supports rent growth.
Investment metrics
- 1% rule
- 1.18% ✓
- Cap rate
- 8.10%
- Cash-on-cash
- 6.46%
- DSCR
- 1.29
- GRM
- 7.1
CMA / ARV
- ARV (median comp)
- $1,507,657
- List price
- $675,000
- Delta
- -55.23%
- Verdict
- UNDERPRICED
- Comps
- 14 within 1.0 mi
Show comp detail 1 sale within ~0.75 mi
| Address | Dist | Beds/Ba | Sqft | Sold | Price | $/sf | Match |
|---|---|---|---|---|---|---|---|
| 52 Second Ave | 0.21mi | 4/2.0 | 2,128 (+4%) | 19mo | $800,000 | $376 | 64 |
Match score weights: distance 35% · size 25% · config 20% · recency 20%. Top-matched comps best support the ARV.
Projected returns pro-forma
-3.0% appreciation · 3.53% rent growth · sell at horizon
- IRR
- -5.6%
- Equity multiple
- 0.79×
- Total profit
- $-39,843
- Equity at exit
- $100,645
- IRR
- 4.8%
- Equity multiple
- 1.36×
- Total profit
- $68,410
- Equity at exit
- $58,362
Cash invested: $189,000 (down + closing). Projections, not guarantees.
Landlord ↔ Tenant lean methodology
- Overall (STATE)
- 15 Strongly Tenant-Friendly
- State New York
- 15 Strongly Tenant-Friendly · D+10
- County
- — inherits STATE
- City
- — inherits STATE
ZIP-level market 10954
- Rents YoY
- 3.5%
- Active inventory
- 118
- Price-to-rent
- 21.2×
Monthly cashflow live
- Estimated rent
- $7,958 medium interval (Pro) →
- Mortgage (P&I)
- −$3,540
- Tax from tax record
- −$1,449 /mo · $17,385/yr
- Insurance
- −$281
- HOA
- −$0
- Vacancy / Maint / Mgmt
- −$1,671
- Net cashflow
- $1,017
Break-even live
3-unit breakdown (identical units grouped — click to expand)
| Units | Beds | Baths | Est. rent |
|---|---|---|---|
| 3× units | 2 | 1 | $7,959 |
| #1 | 2 | 1 | $2,653 |
| #2 | 2 | 1 | $2,653 |
| #3 | 2 | 1 | $2,653 |
| Total (3 units) | $7,958 | ||
UW: 25.0% down · 7.5% · 30yr · 1.5% tax · 5.0% vac · 8.0% maint · 8.0% mgmt
Financing live
Cash to close
- Down payment
- $168,750
- Closing costs
- $20,250
- Reserves months
- —
- Total cash needed
- —
Loan-product check · same deal, 3 products live
Conventional
25% down · 7.5% · 30yr
- Down + closing
- —
- Monthly P&I
- —
- Monthly cashflow
- —
- DSCR
- —
- Eligible?
- —
Personal DTI + credit; lowest rate.
DSCR
20% down · 8.5% · 30yr
- Down + closing
- —
- Monthly P&I
- —
- Monthly cashflow
- —
- DSCR
- —
- Eligible?
- —
No personal income docs; deal must DSCR.
Hard money
10% down · 12.0% · 12mo
- Down + closing
- —
- Monthly P&I
- —
- Monthly cashflow
- —
- DSCR
- —
- Eligible?
- —
Short-term bridge; refi at stabilization.
Rent comps 2 comps
| Address | Beds | Baths | Sqft | Rent | $/sqft | DOM | Units | Dist |
|---|---|---|---|---|---|---|---|---|
| 100 Avalon Gardens Dr Nanuet, NY | 1.0–3.0 | 1.0–2.0 | 1154 | $4,539 | $3.93 | 1d | 21 | 0.73mi |
| 1 Hadassah Ln Spring Valley, NY | 3.0 | 1.5 | 1554 | $3,500 | $2.25 | 1d | 1 | 1.42mi |
Listing history 24 events
-
2026-06-02statusdays on market $675,000 Pending 75 DOM
-
2026-06-01days on market $675,000 Active 74 DOM
-
2026-05-31days on market $675,000 Active 73 DOM
-
2026-03-20status Active 545-char remark
Show marketing remark (545 chars)
Discover the Perfect Home ! This property offers the ideal living arrangement . Lower level has a separate access to a family room, 2 bonus rooms and a full bath. 2nd level the main part of the home has the kitchen, dining living room primary bedroom with full bath, 3rd level has a 2nd primary bedroom with a full bath, 2 additional rooms and a full bath. Bring the family back together schedule an appointment today and explore the endless possibilities awaiting you. Don't miss out on this chance to make a smart investment for your future!
-
2026-03-18$675,000 Active 545-char remark
Show marketing remark (545 chars)
Discover the Perfect Home ! This property offers the ideal living arrangement . Lower level has a separate access to a family room, 2 bonus rooms and a full bath. 2nd level the main part of the home has the kitchen, dining living room primary bedroom with full bath, 3rd level has a 2nd primary bedroom with a full bath, 2 additional rooms and a full bath. Bring the family back together schedule an appointment today and explore the endless possibilities awaiting you. Don't miss out on this chance to make a smart investment for your future!
-
2025-08-29status Pending
-
2025-08-29historical
-
2025-04-25status Active
-
2025-03-23price $675,000
-
2025-01-29$725,000 Active
-
2025-01-23historical
-
2024-10-25price $700,000
-
2024-06-08$600,000 Active
-
2024-05-25$600,000 Active
-
2024-05-22historical
-
2023-12-19status Active
-
2023-12-19$700,000 Active
-
2023-12-04$700,000 Active
-
2007-01-17soldstatus $355,000
-
1998-01-30soldstatus $83,000
-
1998-01-28historical
-
1998-01-28price $89,900
-
1997-12-04$83,000
-
1981-01-06soldstatus $107,000
ⓘ Source: listings_history table (triggers on properties + properties_extension) + one-shot
backfill from property_details.listing_events for pre-trigger history.
Tax reassessment forecast NY · Partial reset (capped growth)
- Current annual tax
- $17,385 · $1,449/mo
- Projected year-2 tax
- $17,385 · $1,449/mo
- Expected delta
- $0/yr ($0/mo · 0.0%)
ⓘ Screening estimate from a state-policy table — verify with the county assessor before closing.
Climate risk First Street
- Flood 1/10 Low FEMA zone X (unshaded) · 0% chance over 30 yrs
- Wildfire 1/10 Low
- Heat 5/10 Major 7 d/yr ≥97°F today · 15 d/yr by 30 yrs out
- Wind 4/10 Moderate 23% chance of damaging wind over 30 yrs
- Air quality 4/10 Moderate 3 unhealthy d/yr today · 6 by 30 yrs out
Nearby sold comps map
Loading sold comps map…
Walkable amenities ~0.75 mi
Loading nearby amenities…
Taxation est. · year 1
- Rental income
- $95,496
- − Mortgage interest
- −$37,810
- − Property taxes
- −$17,385
- − Insurance
- −$3,375
- − Repairs & maintenance
- −$7,640
- − Management
- −$7,640
- − Depreciation
- −$19,636
- Taxable income
- $2,010
- Est. tax owed @ 24.0%
- −$482
- After-tax cash flow
- $11,722/yr
For passive investors: Depreciation is non-cash, so a rental often shows a tax loss while cash-flowing — sheltering income. Rental losses are passive: they offset passive income freely, and up to $25,000/yr can offset ordinary (W-2) income if you actively participate and your MAGI is under $100k (phasing out to $0 by $150k); unused losses carry forward. On sale, claimed depreciation is recaptured at up to 25%, and gains may owe capital-gains tax (a 1031 exchange can defer both). Figures are a year-1 estimate at your 24.0% rate — not tax advice; consult a CPA.
Schools (NCES district)
- District
- East Ramapo Central School District (Spring Valley)
- NCES district ID
- 3627810
- Math proficiency
- 22% ▼ -10.00%
- Reading proficiency
- 34% ▼ -2.00%
- Median HH income
- $61,547
- Composite
- 25.6/100
- National rank
- #7418
- State rank
- #576 of 590 in NY
Livability — Nanuet
- Score
- 70/100
- State rank
- #466
- US rank
- #8149
Category grades
Schools grade is shown separately in the Schools card above.
Census & demographics
- Census place
- Nanuet, NY
- County
- Rockland County · 98,828 people
- City population
- 26,495
- Metro
- New York-Newark-Jersey City, NY-NJ-PA
- Population (ZIP)
- 26,495
- Household income
- $116,332
- Rent vs Own
- Severe rent burden
- 842.0
Population outlook (Rockland County) Hauer SSP2
- Today (2025)
- 339,642 people
- By 2030
- 345,987 · +1.9%
- By 2040
- 357,178 · +5.2%
- By 2050
- 362,456 · +6.7%
- By 2075
- 367,281 · +8.1%
- By 2100
- 328,211 · -3.4%
Race, ethnicity, and origin ACS 2023
- Neighborhood character
- Diverse neighborhood (Simpson 0.68)
- Race & ethnicity
- White 50% Hispanic / Latino 18% Black 15% Asian 13% Two or more races 12%
- Hispanic origin (detail)
- Puerto Rican 5% Dominican 2%
- Common ancestry
- Italian 2% Scotch-Irish 2% Romanian 2%
- Foreign-born
- 27% · Canada, China, South Korea
- Languages at home
- 65% English-only · Spanish 14% Other Indo-European 5% Other Asian/Pacific 5%
Political lean MEDSL · Rockland
- 2024 margin
- R (+11.8) · D 44.1% · R 55.9%
- 2008→2024 swing
- -17.7pp toward R · 2008: 5.9pp · 2024: -11.8pp
- All cycles
- 2024: R+11.8 2020: D+1.7 2016: D+5.1 2012: D+6.6 2008: D+5.9
Not yet ingested
- Civics
- —
Market trends
- HPI YoY
- ▼ -405.30%
- Current HPI
- 273.6981
- Rent YoY
- ▲ 3.53%
- Metro
- New York-Newark-Jersey City, NY-NJ-PA
- State GDP YoY
- ▲ 2.60%
- F500 in state
- 92
Industry mix (Fortune 500 HQ in NY)
| Industry | F500 HQs | Revenue |
|---|---|---|
| Financial Services | 10 | $950B |
|
||
| Consumer Goods | 9 | $162B |
|
||
| Insurance | 4 | $225B |
|
||
| Telecommunications | 2 | $144B |
|
||
| Pharmaceuticals | 2 | $112B |
|
||
| Media / Entertainment | 2 | $69B |
|
||
Price history
+530.8% since first listed21 events — show timeline
- 2026-03-20 Relisted — OneKey® MLS as Distributed by MLS Grid
- 2026-03-18 Listed $675,000 OneKey® MLS as Distributed by MLS Grid
- 2025-08-29 Pending — OneKey® MLS as Distributed by MLS Grid
- 2025-08-29 Listing Removed — OneKey® MLS as Distributed by MLS Grid
- 2025-04-25 Relisted — OneKey® MLS as Distributed by MLS Grid
- 2025-03-23 Price Changed $675,000 OneKey® MLS as Distributed by MLS Grid
- 2025-01-29 Listed $725,000 OneKey® MLS as Distributed by MLS Grid
- 2025-01-23 Listing Removed — OneKey® MLS as Distributed by MLS Grid
- 2024-10-25 Price Changed $700,000 OneKey® MLS as Distributed by MLS Grid
- 2024-06-08 Listed $600,000 OneKey® MLS as Distributed by MLS Grid
- 2024-05-25 Listed $600,000 OneKey® MLS as Distributed by MLS Grid
- 2024-05-22 Listing Removed — OneKey® MLS as Distributed by MLS Grid
- 2023-12-19 Relisted — OneKey® MLS as Distributed by MLS Grid
- 2023-12-19 Listed $700,000 OneKey® MLS as Distributed by MLS Grid
- 2023-12-04 Listed $700,000 OneKey® MLS as Distributed by MLS Grid
- 2007-01-17 Sold (Public Records) $355,000 Public Records
- 1998-01-30 Sold (MLS) $83,000 HGMLS
- 1998-01-28 Price Changed $89,900 HGMLS
- 1998-01-28 Delisted — HGMLS
- 1997-12-04 Listed $83,000 HGMLS
- 1981-01-06 Sold (Public Records) $107,000 Public Records
Property tax history
+5.9%/yrLatest (2025): $17,385 · +7.1% YoY. Source: county tax records.
Cash-flow waterfall
monthlySold comps — $/sqft
last 12 mo · ≤1 miLoading sold comps…