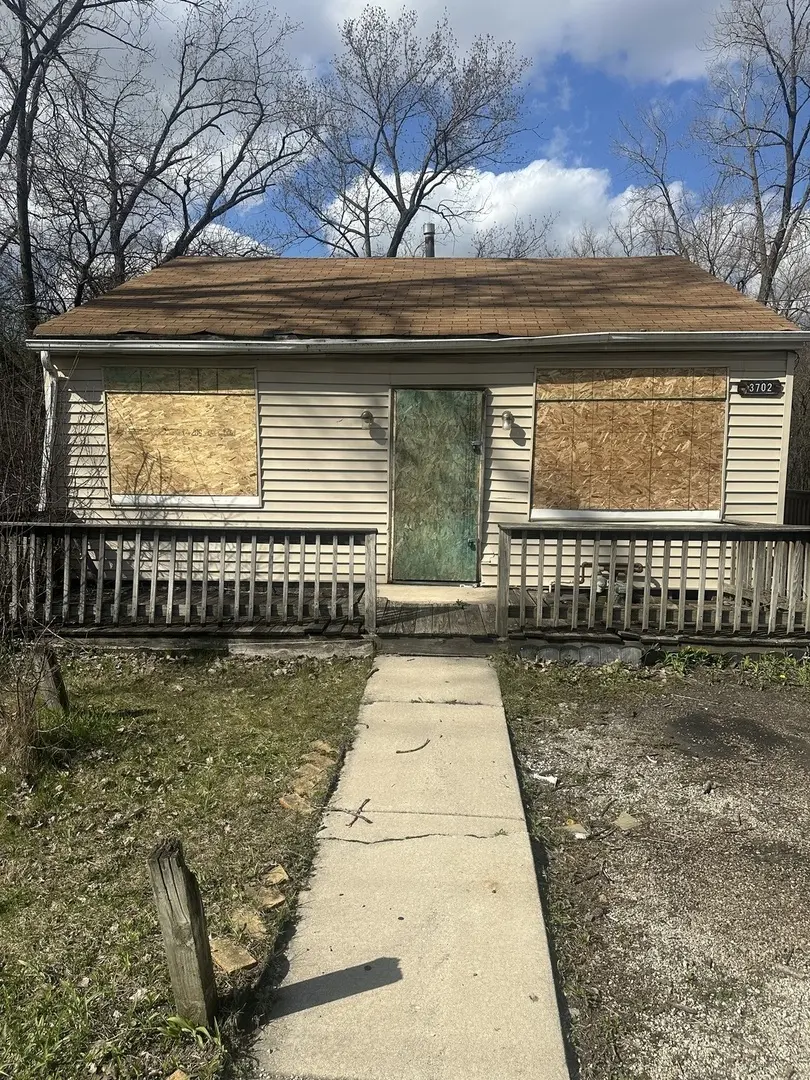
3702 Lincoln Ln E · Robbins, IL
Flood risk 9/10 · Severe
- FEMA flood zone
- AE
- Chance of flooding over 30 yrs
- 0.99%
- Est. flood insurance / yr
- $2,026 – $9,024
Fire risk 1/10 · Minimal
- Est. fire insurance / yr
- $804 – $1,492
Heat risk 2/10 · Minimal
- Hot days now (above 101°F)
- 7 days/yr
- Hot days in 30 yrs
- 13 days/yr
Wind risk 2/10 · Minimal
- Chance of severe wind over 30 yrs
- —
Air-quality risk 4/10 · Minor
- Unhealthy air days now
- 4 days/yr
- Unhealthy air days in 30 yrs
- 6 days/yr
Risk factors via First Street. Map © Google.
Why this score? — see what drove the A- grade
The composite is a weighted blend of 9 inputs, each scored 0–100. Each bar is that input's sub-score; the figure is the points it added to the 100-point composite (weight × sub-score).
- Cash flow +30.0/30.0
- ARV discount +15.0/15.0
- 1% rule +10.0/10.0
- DSCR +10.0/10.0
- Appreciation +10.0/10.0
- Livability +3.3/5.0
- Rent growth +2.5/5.0
- Condition / age +2.5/5.0
- Schools +1.6/10.0
$67,000
🖨 Deal sheet 📄 Offer letter ✓ Due diligence
Listing remarks MLS
Investor Special !!! A 2- bedroom ranch house on a quiet street sitting on a double lot. It has a separate living and dining rooms and 2 big bedrooms. There's a river that runs a few feet from the back of property for your recreational purposes. Schedule your showing today.
Key facts
- Ranch house
- Double lot
- 5,000 sq ft lot
Tags
Neighborhood map
What this means for you Summary
Snapshot
- This is a 2-bed/1.0-bath single-family listed at $67k.
Deal economics
- At list price, monthly cash flow is $648 ($8k/yr) — positive.
- The deal already cash-flows at list — no discount required.
- Meets the 1% rule at list price ($2k rent vs $67k).
- Recommended offer: $65k (3.0% below list) — sets the bar for market timing.
Location & tenants
- Location reads 66/100 on livability (#583 in IL) — a middle-class / working-renter tenant base. Strengths: commute A+, cost of living A+, housing A+; Watch: crime D+, schools F, amenities F.
- Chsd 218 (suburban): math 14% / reading 20% proficiency, ranked #454 of 620 in IL (top 73%) — low school quality limits family demand, transient renter base, plan for 1-2y turnover.
- Market conditions: 28 active listings in the ZIP; 5 comparable units currently listed for rent nearby; rentals leasing fast (median 3d on market — plan ~1-2 weeks tenant-placement turnaround); 6,272 units permitted in Cook County in 2024 (4,658 in 5+ unit buildings).
Forward outlook
- In year one you build about $7k of equity ($463 loan paydown + $7k appreciation (10.0% local appreciation)).
- At projected returns (10.0% appreciation + 3.0% rent growth), your $19k cash investment doubles in ~2 years — after that, you're playing with house money.
- By year 5, paydown + projected appreciation supports a ~$33k cash-out refi (75% LTV) — recoverable capital for the next deal without selling this one.
Negotiation context
- It's been on market 31 days — a 3% lower offer ($65k) is reasonable based on typical stale-listing flexibility.
- 3 sale attempts with the ask held roughly flat each time — persistent listings suggest the price (not the market) is what's stuck; bring a comps-based counter.
Risks & watch-outs
- Watch-outs: flood insurance adds $460/mo; built in 1955 — expect roof / HVAC / electrical / plumbing capex.
- Climate carrying-cost: in FEMA flood zone AE (mandatory federal flood insurance) — expect insurance premiums to compound above CPI over the hold.
Questions for the listing agent
- It's been on market 31 days. Have you received any prior offers? Is the seller open to a 3% concession, seller financing, or rate buy-down credit?
- Built in 1955 — when were the roof, HVAC, electrical panel, plumbing, and water heater last replaced?
- What's the actual annual flood-insurance premium (NFIP or private), and is the property in a SFHA with mandatory coverage?
- Is there a deadline driving the sale (1031 exchange, divorce, estate, relocation)? That informs how much negotiation room exists.
- Schools are F-rated, which usually means shorter tenancies and higher turnover. Who's the typical renter profile here, and what's been the actual vacancy rate?
- Crime grade is D in this area — have there been break-ins, vandalism, or insurance claims at this property in the last 3 years? What carrier currently insures it and at what premium?
- What's the average days-on-market for RENTAL listings here right now (not sales)? A rising rental-DOM trend means longer vacancies and softer asking-rent achievability than the comps imply.
- What's the recent tenant-quality profile in this submarket — average credit score on applications, eviction rate, late-payment / NSF rate, and stable-employment percentage? A property-management company in the area should have these aggregated.
- How much new for-sale + rental construction is in the pipeline within 1–3 miles? Heavy new supply typically softens prices + rents 12–24 months out; constrained supply supports both.
Investment metrics
- 1% rule
- 2.90% ✓
- Cap rate
- 26.14%
- Cash-on-cash
- 70.88%
- DSCR
- 4.15
- GRM
- 2.9
CMA / ARV
- ARV (median comp)
- $114,217
- List price
- $67,000
- Delta
- -41.34%
- Verdict
- UNDERPRICED
- Comps
- 20 within 1.0 mi
Show comp detail 4 sales within ~0.75 mi
| Address | Dist | Beds/Ba | Sqft | Sold | Price | $/sf | Match |
|---|---|---|---|---|---|---|---|
| 3918 Lincoln Ln | 0.31mi | 2/1.0 | 1,200 (+2%) | 1mo | $40,400 | $34 | 82 |
| 13407 Monticello Ave | 0.10mi | 3/1.0 (+1) | 1,110 (-6%) | 6mo | $129,900 | $117 | 75 |
| 3739 W 139th St | 0.69mi | 3/2.0 (+1) | 1,241 (+5%) | 2mo | $250,000 | $201 | 49 |
| 3806 W 137th St | 0.51mi | 3/2.0 (+1) | 1,251 (+6%) | 23mo | $30,000 | $24 | 38 |
Match score weights: distance 35% · size 25% · config 20% · recency 20%. Top-matched comps best support the ARV.
Projected returns pro-forma
10.0% appreciation · 3.0% rent growth · sell at horizon
- IRR
- 56.5%
- Equity multiple
- 5.16×
- Total profit
- $78,034
- Equity at exit
- $60,359
- IRR
- 50.1%
- Equity multiple
- 11.55×
- Total profit
- $197,932
- Equity at exit
- $130,166
Cash invested: $18,760 (down + closing). Projections, not guarantees.
Landlord ↔ Tenant lean methodology
- Overall (STATE)
- 43 Moderately Tenant-Leaning
- State Illinois
- 43 Moderately Tenant-Leaning · D+7
- County
- — inherits STATE
- City
- — inherits STATE
ZIP-level market 60472
- Home prices YoY
- 3.5%
- Active inventory
- 28
- Price-to-rent
- 2.9×
Monthly cashflow live
- Estimated rent
- $1,943 high interval (Pro) →
- Mortgage (P&I)
- −$351
- Tax from tax record
- −$47 /mo · $568/yr
- Insurance
- −$28
- Flood insurance flood zone
- −$460 /mo · $5,525/yr
- HOA
- −$0
- Vacancy / Maint / Mgmt
- −$408
- Net cashflow
- $648
Break-even live
UW: 25.0% down · 7.5% · 30yr · 1.5% tax · 5.0% vac · 8.0% maint · 8.0% mgmt
Financing live
Cash to close
- Down payment
- $16,750
- Closing costs
- $2,010
- Reserves months
- —
- Total cash needed
- —
Loan-product check · same deal, 3 products live
Conventional
25% down · 7.5% · 30yr
- Down + closing
- —
- Monthly P&I
- —
- Monthly cashflow
- —
- DSCR
- —
- Eligible?
- —
Personal DTI + credit; lowest rate.
DSCR
20% down · 8.5% · 30yr
- Down + closing
- —
- Monthly P&I
- —
- Monthly cashflow
- —
- DSCR
- —
- Eligible?
- —
No personal income docs; deal must DSCR.
Hard money
10% down · 12.0% · 12mo
- Down + closing
- —
- Monthly P&I
- —
- Monthly cashflow
- —
- DSCR
- —
- Eligible?
- —
Short-term bridge; refi at stabilization.
Rent comps 5 comps
| Address | Beds | Baths | Sqft | Rent | $/sqft | DOM | Units | Dist |
|---|---|---|---|---|---|---|---|---|
| 13906 Central Park Ave Unit 2N Robbins, IL | 3.0 | 2.0 | 900 | $2,200 | $2.44 | 1d | 1 | 0.70mi |
| 4329 W Park Lane Dr Unit 3C Alsip, IL | 1.0 | 1.0 | 800 | $1,295 | $1.62 | 7d | 1 | 1.26mi |
| 2640 Vermont St Unit 1 Blue Island, IL | 3.0 | 1.5 | 1500 | $2,200 | $1.47 | 1d | 1 | 1.38mi |
| 2336 W 122nd St Unit 2 Alsip, IL | 3.0 | 1.0 | 1100 | $1,900 | $1.73 | 7d | 1 | 1.46mi |
| 13615 Royal Ct #309 Crestwood, IL | 2.0 | 2.0 | 1000 | $1,850 | $1.85 | 3d | 1 | 1.49mi |
Listing history 6 events
-
2026-05-01status Active 280-char remark
Show marketing remark (280 chars)
Investor Special !!! A 2- bedroom ranch house on a quiet street sitting on a double lot. It has a separate living and dining rooms and 2 big bedrooms. There's a river that runs a few feet from the back of property for your recreational purposes. Schedule your showing today.
-
2026-04-20status Pending 280-char remark
Show marketing remark (280 chars)
Investor Special !!! A 2- bedroom ranch house on a quiet street sitting on a double lot. It has a separate living and dining rooms and 2 big bedrooms. There's a river that runs a few feet from the back of property for your recreational purposes. Schedule your showing today.
-
2026-04-13$67,000 Active 280-char remark
Show marketing remark (280 chars)
Investor Special !!! A 2- bedroom ranch house on a quiet street sitting on a double lot. It has a separate living and dining rooms and 2 big bedrooms. There's a river that runs a few feet from the back of property for your recreational purposes. Schedule your showing today.
-
2025-09-16soldstatus $61,000 Closed 31-char remark
Show marketing remark (31 chars)
There are no remarks available.
-
2025-08-05status Pending 31-char remark
Show marketing remark (31 chars)
There are no remarks available.
-
2025-07-25$60,000 Active 31-char remark
Show marketing remark (31 chars)
There are no remarks available.
ⓘ Source: listings_history table (triggers on properties + properties_extension) + one-shot
backfill from property_details.listing_events for pre-trigger history.
Tax reassessment forecast IL · Partial reset (capped growth)
- Current annual tax
- $568 · $47/mo
- Projected year-2 tax
- $1,044 · $87/mo
- Expected delta
- +$476/yr (+$40/mo · 83.9%)
ⓘ Screening estimate from a state-policy table — verify with the county assessor before closing.
Climate risk First Street
- Flood 9/10 Extreme FEMA zone AE · 99% chance over 30 yrs
- Wildfire 1/10 Low
- Heat 2/10 Low 7 d/yr ≥101°F today · 13 d/yr by 30 yrs out
- Wind 2/10 Low
- Air quality 4/10 Moderate 4 unhealthy d/yr today · 6 by 30 yrs out
Nearby sold comps map
Loading sold comps map…
Walkable amenities ~0.75 mi
Loading nearby amenities…
Taxation est. · year 1
- Rental income
- $23,313
- − Mortgage interest
- −$3,753
- − Property taxes
- −$568
- − Insurance
- −$5,860
- − Repairs & maintenance
- −$1,865
- − Management
- −$1,865
- − Depreciation
- −$1,949
- Taxable income
- $7,452
- Est. tax owed @ 24.0%
- −$1,789
- After-tax cash flow
- $5,984/yr
For passive investors: Depreciation is non-cash, so a rental often shows a tax loss while cash-flowing — sheltering income. Rental losses are passive: they offset passive income freely, and up to $25,000/yr can offset ordinary (W-2) income if you actively participate and your MAGI is under $100k (phasing out to $0 by $150k); unused losses carry forward. On sale, claimed depreciation is recaptured at up to 25%, and gains may owe capital-gains tax (a 1031 exchange can defer both). Figures are a year-1 estimate at your 24.0% rate — not tax advice; consult a CPA.
Schools (NCES district)
- District
- Chsd 218
- NCES district ID
- 1706540
- Math proficiency
- 14% ▼ -4.00%
- Reading proficiency
- 20% ▼ -1.00%
- Median HH income
- $57,166
- Composite
- 16.09/100
- National rank
- #9235
- State rank
- #454 of 620 in IL
Livability — Robbins
- Score
- 66/100
- State rank
- #583
- US rank
- #12161
Category grades
Schools grade is shown separately in the Schools card above.
Census & demographics
- Census place
- Robbins, IL
- City population
- 4,961
- Population (ZIP)
- 4,961
Population outlook (Cook County) Hauer SSP2
- Today (2025)
- 5,347,519 people
- By 2030
- 5,357,703 · +0.2%
- By 2040
- 5,324,924 · -0.4%
- By 2050
- 5,230,762 · -2.2%
- By 2075
- 4,785,735 · -10.5%
- By 2100
- 4,188,836 · -21.7%
Race, ethnicity, and origin ACS 2023
- Neighborhood character
- Predominantly Black (85%)
- Race & ethnicity
- Black 85% Hispanic / Latino 9% White 4% Two or more races 3%
- Hispanic origin (detail)
- Mexican 8%
- Common ancestry
- Hispanic 4%
- Foreign-born
- 4% · Canada
- Languages at home
- 92% English-only · Spanish 7%
Political lean MEDSL · Cook
- 2024 margin
- Solid D (+42.0) · D 70.4% · R 28.4% · Other 1.2%
- 2008→2024 swing
- -11.4pp toward R · 2008: 53.4pp · 2024: 42.0pp
- All cycles
- 2024: D+42.0 2020: D+50.3 2016: D+53.0 2012: D+49.4 2008: D+53.4
Not yet ingested
- Civics
- —
Market trends
- HPI YoY
- ▲ 16.74%
- Current HPI
- 494.1622
- Rent YoY
- —
- Metro
- —
- State GDP YoY
- ▲ 1.59%
- F500 in state
- 60
Industry mix (Fortune 500 HQ in IL)
| Industry | F500 HQs | Revenue |
|---|---|---|
| Insurance | 4 | $201B |
|
||
| Consumer Goods | 4 | $87B |
|
||
| Industrial Machinery | 3 | $64B |
|
||
| Healthcare | 2 | $55B |
|
||
| Retail / Pharmacy | 1 | $148B |
|
||
| Agriculture / Food | 1 | $86B |
|
||
Price history
+11.7% since first listed6 events — show timeline
- 2026-05-01 Relisted — MRED as Distributed by MLS Grid
- 2026-04-20 Pending — MRED as Distributed by MLS Grid
- 2026-04-13 Listed $67,000 MRED as Distributed by MLS Grid
- 2025-09-16 Sold (MLS) $61,000 MRED as Distributed by MLS Grid
- 2025-08-05 Pending — MRED as Distributed by MLS Grid
- 2025-07-25 Listed $60,000 MRED as Distributed by MLS Grid
Property tax history
+9.5%/yrLatest (2013): $568 · -5.4% YoY. Source: county tax records.
Cash-flow waterfall
monthlySold comps — $/sqft
last 12 mo · ≤1 miLoading sold comps…