418 Mcmurphy St · Canton, MS
Flood risk 1/10 · Minimal
- FEMA flood zone
- X (unshaded)
- Chance of flooding over 30 yrs
- 0.0%
- Est. flood insurance / yr
- $507 – $1,088
Fire risk 4/10 · Minor
- Est. fire insurance / yr
- $1,241 – $2,305
Heat risk 7/10 · Major
- Hot days now (above 109°F)
- 7 days/yr
- Hot days in 30 yrs
- 20 days/yr
Wind risk 8/10 · Major
- Chance of severe wind over 30 yrs
- 80.0%
Air-quality risk 2/10 · Minimal
- Unhealthy air days now
- 0 days/yr
- Unhealthy air days in 30 yrs
- 1 days/yr
Risk factors via First Street. Map © Google.
Why this score? — see what drove the B grade
The composite is a weighted blend of 9 inputs, each scored 0–100. Each bar is that input's sub-score; the figure is the points it added to the 100-point composite (weight × sub-score).
- Cash flow +30.0/30.0
- ARV discount +12.2/15.0
- DSCR +10.0/10.0
- 1% rule +9.5/10.0
- Livability +3.0/5.0
- Rent growth +2.5/5.0
- Condition / age +2.5/5.0
- Schools +1.3/10.0
- Appreciation +0.0/10.0
$165,000
🖨 Deal sheet (PDF) 📄 Offer letter ✓ Due diligence
Listing remarks
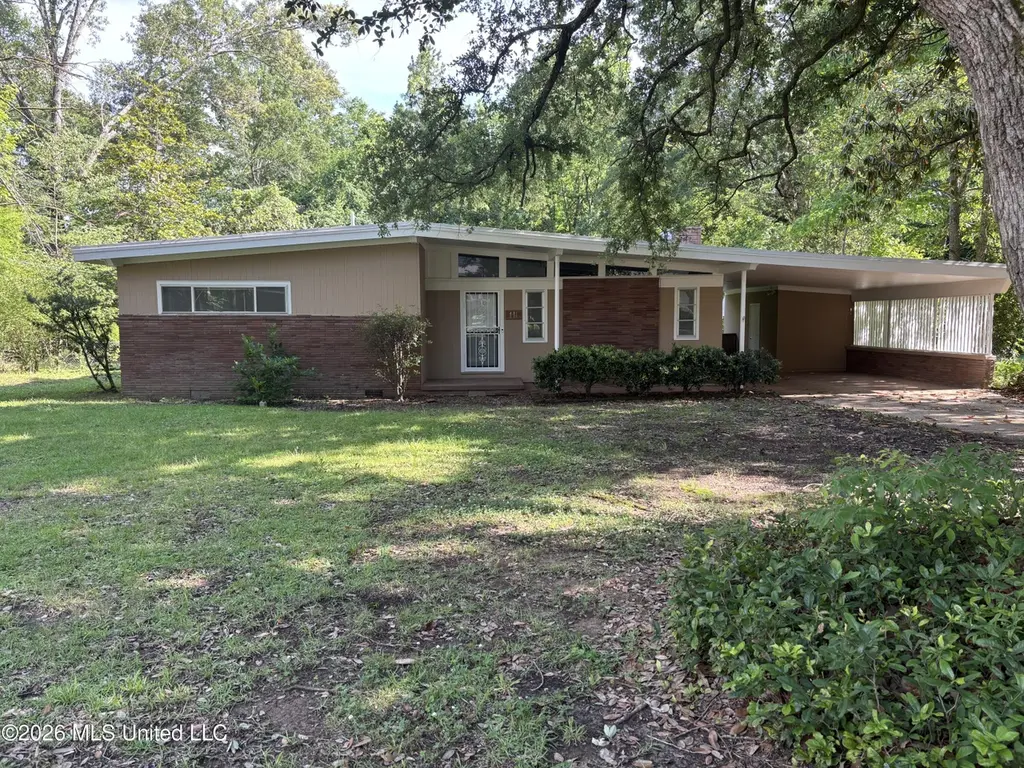
Charming 2 bed, 2 bath mid-century modern home located in Canton, MS! This unique home offers timeless character, clean architectural lines, and a comfortable layout perfect for everyday living. Conveniently situated near town, this property combines classic style with small-town charm. Don't miss your chance to make this Canton gem your own!
Key facts
- 0.54 acre lot
- 2 parking spots
- Built 1957
Property features AI
Finance
- HOA & community: Street lights in the community
Exterior
- Parking: 2-space carport; Concrete driveway/surface
- Utilities: Public water; Public sewer; Cable available; Electricity connected; Phone available; Sewer connected
- Home design: Single-family house; One story; Move-in ready
- Construction: Brick and wood siding exterior; Slab foundation; Architectural shingle roof; Built (year source: assessor)
- Exterior features: Rear porch; Outdoor lighting; Fenced yard (back yard and front yard)
Interior
- Kitchen: Cooktop; Microwave; Oven
- Bathrooms: 2 full bathrooms
- Heating & cooling: Central heating (natural gas); Central air conditioning
- Interior features: Gas log fireplace; Interior lighting
Neighborhood map
What this means for you Summary
Snapshot
- This is a 2-bed/3.0-bath single-family listed at $165k.
Deal economics
- At list price, monthly cash flow is $858 ($10k/yr) — positive.
- The deal already cash-flows at list — no discount required.
- Meets the 1% rule at list price ($2k rent vs $165k).
- Recommended offer: $163k (1.5% below list) — sets the bar for market timing.
- Cap rate 12.5% vs local median 4.0% in Canton — top-decile yield for the area; either an underpriced asset or a hidden risk that comps aren't pricing in. Stress-test before assuming the spread holds.
Location & tenants
- Location reads 60/100 on livability (#229 in MS) — a middle-class / working-renter tenant base. Strengths: cost of living A+, crime B+; Watch: amenities F, commute F, employment F.
- Canton Public School District (rural): math 13% / reading 19% proficiency, ranked #100 of 130 in MS (top 77%) — low school quality limits family demand, transient renter base, plan for 1-2y turnover; 94% free/reduced lunch — lower-income household profile, screen leases tightly.
- Zoned schools: Canton Elementary School (math 12% / reading 17%, grade F, #279 of 375 statewide, top 77%, 391 students, 100% FRL); Huey L. Porter Middle School (math 17% / reading 18%, grade F, #123 of 179 statewide, top 69%, 377 students, 100% FRL).
- Market conditions: 363 active listings in the ZIP; 1 comparable units currently listed for rent nearby; 553 units permitted in Madison County in 2024 (0 in 5+ unit buildings).
Forward outlook
- Local home prices are declining (-3.0%/yr); year-one equity from $1k of loan paydown is wiped out by about $5k of value loss. Plan a longer hold.
- Madison County population projected at +34% by 2050 — long-run rental-demand tailwind backs the buy-and-hold thesis.
- At projected returns (-3.0% appreciation + 3.0% rent growth), your $46k cash investment doubles in ~6 years — after that, you're playing with house money.
Negotiation context
- It's been on market 15 days — a 2% lower offer ($163k) is reasonable based on typical stale-listing flexibility.
Risks & watch-outs
- Watch-outs: built in 1957 — expect roof / HVAC / electrical / plumbing capex.
- Climate carrying-cost: severe wind risk, 80% chance of damaging wind over 30y; extreme-heat days projected 7→20/yr by 2055 (HVAC capex compounding) — expect insurance premiums to compound above CPI over the hold.
Questions for the listing agent
- Built in 1957 — when were the roof, HVAC, electrical panel, plumbing, and water heater last replaced?
- Is there a deadline driving the sale (1031 exchange, divorce, estate, relocation)? That informs how much negotiation room exists.
- Schools are F-rated, which usually means shorter tenancies and higher turnover. Who's the typical renter profile here, and what's been the actual vacancy rate?
- What's the average days-on-market for RENTAL listings here right now (not sales)? A rising rental-DOM trend means longer vacancies and softer asking-rent achievability than the comps imply.
- What's the recent tenant-quality profile in this submarket — average credit score on applications, eviction rate, late-payment / NSF rate, and stable-employment percentage? A property-management company in the area should have these aggregated.
- How much new for-sale + rental construction is in the pipeline within 1–3 miles? Heavy new supply typically softens prices + rents 12–24 months out; constrained supply supports both.
Investment metrics
- 1% rule
- 1.45% ✓
- Cap rate
- 12.53%
- Cash-on-cash
- 22.29%
- DSCR
- 1.99
- GRM
- 5.7
CMA / ARV
- ARV (median comp)
- $184,456
- List price
- $165,000
- Delta
- -10.55%
- Verdict
- UNDERPRICED
- Comps
- 20 within 1.0 mi
Show comp detail 5 sales within ~0.75 mi
| Address | Dist | Beds/Ba | Sqft | Sold | Price | $/sf | Match |
|---|---|---|---|---|---|---|---|
| 508 Lyon St | 0.34mi | 3/2.0 (+1) | 1,417 (-2%) | 16mo | $185,000 | $131 | 59 |
| 375 E Fulton St | 0.64mi | 2/1.0 | 1,343 (-7%) | 0mo | $149,900 | $112 | 50 |
| 228 E Dinkins St | 0.29mi | 3/1.5 (+1) | 1,644 (+14%) | 8mo | $160,000 | $97 | 46 |
| 201 E Semmes St | 0.52mi | 2/2.0 | 1,540 (+7%) | 24mo | $140,000 | $91 | 41 |
| 843 E Dinkins St | 0.71mi | 3/1.0 (+1) | 1,352 (-6%) | 23mo | $175,000 | $129 | 24 |
Match score weights: distance 35% · size 25% · config 20% · recency 20%. Top-matched comps best support the ARV.
Projected returns pro-forma
-3.0% appreciation · 3.0% rent growth · sell at horizon
- IRR
- 15.1%
- Equity multiple
- 1.60×
- Total profit
- $27,893
- Equity at exit
- $24,602
- IRR
- 23.7%
- Equity multiple
- 3.05×
- Total profit
- $94,560
- Equity at exit
- $14,266
Cash invested: $46,200 (down + closing). Projections, not guarantees.
Landlord ↔ Tenant lean methodology
- Overall (STATE)
- 90 Strongly Landlord-Friendly
- State Mississippi
- 90 Strongly Landlord-Friendly · R+11
- County
- — inherits STATE
- City
- — inherits STATE
ZIP-level market 39046
- Home prices YoY
- -30.1%
- Active inventory
- 363
- Price-to-rent
- 5.7×
Monthly cashflow live
- Estimated rent
- $2,400 medium interval (Pro) →
- Mortgage (P&I)
- −$865
- Tax from tax record
- −$104 /mo · $1,246/yr
- Insurance
- −$69
- HOA
- −$0
- Vacancy / Maint / Mgmt
- −$504
- Net cashflow
- $858
Break-even live
Sensitivity live
| Price | -10% $952 | -5% $905 | +0% $858 | +5% $811 | +10% $765 |
|---|---|---|---|---|---|
| Rent | -10% $669 | -5% $763 | +0% $858 | +5% $953 | +10% $1,048 |
| Rate | -1.0pp $941 | -0.5pp $900 | base $858 | +0.5pp $815 | +1.0pp $772 |
UW: 25.0% down · 7.5% · 30yr · 1.5% tax · 5.0% vac · 8.0% maint · 8.0% mgmt
Financing live
Cash to close
- Down payment
- $41,250
- Closing costs
- $4,950
- Reserves months
- —
- Total cash needed
- —
Loan-product check · same deal, 3 products live
Conventional
25% down · 7.5% · 30yr
- Down + closing
- —
- Monthly P&I
- —
- Monthly cashflow
- —
- DSCR
- —
- Eligible?
- —
Personal DTI + credit; lowest rate.
DSCR
20% down · 8.5% · 30yr
- Down + closing
- —
- Monthly P&I
- —
- Monthly cashflow
- —
- DSCR
- —
- Eligible?
- —
No personal income docs; deal must DSCR.
Hard money
10% down · 12.0% · 12mo
- Down + closing
- —
- Monthly P&I
- —
- Monthly cashflow
- —
- DSCR
- —
- Eligible?
- —
Short-term bridge; refi at stabilization.
Rent comps 1 comps
| Address | Beds | Baths | Sqft | Rent | $/sqft | DOM | Units | Dist |
|---|---|---|---|---|---|---|---|---|
| 102 Rotherfield PL Canton, MS | 3.0 | 2.0 | 1565 | $2,400 | $1.53 | 15d | 1 | 0.96mi |
Listing history 3 events
-
2026-05-13$165,000 Active 344-char remark
-
1988-08-08soldstatus
-
1988-08-08soldstatus
ⓘ Source: listings_history table (triggers on properties + properties_extension) + one-shot
backfill from property_details.listing_events for pre-trigger history.
Tax reassessment forecast MS · Resets to sale price
- Current annual tax
- $1,246 · $104/mo
- Projected year-2 tax
- $1,304 · $109/mo
- Expected delta
- +$58/yr (+$5/mo · 4.6%)
ⓘ Screening estimate from a state-policy table — verify with the county assessor before closing.
Climate risk First Street
- Flood 1/10 Low FEMA zone X (unshaded) · 0% chance over 30 yrs
- Wildfire 4/10 Moderate
- Heat 7/10 Severe 7 d/yr ≥109°F today · 20 d/yr by 30 yrs out
- Wind 8/10 Severe 80% chance of damaging wind over 30 yrs
- Air quality 2/10 Low 0 unhealthy d/yr today · 1 by 30 yrs out
Nearby sold comps map
Loading sold comps map…
Walkable amenities ~0.75 mi
Loading nearby amenities…
Taxation est. · year 1
- Rental income
- $28,800
- − Mortgage interest
- −$9,243
- − Property taxes
- −$1,246
- − Insurance
- −$825
- − Repairs & maintenance
- −$2,304
- − Management
- −$2,304
- − Depreciation
- −$4,800
- Taxable income
- $8,079
- Est. tax owed @ 24.0%
- −$1,939
- After-tax cash flow
- $8,359/yr
For passive investors: Depreciation is non-cash, so a rental often shows a tax loss while cash-flowing — sheltering income. Rental losses are passive: they offset passive income freely, and up to $25,000/yr can offset ordinary (W-2) income if you actively participate and your MAGI is under $100k (phasing out to $0 by $150k); unused losses carry forward. On sale, claimed depreciation is recaptured at up to 25%, and gains may owe capital-gains tax (a 1031 exchange can defer both). Figures are a year-1 estimate at your 24.0% rate — not tax advice; consult a CPA.
Schools (NCES district)
- District
- Canton Public School District
- NCES district ID
- 2800900
- Math proficiency
- 13% ▼ -20.00%
- Reading proficiency
- 19% ▼ -5.00%
- Median HH income
- $38,130
- Composite
- 13.44/100
- National rank
- #9523
- State rank
- #100 of 130 in MS
Livability — Canton
- Score
- 60/100
- State rank
- #229
- US rank
- #19396
Category grades
Schools grade is shown separately in the Schools card above.
Census & demographics
- Census place
- Canton, MS
- City population
- 29,160
- Population (ZIP)
- 29,160
Population outlook (Madison County) Hauer SSP2
- Today (2025)
- 122,509 people
- By 2030
- 131,737 · +7.5%
- By 2040
- 148,930 · +21.6%
- By 2050
- 164,300 · +34.1%
- By 2075
- 197,495 · +61.2%
- By 2100
- 211,429 · +72.6%
Race, ethnicity, and origin ACS 2023
- Neighborhood character
- Majority Black (63%)
- Race & ethnicity
- Black 63% White 31% Hispanic / Latino 4% Two or more races 2%
- Common ancestry
- Italian 2% Slovak 1% Serbian 1%
- Foreign-born
- 2% · Canada, China
- Languages at home
- 95% English-only · Spanish 4%
Political lean MEDSL · Madison
- 2024 margin
- R (+17.3) · D 40.8% · R 58.0% · Other 1.2%
- 2008→2024 swing
- -1.7pp toward R · 2008: -15.6pp · 2024: -17.3pp
- All cycles
- 2024: R+17.3 2020: R+11.8 2016: R+16.1 2012: R+15.7 2008: R+15.6
Not yet ingested
- Civics
- —
Market trends
- HPI YoY
- ▼ -66.50%
- Current HPI
- 154.0441
- Rent YoY
- —
- Metro
- —
- State GDP YoY
- —
- F500 in state
- 0
Price history
4 events — show timeline
- 2026-05-28 Pending — MLSU
- 2026-05-13 Listed $165,000 MLSU
- 1988-08-08 Sold (Public Records) — Public Records
- 1988-08-08 Sold (Public Records) — Public Records
Property tax history
+2.6%/yrLatest (2025): $1,246 · +0.0% YoY. Source: county tax records.
Cash-flow waterfall
monthlySold comps — $/sqft
last 12 mo · ≤1 miLoading sold comps…