7320 Merriman Rd · Cave Spring, VA
Flood risk 10/10 · Severe
- FEMA flood zone
- X (unshaded)
- Chance of flooding over 30 yrs
- 0.99%
- Est. flood insurance / yr
- $507 – $1,088
Fire risk 4/10 · Minor
- Est. fire insurance / yr
- $666 – $1,236
Heat risk 4/10 · Minor
- Hot days now (above 99°F)
- 7 days/yr
- Hot days in 30 yrs
- 20 days/yr
Wind risk 2/10 · Minimal
- Chance of severe wind over 30 yrs
- 1.0%
Air-quality risk 2/10 · Minimal
- Unhealthy air days now
- 0 days/yr
- Unhealthy air days in 30 yrs
- 1 days/yr
Risk factors via First Street. Map © Google.
Why this score? — see what drove the D+ grade
The composite is a weighted blend of 9 inputs, each scored 0–100. Each bar is that input's sub-score; the figure is the points it added to the 100-point composite (weight × sub-score).
- Cash flow +16.1/30.0
- ARV discount +7.5/15.0
- Schools +6.4/10.0
- DSCR +5.0/10.0
- Livability +3.8/5.0
- 1% rule +3.4/10.0
- Rent growth +2.5/5.0
- Condition / age +2.5/5.0
- Appreciation +0.0/10.0
$175,000
🖨 Deal sheet 📄 Offer letter ✓ Due diligence
Listing remarks
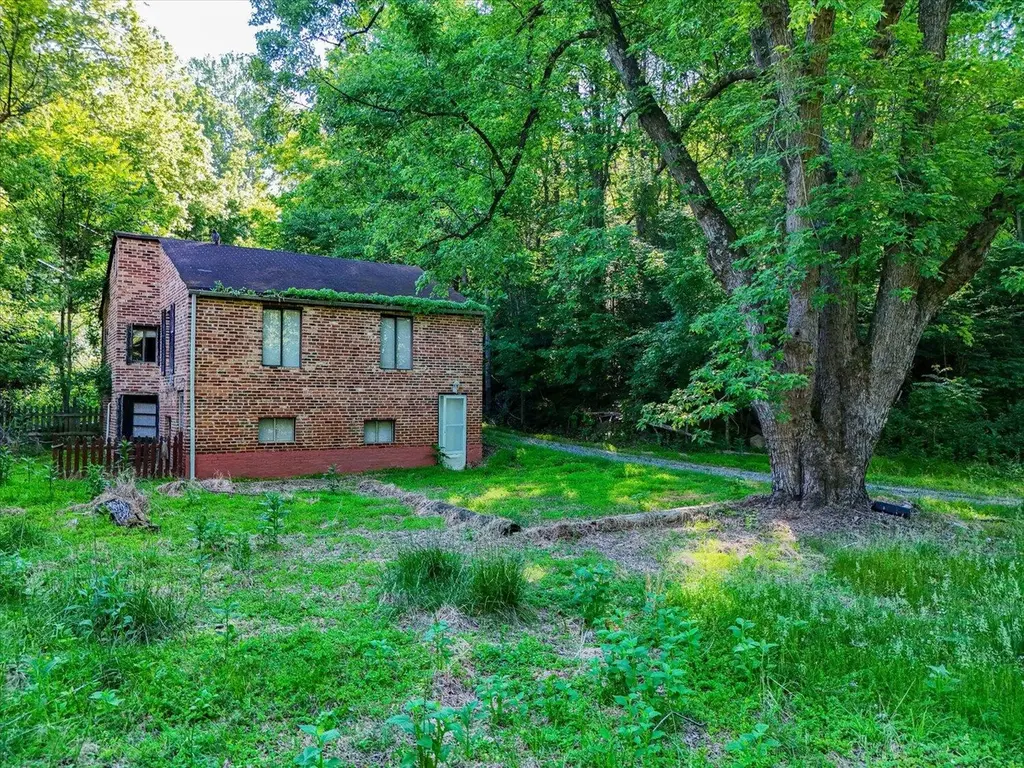
Located in South Roanoke County, this 3 bedroom, 1 bathroom home offers an opportunity for investors, renovators, or buyers looking for acreage and potential. Situated on over 5 acres and being sold together with 3 additional adjacent lots, the property provides plenty of room for future possibilities, expansion, or recreational use. The home itself is being sold as-is, where-is. Recent improvements include a newer water heater and furnace, offering a head start for the next owner. Whether you're looking for a fixer-upper project, investment property, or land opportunity in South Roanoke County, this property has strong upside potential for the right buyer.
Key facts
- Newer furnace
- Over 5 acres
- Newer water heater
Tags
Property features AI
Finance
- Other: Approximately 5.6-acre lot
- Financial info: Listing price $175,000; Annual tax amount $2,314.41
Exterior
- Parking: Off-street parking
- Home design: Residential property
- Construction: Built in 1930
- Exterior features: Off-street parking
Interior
- Bedrooms: Three bedrooms, all on the main level
- Flooring: Carpet
- Bathrooms: One full bathroom on the main level
- Heating & cooling: Has heating; Forced air gas heating
- Interior features: Total of 4 rooms; Carpet flooring
Neighborhood map
What this means for you Summary
Snapshot
- This is a 3-bed/1.0-bath single-family listed at $175k.
Deal economics
- At list price, monthly cash flow is $23 ($280/yr) — positive.
- The deal already cash-flows at list — no discount required.
- To meet the 1% rule (rent ≥ 1% of price), the offer needs to be $147k (16.0% below list).
- Recommended offer: $147k (16.0% below list) — sets the bar for 1% rule.
- Cap rate 6.9% vs local median 3.4% in Cave Spring — top-decile yield for the area; either an underpriced asset or a hidden risk that comps aren't pricing in. Stress-test before assuming the spread holds.
Location & tenants
- Location reads 76/100 on livability (#113 in VA, #3,513 nationally) — a middle-class / working-renter tenant base. Strengths: housing A+, health & safety A+, cost of living A-; Watch: amenities F, commute F.
- Roanoke County Public School District (suburban): math 71% / reading 78% proficiency, ranked #9 of 131 in VA (top 7%) — strong family-tenant draw, lease renewals of 3-5y typical.
- Zoned schools: Penn Forest Elementary (math 83% / reading 88%, grade A+, #61 of 1,108 statewide, top 6%, 400 students, 26% FRL); Cave Spring Middle (math 76% / reading 82%, grade A+, #29 of 342 statewide, top 9%, 765 students, 30% FRL); Cave Spring High (math 86% / reading 90%, grade A, #13 of 319 statewide, top 4%, 1,056 students, 22% FRL).
- Market conditions: 43 active listings in the ZIP; 360 units permitted in Roanoke County in 2024 (228 in 5+ unit buildings).
Forward outlook
- Local home prices are declining (-3.0%/yr); year-one equity from $1k of loan paydown is wiped out by about $5k of value loss. Plan a longer hold.
- Roanoke County population projected at +5% by 2050 — modest demand growth; plan on rents tracking national, not racing it.
Negotiation context
- Only 10 days on market — expect competitive offers; lowballing is unlikely to land.
- Current owner paid $21k; list at $175k implies a 733% gain — meaningful room to come down on a strong offer.
Risks & watch-outs
- Watch-outs: flood insurance adds $66/mo; built in 1930 — expect roof / HVAC / electrical / plumbing capex.
- Climate carrying-cost: severe flood risk — expect insurance premiums to compound above CPI over the hold.
Questions for the listing agent
- Built in 1930 — when were the roof, HVAC, electrical panel, plumbing, and water heater last replaced?
- What's the actual annual flood-insurance premium (NFIP or private), and is the property in a SFHA with mandatory coverage?
- Is there a deadline driving the sale (1031 exchange, divorce, estate, relocation)? That informs how much negotiation room exists.
- Schools are A-rated — typically a magnet for longer-tenancy family renters. What's the average tenant stay here, and is there a school-zone premium baked into asking?
- The area grade is low — what's the realistic commute time and amenity access for the typical tenant pool here? Any planned neighborhood developments (good or bad) we should know about?
- What's the average days-on-market for RENTAL listings here right now (not sales)? A rising rental-DOM trend means longer vacancies and softer asking-rent achievability than the comps imply.
- What's the recent tenant-quality profile in this submarket — average credit score on applications, eviction rate, late-payment / NSF rate, and stable-employment percentage? A property-management company in the area should have these aggregated.
- How much new for-sale + rental construction is in the pipeline within 1–3 miles? Heavy new supply typically softens prices + rents 12–24 months out; constrained supply supports both.
Investment metrics
- 1% rule
- 0.84% ✗
- Cap rate
- 6.91%
- Cash-on-cash
- 2.20%
- DSCR
- 1.10
- GRM
- 9.9
CMA / ARV
No comps found within radius.
Projected returns pro-forma
-3.0% appreciation · 3.0% rent growth · sell at horizon
- IRR
- -15.4%
- Equity multiple
- 0.45×
- Total profit
- $-26,893
- Equity at exit
- $26,093
- IRR
- -6.9%
- Equity multiple
- 0.56×
- Total profit
- $-21,590
- Equity at exit
- $15,131
Cash invested: $49,000 (down + closing). Projections, not guarantees.
Landlord ↔ Tenant lean methodology
- Overall (STATE)
- 55 Moderately Landlord-Leaning
- State Virginia
- 55 Moderately Landlord-Leaning · D+2
- County
- — inherits STATE
- City
- — inherits STATE
ZIP-level market 24065
- Home prices YoY
- -25.9%
- Active inventory
- 43
- Price-to-rent
- 9.9×
Monthly cashflow live
- Estimated rent
- $1,471 medium interval (Pro) →
- Mortgage (P&I)
- −$918
- Tax from tax record
- −$82 /mo · $978/yr
- Insurance
- −$73
- Flood insurance flood zone
- −$66 /mo · $798/yr
- HOA
- −$0
- Vacancy / Maint / Mgmt
- −$309
- Net cashflow
- $23
Break-even live
UW: 25.0% down · 7.5% · 30yr · 1.5% tax · 5.0% vac · 8.0% maint · 8.0% mgmt
Financing live
Cash to close
- Down payment
- $43,750
- Closing costs
- $5,250
- Reserves months
- —
- Total cash needed
- —
Loan-product check · same deal, 3 products live
Conventional
25% down · 7.5% · 30yr
- Down + closing
- —
- Monthly P&I
- —
- Monthly cashflow
- —
- DSCR
- —
- Eligible?
- —
Personal DTI + credit; lowest rate.
DSCR
20% down · 8.5% · 30yr
- Down + closing
- —
- Monthly P&I
- —
- Monthly cashflow
- —
- DSCR
- —
- Eligible?
- —
No personal income docs; deal must DSCR.
Hard money
10% down · 12.0% · 12mo
- Down + closing
- —
- Monthly P&I
- —
- Monthly cashflow
- —
- DSCR
- —
- Eligible?
- —
Short-term bridge; refi at stabilization.
Listing history 7 events
-
2026-06-13statusdays on market $175,000 Pending 10 DOM
-
2026-06-10days on market $175,000 Active 9 DOM
-
2026-06-09days on market $175,000 Active 8 DOM
-
2026-06-08days on market $175,000 Active 7 DOM
-
2026-06-05days on market $175,000 Active 3 DOM
-
2026-06-02remarks 665-char remark
-
2026-06-02$175,000 Active 1 DOM
ⓘ Source: listings_history table (triggers on properties + properties_extension) + one-shot
backfill from property_details.listing_events for pre-trigger history.
Tax reassessment forecast VA · Resets to sale price
- Current annual tax
- $978 · $82/mo
- Projected year-2 tax
- $1,435 · $120/mo
- Expected delta
- +$457/yr (+$38/mo · 46.7%)
ⓘ Screening estimate from a state-policy table — verify with the county assessor before closing.
Climate risk First Street
- Flood 10/10 Extreme FEMA zone X (unshaded) · 99% chance over 30 yrs
- Wildfire 4/10 Moderate
- Heat 4/10 Moderate 7 d/yr ≥99°F today · 20 d/yr by 30 yrs out
- Wind 2/10 Low 100% chance of damaging wind over 30 yrs
- Air quality 2/10 Low 0 unhealthy d/yr today · 1 by 30 yrs out
Nearby sold comps map
Loading sold comps map…
Walkable amenities ~0.75 mi
Loading nearby amenities…
Taxation est. · year 1
- Rental income
- $17,650
- − Mortgage interest
- −$9,803
- − Property taxes
- −$978
- − Insurance
- −$1,672
- − Repairs & maintenance
- −$1,412
- − Management
- −$1,412
- − Depreciation
- −$5,091
- Taxable loss
- −$2,718
- Est. tax savings @ 24.0%
- +$652
- After-tax cash flow
- $932/yr
For passive investors: Depreciation is non-cash, so a rental often shows a tax loss while cash-flowing — sheltering income. Rental losses are passive: they offset passive income freely, and up to $25,000/yr can offset ordinary (W-2) income if you actively participate and your MAGI is under $100k (phasing out to $0 by $150k); unused losses carry forward. On sale, claimed depreciation is recaptured at up to 25%, and gains may owe capital-gains tax (a 1031 exchange can defer both). Figures are a year-1 estimate at your 24.0% rate — not tax advice; consult a CPA.
Schools (NCES district)
- District
- Roanoke County Public School District
- NCES district ID
- 5103330
- Math proficiency
- 71% ▼ -19.00%
- Reading proficiency
- 78% ▼ -6.00%
- Median HH income
- $60,526
- Composite
- 64.08/100
- National rank
- #578
- State rank
- #9 of 131 in VA
Livability — Cave Spring
- Score
- 76/100
- State rank
- #113
- US rank
- #3513
Category grades
Schools grade is shown separately in the Schools card above.
Census & demographics
- Population (ZIP)
- 6,497
Population outlook (Roanoke County) Hauer SSP2
- Today (2025)
- 98,162 people
- By 2030
- 99,793 · +1.7%
- By 2040
- 101,965 · +3.9%
- By 2050
- 103,328 · +5.3%
- By 2075
- 108,641 · +10.7%
- By 2100
- 104,845 · +6.8%
Race, ethnicity, and origin ACS 2023
- Neighborhood character
- Predominantly White (93%)
- Race & ethnicity
- White 93% Hispanic / Latino 6% Two or more races 4%
- Hispanic origin (detail)
- Mexican 6%
- Common ancestry
- Serbian 2% Slovak 2% Italian 1%
- Foreign-born
- 2% · Canada
- Languages at home
- 97% English-only · Spanish 3%
Political lean MEDSL · Roanoke
- 2024 margin
- Strong R (+22.5) · D 38.2% · R 60.7% · Other 1.1%
- 2008→2024 swing
- -1.4pp toward R · 2008: -21.1pp · 2024: -22.5pp
- All cycles
- 2024: R+22.5 2020: R+21.8 2016: R+28.1 2012: R+25.6 2008: R+21.1
Not yet ingested
- Civics
- —
Market trends
- HPI YoY
- ▼ -61.98%
- Current HPI
- 177.7607
- Rent YoY
- —
- Metro
- —
- State GDP YoY
- ▲ 2.40%
- F500 in state
- 50
Industry mix (Fortune 500 HQ in VA)
| Industry | F500 HQs | Revenue |
|---|---|---|
| Aerospace / Defense | 4 | $236B |
|
||
| Technology / Defense | 3 | $32B |
|
||
| Financial Services | 2 | $176B |
|
||
| Utilities | 2 | $27B |
|
||
| Insurance | 2 | $25B |
|
||
| Technology | 2 | $15B |
|
||
Price history
+733.3% since first listed2 events — show timeline
- 2026-06-01 Listed $175,000 MLSRV
- 1983-09-01 Sold (Public Records) $21,000 Public Records
Property tax history
+3.1%/yrLatest (2025): $978 · +4.5% YoY. Source: county tax records.
Cash-flow waterfall
monthlySold comps — $/sqft
last 12 mo · ≤1 miLoading sold comps…