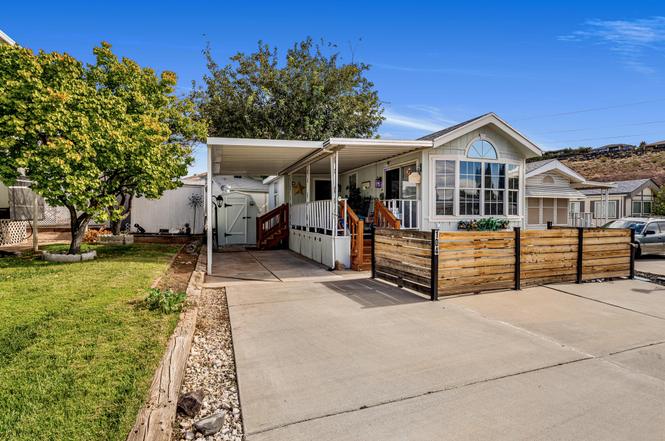
448 E Telegraph #104 · Washington, UT
Flood risk 6/10 · Moderate
- FEMA flood zone
- X (unshaded)
- Chance of flooding over 30 yrs
- 0.74%
- Est. flood insurance / yr
- $507 – $1,088
Fire risk 7/10 · Major
- Est. fire insurance / yr
- $453 – $841
Heat risk 7/10 · Major
- Hot days now (above 103°F)
- 6 days/yr
- Hot days in 30 yrs
- 15 days/yr
Wind risk 1/10 · Minimal
- Chance of severe wind over 30 yrs
- —
Air-quality risk 2/10 · Minimal
- Unhealthy air days now
- 0 days/yr
- Unhealthy air days in 30 yrs
- 1 days/yr
Risk factors via First Street. Map © Google.
Why this score? — see what drove the C+ grade
The composite is a weighted blend of 9 inputs, each scored 0–100. Each bar is that input's sub-score; the figure is the points it added to the 100-point composite (weight × sub-score).
- Cash flow +26.3/30.0
- DSCR +8.9/10.0
- ARV discount +7.5/15.0
- 1% rule +6.8/10.0
- Livability +3.8/5.0
- Schools +3.7/10.0
- Rent growth +2.5/5.0
- Condition / age +2.5/5.0
- Appreciation +0.0/10.0
$149,900
🖨 Deal sheet 📄 Offer letter ✓ Due diligence
Listing remarks
Reduced Price!! Come see this beautifully remodeled park model in the best Park of Southern Utah. Amazing neighbors, close to shopping and schools. The dog park is walking distance away! This model has tons of upgrades, brand new HVAC system, matching storage shed and so much more! 55+ Community.
Key facts
- Remodeled park model
- New hvac system
- 2,178 sq ft lot
Tags
Property features AI
Finance
- HOA & community: Homeowners association with monthly fee of $70; Association fee includes sewer; Community clubhouse available; Senior community
Exterior
- Parking: Carport (1 space); Parking details: see remarks
- Utilities: Sewer available; Electricity connected; Natural gas connected
- Home design: Mobile home (owned lot); Single-story
- Construction: Masonite exterior; Asphalt roof; Built as a single-story structure
- Exterior features: Fenced lot; Level lot; Paved road access
Interior
- Kitchen: Dishwasher; Disposal; Microwave; Range / Oven; Refrigerator
- Heating & cooling: Natural gas heating; Central air; Ceiling fans; No additional cooling listed
- Interior features: Window coverings; 3 total rooms
Neighborhood map
What this means for you Summary
Snapshot
- This is a 2-bed/1.0-bath manufactured listed at $150k.
Deal economics
- At list price, monthly cash flow is $388 ($5k/yr) — positive.
- The deal already cash-flows at list — no discount required.
- Meets the 1% rule at list price ($2k rent vs $150k).
- Recommended offer: $132k (12.0% below list) — sets the bar for market timing.
Location & tenants
- Location reads 75/100 on livability (#59 in UT, #3,809 nationally) — a middle-class / working-renter tenant base. Strengths: commute A+, employment A+, housing A+; Watch: cost of living D, amenities F, health & safety F.
- Washington District (urban): math 42% / reading 45% proficiency, ranked #37 of 80 in UT (top 46%) — families likely to look elsewhere, expect single-tenant / working-renter base with shorter leases.
- Zoned schools: Pine View High (math 29% / reading 48%, grade F, #74 of 171 statewide, top 43%, 1,143 students, 33% FRL) — zoned schools at 33% FRL track the district average.
- Market conditions: Rents soft (-0.1%/yr); 1024 active listings in the ZIP; 4 comparable units currently listed for rent nearby; rentals leasing fast (median 14d on market — plan ~1-2 weeks tenant-placement turnaround); solid renter incomes; 3,140 units permitted in Washington County in 2024 (650 in 5+ unit buildings).
Forward outlook
- Local home prices are declining (-3.0%/yr); year-one equity from $1k of loan paydown is wiped out by about $4k of value loss. Plan a longer hold.
- Washington County population projected at +44% by 2050 — long-run rental-demand tailwind backs the buy-and-hold thesis.
Negotiation context
- It's been on market 179 days — a 12% lower offer ($132k) is reasonable based on typical stale-listing flexibility.
- 12 sale attempts since 3y ago; this cycle's ask has dropped $30k (17%) from the opening price — seller is motivated, your offer sets the floor, not the list.
Risks & watch-outs
- Climate carrying-cost: major flood risk; major wildfire risk; extreme-heat days projected 6→15/yr by 2055 (HVAC capex compounding) — expect insurance premiums to compound above CPI over the hold.
Questions for the listing agent
- It's been on market 179 days. Have you received any prior offers? Is the seller open to a 12% concession, seller financing, or rate buy-down credit?
- What does the HOA fee cover, when was the last increase, and are there any pending special assessments or reserve-fund shortfalls?
- Why hasn't it sold? Are there any deal-killer items the seller is aware of (foundation, flood, title, zoning, code violations)?
- Is there a deadline driving the sale (1031 exchange, divorce, estate, relocation)? That informs how much negotiation room exists.
- What's the average days-on-market for RENTAL listings here right now (not sales)? A rising rental-DOM trend means longer vacancies and softer asking-rent achievability than the comps imply.
- What's the recent tenant-quality profile in this submarket — average credit score on applications, eviction rate, late-payment / NSF rate, and stable-employment percentage? A property-management company in the area should have these aggregated.
- How much new for-sale + rental construction is in the pipeline within 1–3 miles? Heavy new supply typically softens prices + rents 12–24 months out; constrained supply supports both.
Investment metrics
- 1% rule
- 1.18% ✓
- Cap rate
- 9.40%
- Cash-on-cash
- 11.09%
- DSCR
- 1.49
- GRM
- 7.1
CMA / ARV
No comps found within radius.
Projected returns pro-forma
-3.0% appreciation · 0.0% rent growth · sell at horizon
- IRR
- -3.1%
- Equity multiple
- 0.89×
- Total profit
- $-4,731
- Equity at exit
- $22,351
- IRR
- 3.0%
- Equity multiple
- 1.19×
- Total profit
- $7,780
- Equity at exit
- $12,961
Cash invested: $41,972 (down + closing). Projections, not guarantees.
Landlord ↔ Tenant lean methodology
- Overall (STATE)
- 86 Strongly Landlord-Friendly
- State Utah
- 86 Strongly Landlord-Friendly · R+15
- County
- — inherits STATE
- City
- — inherits STATE
ZIP-level market 84780
- Rents YoY
- -0.1%
- Active inventory
- 1024
- Price-to-rent
- 7.1×
Monthly cashflow live
- Estimated rent
- $1,762 medium interval (Pro) →
- Mortgage (P&I)
- −$786
- Tax from tax record
- −$85 /mo · $1,021/yr
- Insurance
- −$62
- HOA
- −$70
- Vacancy / Maint / Mgmt
- −$370
- Net cashflow
- $388
Break-even live
UW: 25.0% down · 7.5% · 30yr · 1.5% tax · 5.0% vac · 8.0% maint · 8.0% mgmt
Financing live
Cash to close
- Down payment
- $37,475
- Closing costs
- $4,497
- Reserves months
- —
- Total cash needed
- —
Loan-product check · same deal, 3 products live
Conventional
25% down · 7.5% · 30yr
- Down + closing
- —
- Monthly P&I
- —
- Monthly cashflow
- —
- DSCR
- —
- Eligible?
- —
Personal DTI + credit; lowest rate.
DSCR
20% down · 8.5% · 30yr
- Down + closing
- —
- Monthly P&I
- —
- Monthly cashflow
- —
- DSCR
- —
- Eligible?
- —
No personal income docs; deal must DSCR.
Hard money
10% down · 12.0% · 12mo
- Down + closing
- —
- Monthly P&I
- —
- Monthly cashflow
- —
- DSCR
- —
- Eligible?
- —
Short-term bridge; refi at stabilization.
Rent comps 4 comps
| Address | Beds | Baths | Sqft | Rent | $/sqft | DOM | Units | Dist |
|---|---|---|---|---|---|---|---|---|
| 115 N 500 W Washington, UT | 1.0–3.0 | 1.0–2.0 | 912 | $1,810 | $1.98 | 21d | 1 | 0.87mi |
| 45 N Red Trail Ln Washington, UT | 2.0 | 1.0–2.0 | 699 | $1,649 | $2.36 | 13d | 1 | 0.94mi |
| 1165 E Bulloch St Washington, UT | 1.0–3.0 | 1.0–2.5 | 1210 | $1,724 | $1.42 | 13d | 8 | 1.06mi |
| 190 N Red Stone Rd Washington, UT | 1.0–3.0 | 1.0–2.0 | 943 | $1,674 | $1.77 | 13d | 10 | 1.14mi |
HOA detail
- Monthly dues
- $70 · $840/yr
Listing history 50 events
-
2026-06-19days on market $149,900 Active 179 DOM
-
2026-06-18days on market $149,900 Active 178 DOM
-
2026-06-17days on market $149,900 Active 177 DOM
-
2026-06-16days on market $149,900 Active 176 DOM
-
2026-06-15days on market $149,900 Active 175 DOM
-
2026-06-14days on market $149,900 Active 173 DOM
-
2026-06-13pricedays on market $149,900 Active 172 DOM
-
2026-06-10pricedays on market $154,900 Active 170 DOM
-
2026-06-09days on market $159,000 Active 169 DOM
-
2026-06-08days on market $159,000 Active 168 DOM
-
2026-06-07days on market $159,000 Active 167 DOM
-
2026-06-05days on market $159,000 Active 164 DOM
-
2026-06-02days on market $159,000 Active 162 DOM
-
2026-06-01days on market $159,000 Active 161 DOM
-
2026-05-31days on market $159,000 Active 160 DOM
-
2026-05-30days on market $159,000 Active 159 DOM
-
2026-04-29price $159,000
-
2026-04-18price $162,900
-
2026-03-12price $164,900
-
2026-03-12status Active
-
2026-01-23historical
-
2026-01-03price $169,900
-
2025-11-12price $174,900
-
2025-11-04$179,900 Active
-
2025-09-03$1,400
-
2025-01-15historical
-
2025-01-14historical
-
2025-01-09$169,000 Active
-
2025-01-09$169,000 Active
-
2024-12-30historical
-
2024-11-27price $175,000
-
2024-11-27price $175,000
-
2024-11-27price $175,000
-
2024-10-31$177,900 Active
-
2024-10-23price $177,900
-
2024-10-23price $177,900
-
2024-09-24$179,900 Active
-
2024-08-29historical
-
2024-08-12price $179,900
-
2024-08-09price $179,900
-
2024-03-07$189,900 Active
-
2024-02-22historical
-
2024-01-30price $187,000
-
2024-01-25$189,000 Active
-
2023-12-30$189,000 Active
-
2023-11-29historical
-
2023-11-06$199,900 Active
-
2023-11-01historical
-
2023-10-24price $205,000
-
2023-10-24price $205,000
ⓘ Source: listings_history table (triggers on properties + properties_extension) + one-shot
backfill from property_details.listing_events for pre-trigger history.
Tax reassessment forecast UT · Resets to sale price
- Current annual tax
- $1,021 · $85/mo
- Projected year-2 tax
- $1,021 · $85/mo
- Expected delta
- $0/yr ($0/mo · 0.0%)
ⓘ Screening estimate from a state-policy table — verify with the county assessor before closing.
Climate risk First Street
- Flood 6/10 Major FEMA zone X (unshaded) · 74% chance over 30 yrs
- Wildfire 7/10 Severe
- Heat 7/10 Severe 6 d/yr ≥103°F today · 15 d/yr by 30 yrs out
- Wind 1/10 Low
- Air quality 2/10 Low 0 unhealthy d/yr today · 1 by 30 yrs out
Nearby sold comps map
Loading sold comps map…
Walkable amenities ~0.75 mi
Loading nearby amenities…
Taxation est. · year 1
- Rental income
- $21,140
- − Mortgage interest
- −$8,397
- − Property taxes
- −$1,021
- − Insurance
- −$750
- − Repairs & maintenance
- −$1,691
- − Management
- −$1,691
- − HOA
- −$840
- − Depreciation
- −$4,361
- Taxable income
- $2,389
- Est. tax owed @ 24.0%
- −$573
- After-tax cash flow
- $4,083/yr
For passive investors: Depreciation is non-cash, so a rental often shows a tax loss while cash-flowing — sheltering income. Rental losses are passive: they offset passive income freely, and up to $25,000/yr can offset ordinary (W-2) income if you actively participate and your MAGI is under $100k (phasing out to $0 by $150k); unused losses carry forward. On sale, claimed depreciation is recaptured at up to 25%, and gains may owe capital-gains tax (a 1031 exchange can defer both). Figures are a year-1 estimate at your 24.0% rate — not tax advice; consult a CPA.
Schools (NCES district)
- District
- Washington District
- NCES district ID
- 4901140
- Math proficiency
- 42% ▼ -3.00%
- Reading proficiency
- 45% ▼ -3.00%
- Median HH income
- $50,861
- Composite
- 37.47/100
- National rank
- #4408
- State rank
- #37 of 80 in UT
Livability — Washington
- Score
- 75/100
- State rank
- #59
- US rank
- #3809
Category grades
Schools grade is shown separately in the Schools card above.
Census & demographics
- Census place
- Washington, UT
- County
- Washington County · 179,216 people
- City population
- 32,366
- Metro
- St. George, UT
- Population (ZIP)
- 32,366
- Household income
- $91,963
- Rent vs Own
- Severe rent burden
- 1036.0
Population outlook (Washington County) Hauer SSP2
- Today (2025)
- 193,324 people
- By 2030
- 211,699 · +9.5%
- By 2040
- 246,449 · +27.5%
- By 2050
- 278,447 · +44.0%
- By 2075
- 342,734 · +77.3%
- By 2100
- 382,815 · +98.0%
Race, ethnicity, and origin ACS 2023
- Neighborhood character
- Predominantly White (77%)
- Race & ethnicity
- White 77% Hispanic / Latino 17% Two or more races 9%
- Hispanic origin (detail)
- Mexican 11% Puerto Rican 1%
- Common ancestry
- Italian 6% Slovak 5% Lithuanian 3%
- Foreign-born
- 5% · Canada, Jamaica, China
- Languages at home
- 89% English-only · Spanish 8% Chinese 1% German/W. Germanic 1%
Political lean MEDSL · Washington
- 2024 margin
- Solid R (+52.3) · D 23.0% · R 75.2% · Other 1.8%
- 2008→2024 swing
- +1.2pp toward D · 2008: -53.5pp · 2024: -52.3pp
- All cycles
- 2024: R+52.3 2020: R+51.7 2016: R+52.1 2012: R+67.0 2008: R+53.5
Not yet ingested
- Civics
- —
Market trends
- HPI YoY
- ▼ -144.73%
- Current HPI
- 248.9421
- Rent YoY
- ▼ -0.06%
- Metro
- St. George, UT
- State GDP YoY
- ▲ 3.54%
- F500 in state
- 2
Industry mix (Fortune 500 HQ in UT)
| Industry | F500 HQs | Revenue |
|---|---|---|
| Financial Services | 1 | $3B |
|
||
Price history
-27.6% since first listed40 events — show timeline
- 2026-04-29 Price Changed $159,000 WCBOR
- 2026-04-18 Price Changed $162,900 WCBOR
- 2026-03-12 Price Changed $164,900 WCBOR
- 2026-03-12 Relisted — WCBOR
- 2026-01-23 Delisted — WCBOR
- 2026-01-03 Price Changed $169,900 WCBOR
- 2025-11-12 Price Changed $174,900 WCBOR
- 2025-11-04 Listed $179,900 WCBOR
- 2025-09-03 Listed for Rent $1,400 REDFIN
- 2025-01-15 Delisted — WCBOR
- 2025-01-14 Listing Removed — WFRMLS
- 2025-01-09 Listed $169,000 WFRMLS
- 2025-01-09 Listed $169,000 WCBOR
- 2024-12-30 Listing Removed — WFRMLS
- 2024-11-27 Price Changed $175,000 WFRMLS
- 2024-11-27 Price Changed $175,000 WCBOR
- 2024-11-27 Price Changed $175,000 ICBORMLS
- 2024-10-31 Listed $177,900 ICBORMLS
- 2024-10-23 Price Changed $177,900 WCBOR
- 2024-10-23 Price Changed $177,900 WFRMLS
- 2024-09-24 Listed $179,900 WFRMLS
- 2024-08-29 Listing Removed — WFRMLS
- 2024-08-12 Price Changed $179,900 WFRMLS
- 2024-08-09 Price Changed $179,900 WCBOR
- 2024-03-07 Listed $189,900 WFRMLS
- 2024-02-22 Listing Removed — WFRMLS
- 2024-01-30 Price Changed $187,000 WCBOR
- 2024-01-25 Listed $189,000 ICBORMLS
- 2023-12-30 Listed $189,000 WFRMLS
- 2023-11-29 Listing Removed — WFRMLS
- 2023-11-06 Listed $199,900 WFRMLS
- 2023-11-01 Listing Removed — WFRMLS
- 2023-10-24 Price Changed $205,000 WCBOR
- 2023-10-24 Price Changed $205,000 WFRMLS
- 2023-09-12 Listed $220,000 WFRMLS
- 2023-08-30 Sold (Public Records) — Public Records
- 2023-06-21 Price Changed $199,900 WCBOR
- 2023-02-06 Price Changed $219,500 WCBOR
- 2021-09-14 Sold (Public Records) — Public Records
- 2010-08-16 Sold (Public Records) — Public Records
Property tax history
+7.9%/yrLatest (2025): $1,021 · +0.4% YoY. Source: county tax records.
Cash-flow waterfall
monthlySold comps — $/sqft
last 12 mo · ≤1 miLoading sold comps…