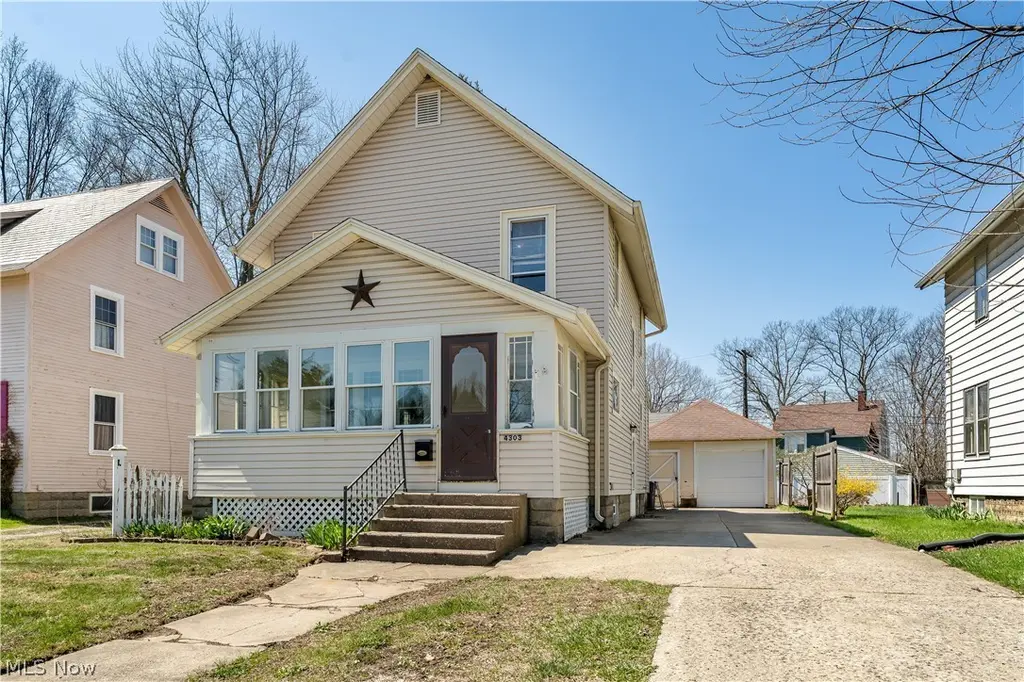
4303 Birchwood Ave · Ashtabula, OH
Flood risk 1/10 · Minimal
- FEMA flood zone
- X (unshaded)
- Chance of flooding over 30 yrs
- 0.0%
- Est. flood insurance / yr
- $473 – $860
Fire risk 1/10 · Minimal
- Est. fire insurance / yr
- $713 – $1,323
Heat risk 3/10 · Minor
- Hot days now (above 93°F)
- 7 days/yr
- Hot days in 30 yrs
- 18 days/yr
Wind risk 1/10 · Minimal
- Chance of severe wind over 30 yrs
- —
Air-quality risk 3/10 · Minor
- Unhealthy air days now
- 2 days/yr
- Unhealthy air days in 30 yrs
- 5 days/yr
Risk factors via First Street. Map © Google.
Why this score? — see what drove the D grade
The composite is a weighted blend of 9 inputs, each scored 0–100. Each bar is that input's sub-score; the figure is the points it added to the 100-point composite (weight × sub-score).
- Cash flow +16.9/30.0
- ARV discount +6.6/15.0
- DSCR +5.3/10.0
- 1% rule +4.2/10.0
- Livability +3.6/5.0
- Rent growth +2.5/5.0
- Condition / age +2.5/5.0
- Schools +2.4/10.0
- Appreciation +0.0/10.0
$153,900
🖨 Deal sheet (PDF) 📄 Offer letter ✓ Due diligence
Listing remarks MLS
Discover the perfect blend of vintage soul and modern reliability in this charming 1930s Colonial! Nestled on a quiet street, this home welcomes you with the kind of character you just can’t find in newer builds. From the moment you step into the enclosed front porch, you’ll feel at home. It's the perfect, cozy spot for enjoying your morning coffee or relaxing while listening to the rain. Inside, the home radiates warmth and features original woodwork throughout. Preserved character shines in the formal dining room, complete with an original built-in buffet. The interior has been freshly repainted, offering a comfortable and lived-in space. You can move right in and take your time making it your own. Breathe easy knowing the "big ticket" items were replaced not long ago. Updates include the water heater (3+ years), furnace (8+ years), and roof (2017). The functional layout includes three bedrooms and a full bathroom upstairs, plus a dry basement ready for storage or hobbies. Step out back to find a deck perfect for evening relaxation and weekend hangouts. The deck overlooks a fully fenced-in backyard, providing a private and secure outdoor space for everyone to enjoy. Complete with a concrete driveway and detached garage, this home is just minutes from the Lake Erie shoreline and local favorites. Classic, cozy, and mechanically sound. Welcome home to Birchwood Ave!
Key facts
- Original woodwork
- Enclosed front porch
- Dry basement
Tags
Neighborhood map
What this means for you Summary
Snapshot
- This is a 3-bed/1.0-bath single-family listed at $154k.
Deal economics
- At list price, monthly cash flow is $101 ($1k/yr) — positive.
- The deal already cash-flows at list — no discount required.
- To meet the 1% rule (rent ≥ 1% of price), the offer needs to be $141k (8.1% below list).
- Recommended offer: $141k (8.1% below list) — sets the bar for 1% rule.
Location & tenants
- Location reads 71/100 on livability (#420 in OH) — a middle-class / working-renter tenant base. Strengths: cost of living A+, health & safety A+, housing A; Watch: amenities F, commute F, employment F.
- Ashtabula Area City (town): math 24% / reading 35% proficiency, ranked #588 of 656 in OH (top 90%) — low school quality limits family demand, transient renter base, plan for 1-2y turnover; 63% free/reduced lunch — lower-income household profile, screen leases tightly.
- Zoned schools: Superior Intermediate School (math 30% / reading 31%, grade F, #1,151 of 1,584 statewide, top 73%, 436 students, 0% FRL); Lakeside Junior High School (math 24% / reading 34%, grade F, #579 of 654 statewide, top 89%, 505 students, 0% FRL); Lakeside High School (math 12% / reading 37%, grade F, #644 of 781 statewide, top 85%, 894 students, 0% FRL) — zoned schools average 0% FRL vs 63% district-wide (63 pts lower); this property's tenant base skews higher-income than the district average.
- Market conditions: 169 active listings in the ZIP; 155 units permitted in Ashtabula County in 2024 (0 in 5+ unit buildings).
- This rent runs 34% of the median local income ($50k/yr) — at the standard rent-burdened threshold; future hikes will face affordability resistance.
Forward outlook
- Local home prices are declining (-3.0%/yr); year-one equity from $1k of loan paydown is wiped out by about $5k of value loss. Plan a longer hold.
- Ashtabula County population projected at -22% by 2050 — secular population decline; favor cash flow + early exit over multi-decade hold.
Negotiation context
- It's been on market 69 days — a 6% lower offer ($145k) is reasonable based on typical stale-listing flexibility.
- 5 sale attempts since 28y ago with the ask held roughly flat each time — persistent listings suggest the price (not the market) is what's stuck; bring a comps-based counter.
- Current owner paid $18k; list at $154k implies a 755% gain — meaningful room to come down on a strong offer.
Risks & watch-outs
- Watch-outs: built in 1932 — expect roof / HVAC / electrical / plumbing capex.
Questions for the listing agent
- It's been on market 69 days. Have you received any prior offers? Is the seller open to a 8% concession, seller financing, or rate buy-down credit?
- Built in 1932 — when were the roof, HVAC, electrical panel, plumbing, and water heater last replaced?
- Why hasn't it sold? Are there any deal-killer items the seller is aware of (foundation, flood, title, zoning, code violations)?
- Is there a deadline driving the sale (1031 exchange, divorce, estate, relocation)? That informs how much negotiation room exists.
- The area grade is low — what's the realistic commute time and amenity access for the typical tenant pool here? Any planned neighborhood developments (good or bad) we should know about?
- What's the average days-on-market for RENTAL listings here right now (not sales)? A rising rental-DOM trend means longer vacancies and softer asking-rent achievability than the comps imply.
- What's the recent tenant-quality profile in this submarket — average credit score on applications, eviction rate, late-payment / NSF rate, and stable-employment percentage? A property-management company in the area should have these aggregated.
- How much new for-sale + rental construction is in the pipeline within 1–3 miles? Heavy new supply typically softens prices + rents 12–24 months out; constrained supply supports both.
Investment metrics
- 1% rule
- 0.92% ✗
- Cap rate
- 7.08%
- Cash-on-cash
- 2.82%
- DSCR
- 1.13
- GRM
- 9.1
CMA / ARV
- ARV (median comp)
- $150,858
- List price
- $153,900
- Delta
- 2.02%
- Verdict
- FAIR
- Comps
- 20 within 1.0 mi
Show comp detail 12 sales within ~0.75 mi
| Address | Dist | Beds/Ba | Sqft | Sold | Price | $/sf | Match |
|---|---|---|---|---|---|---|---|
| 4214 Valleyview Blvd | 0.05mi | 3/1.5 | 1,298 (+5%) | 14mo | $160,000 | $123 | 76 |
| 4235 Birchwood Ave | 0.01mi | 3/1.0 | 1,352 (+9%) | 14mo | $135,000 | $100 | 73 |
| 1739 E 48th St | 0.30mi | 3/1.0 | 1,264 (+2%) | 13mo | $55,000 | $44 | 72 |
| 2045 E 42nd St | 0.27mi | 2/2.0 (-1) | 1,240 (+0%) | 8mo | $200,000 | $161 | 71 |
| 4422 State Rd | 0.14mi | 3/1.0 | 1,400 (+13%) | 1mo | $173,000 | $124 | 71 |
| 1611 E 48th St | 0.32mi | 3/1.5 | 1,168 (-6%) | 6mo | $70,000 | $60 | 69 |
| 1629 E 47th St | 0.26mi | 4/2.0 (+1) | 1,312 (+6%) | 3mo | $141,000 | $107 | 67 |
| 1719 E 48th St | 0.30mi | 3/1.0 | 1,056 (-15%) | 6mo | $79,900 | $76 | 56 |
| 342 W Prospect Rd | 0.53mi | 3/2.0 | 1,296 (+5%) | 15mo | $47,000 | $36 | 51 |
| 4720 Topper Ave | 0.32mi | 3/1.0 | 1,056 (-15%) | 12mo | $51,000 | $48 | 51 |
| 1820 E 47th St | 0.28mi | 3/2.0 | 1,424 (+15%) | 10mo | $171,000 | $120 | 50 |
| 313 W 41st St | 0.61mi | 3/2.0 | 1,344 (+8%) | 11mo | $145,000 | $108 | 44 |
Match score weights: distance 35% · size 25% · config 20% · recency 20%. Top-matched comps best support the ARV.
Projected returns pro-forma
-3.0% appreciation · 3.0% rent growth · sell at horizon
- IRR
- -11.8%
- Equity multiple
- 0.57×
- Total profit
- $-18,491
- Equity at exit
- $22,947
- IRR
- -2.7%
- Equity multiple
- 0.82×
- Total profit
- $-7,821
- Equity at exit
- $13,306
Cash invested: $43,092 (down + closing). Projections, not guarantees.
Landlord ↔ Tenant lean methodology
- Overall (STATE)
- 73 Landlord-Friendly
- State Ohio
- 73 Landlord-Friendly · R+6
- County
- — inherits STATE
- City
- — inherits STATE
ZIP-level market 44004
- Home prices YoY
- -30.5%
- Active inventory
- 169
- Price-to-rent
- 9.1×
Monthly cashflow live
- Estimated rent
- $1,414 medium interval (Pro) →
- Mortgage (P&I)
- −$807
- Tax from tax record
- −$145 /mo · $1,738/yr
- Insurance
- −$64
- HOA
- −$0
- Vacancy / Maint / Mgmt
- −$297
- Net cashflow
- $101
Break-even live
Sensitivity live
| Price | -10% $188 | -5% $145 | +0% $101 | +5% $58 | +10% $14 |
|---|---|---|---|---|---|
| Rent | -10% $-10 | -5% $45 | +0% $101 | +5% $157 | +10% $213 |
| Rate | -1.0pp $179 | -0.5pp $141 | base $101 | +0.5pp $61 | +1.0pp $21 |
UW: 25.0% down · 7.5% · 30yr · 1.5% tax · 5.0% vac · 8.0% maint · 8.0% mgmt
Financing live
Cash to close
- Down payment
- $38,475
- Closing costs
- $4,617
- Reserves months
- —
- Total cash needed
- —
Loan-product check · same deal, 3 products live
Conventional
25% down · 7.5% · 30yr
- Down + closing
- —
- Monthly P&I
- —
- Monthly cashflow
- —
- DSCR
- —
- Eligible?
- —
Personal DTI + credit; lowest rate.
DSCR
20% down · 8.5% · 30yr
- Down + closing
- —
- Monthly P&I
- —
- Monthly cashflow
- —
- DSCR
- —
- Eligible?
- —
No personal income docs; deal must DSCR.
Hard money
10% down · 12.0% · 12mo
- Down + closing
- —
- Monthly P&I
- —
- Monthly cashflow
- —
- DSCR
- —
- Eligible?
- —
Short-term bridge; refi at stabilization.
Listing history 25 events
-
2026-06-21days on market $153,900 Active 69 DOM
-
2026-06-21days on market $153,900 Active 68 DOM
-
2026-06-18days on market $153,900 Active 66 DOM
-
2026-06-17days on market $153,900 Active 65 DOM
-
2026-06-16days on market $153,900 Active 64 DOM
-
2026-06-15days on market $153,900 Active 63 DOM
-
2026-06-13days on market $153,900 Active 61 DOM
-
2026-06-12days on market $153,900 Active 60 DOM
-
2026-06-09days on market $153,900 Active 57 DOM
-
2026-06-08days on market $153,900 Active 56 DOM
-
2026-06-07days on market $153,900 Active 55 DOM
-
2026-06-07days on market $153,900 Active 54 DOM
-
2026-06-04days on market $153,900 Active 51 DOM
-
2026-06-02days on market $153,900 Active 50 DOM
-
2026-06-01days on market $153,900 Active 49 DOM
-
2026-05-31days on market $153,900 Active 48 DOM
-
2026-04-13$153,900 Active 1409-char remark
Show marketing remark (1409 chars)
Discover the perfect blend of vintage soul and modern reliability in this charming 1930s Colonial! Nestled on a quiet street, this home welcomes you with the kind of character you just can’t find in newer builds. From the moment you step into the enclosed front porch, you’ll feel at home. It's the perfect, cozy spot for enjoying your morning coffee or relaxing while listening to the rain. Inside, the home radiates warmth and features original woodwork throughout. Preserved character shines in the formal dining room, complete with an original built-in buffet. The interior has been freshly repainted, offering a comfortable and lived-in space. You can move right in and take your time making it your own. Breathe easy knowing the "big ticket" items were replaced not long ago. Updates include the water heater (3+ years), furnace (8+ years), and roof (2017). The functional layout includes three bedrooms and a full bathroom upstairs, plus a dry basement ready for storage or hobbies. Step out back to find a deck perfect for evening relaxation and weekend hangouts. The deck overlooks a fully fenced-in backyard, providing a private and secure outdoor space for everyone to enjoy. Complete with a concrete driveway and detached garage, this home is just minutes from the Lake Erie shoreline and local favorites. Classic, cozy, and mechanically sound. Welcome home to Birchwood Ave!
-
2025-12-16$166,900 Active
-
2024-05-01historical
-
2024-04-25$167,000 Active
-
2013-10-14soldstatus $18,000
-
2013-09-19$24,999
-
1998-11-13soldstatus $64,000
-
1998-11-13soldstatus $64,000
-
1998-08-25$66,500
ⓘ Source: listings_history table (triggers on properties + properties_extension) + one-shot
backfill from property_details.listing_events for pre-trigger history.
Tax reassessment forecast OH · Partial reset (capped growth)
- Current annual tax
- $1,738 · $145/mo
- Projected year-2 tax
- $2,069 · $172/mo
- Expected delta
- +$331/yr (+$28/mo · 19.1%)
ⓘ Screening estimate from a state-policy table — verify with the county assessor before closing.
Climate risk First Street
- Flood 1/10 Low FEMA zone X (unshaded) · 0% chance over 30 yrs
- Wildfire 1/10 Low
- Heat 3/10 Moderate 7 d/yr ≥93°F today · 18 d/yr by 30 yrs out
- Wind 1/10 Low
- Air quality 3/10 Moderate 2 unhealthy d/yr today · 5 by 30 yrs out
Nearby sold comps map
Loading sold comps map…
Walkable amenities ~0.75 mi
Loading nearby amenities…
Taxation est. · year 1
- Rental income
- $16,973
- − Mortgage interest
- −$8,621
- − Property taxes
- −$1,738
- − Insurance
- −$770
- − Repairs & maintenance
- −$1,358
- − Management
- −$1,358
- − Depreciation
- −$4,477
- Taxable loss
- −$1,348
- Est. tax savings @ 24.0%
- +$324
- After-tax cash flow
- $1,540/yr
For passive investors: Depreciation is non-cash, so a rental often shows a tax loss while cash-flowing — sheltering income. Rental losses are passive: they offset passive income freely, and up to $25,000/yr can offset ordinary (W-2) income if you actively participate and your MAGI is under $100k (phasing out to $0 by $150k); unused losses carry forward. On sale, claimed depreciation is recaptured at up to 25%, and gains may owe capital-gains tax (a 1031 exchange can defer both). Figures are a year-1 estimate at your 24.0% rate — not tax advice; consult a CPA.
Schools (NCES district)
- District
- Ashtabula Area City
- NCES district ID
- 3904351
- Math proficiency
- 24% ▼ -27.00%
- Reading proficiency
- 35% ▼ -13.00%
- Median HH income
- $34,812
- Composite
- 24.3/100
- National rank
- #7712
- State rank
- #588 of 656 in OH
Livability — Ashtabula
- Score
- 71/100
- State rank
- #420
- US rank
- #6883
Category grades
Schools grade is shown separately in the Schools card above.
Census & demographics
- Census place
- Ashtabula, OH
- County
- Ashtabula · 97,617 people
- City population
- 31,076
- Metro
- Cleveland, OH
- Population (ZIP)
- 31,076
- Household income
- $49,507
- Rent vs Own
- Severe rent burden
- 14.1
Population outlook (Ashtabula County) Hauer SSP2
- Today (2025)
- 92,950 people
- By 2030
- 89,146 · -4.1%
- By 2040
- 80,715 · -13.2%
- By 2050
- 72,270 · -22.2%
- By 2075
- 55,780 · -40.0%
- By 2100
- 40,928 · -56.0%
Race, ethnicity, and origin ACS 2023
- Neighborhood character
- Predominantly White (79%)
- Race & ethnicity
- White 79% Hispanic / Latino 9% Two or more races 7% Black 6%
- Hispanic origin (detail)
- Mexican 3% Puerto Rican 5%
- Common ancestry
- Romanian 4% Iranian 2% Slovak 1%
- Foreign-born
- 3% · Canada
- Languages at home
- 94% English-only · Spanish 4%
Political lean MEDSL · Ashtabula
- 2024 margin
- Strong R (+28.4) · D 35.4% · R 63.8%
- 2008→2024 swing
- -41.9pp toward R · 2008: 13.5pp · 2024: -28.4pp
- All cycles
- 2024: R+28.4 2020: R+23.5 2016: R+19.0 2012: D+12.1 2008: D+13.5
Not yet ingested
- Civics
- —
Market trends
- HPI YoY
- ▼ -114.51%
- Current HPI
- 260.7146
- Rent YoY
- —
- Metro
- —
- State GDP YoY
- ▲ 1.98%
- F500 in state
- 48
Industry mix (Fortune 500 HQ in OH)
| Industry | F500 HQs | Revenue |
|---|---|---|
| Insurance | 3 | $145B |
|
||
| Industrial Machinery | 3 | $49B |
|
||
| Financial Services | 3 | $24B |
|
||
| Consumer Goods | 2 | $93B |
|
||
| Aerospace / Defense | 2 | $47B |
|
||
| Utilities | 2 | $33B |
|
||
Price history
+131.4% since first listed9 events — show timeline
- 2026-04-13 Listed $153,900 MLSNOW
- 2025-12-16 Listed $166,900 MLSNOW
- 2024-05-01 Listing Removed — MLSNOW
- 2024-04-25 Listed $167,000 MLSNOW
- 2013-10-14 Sold (MLS) $18,000 MLSNOW
- 2013-09-19 Listed $24,999 MLSNOW
- 1998-11-13 Sold (Public Records) $64,000 Public Records
- 1998-11-13 Sold (MLS) $64,000 MLSNOW
- 1998-08-25 Listed $66,500 MLSNOW
Property tax history
+15.1%/yrLatest (2025): $1,738 · +34.4% YoY. Source: county tax records.
Cash-flow waterfall
monthlySold comps — $/sqft
last 12 mo · ≤1 miLoading sold comps…