 Duplex
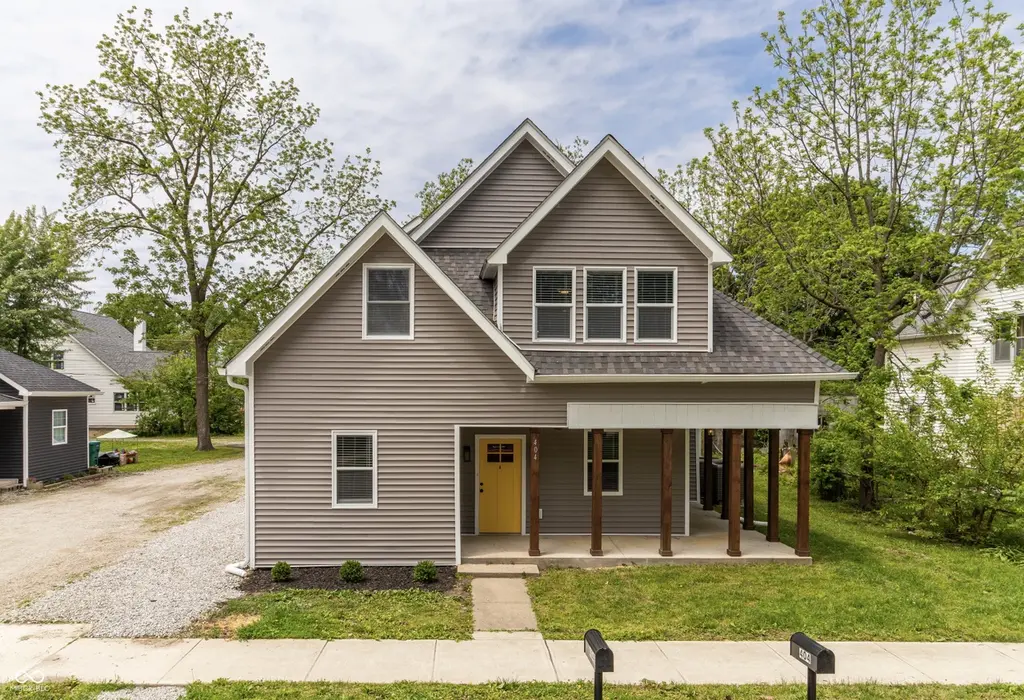
404 S Main St · Whitestown, IN
Flood risk 1/10 · Minimal
- FEMA flood zone
- X (unshaded)
- Chance of flooding over 30 yrs
- 0.0%
- Est. flood insurance / yr
- $507 – $1,088
Fire risk 1/10 · Minimal
- Est. fire insurance / yr
- $717 – $1,331
Heat risk 3/10 · Minor
- Hot days now (above 101°F)
- 7 days/yr
- Hot days in 30 yrs
- 18 days/yr
Wind risk 2/10 · Minimal
- Chance of severe wind over 30 yrs
- 1.0%
Air-quality risk 3/10 · Minor
- Unhealthy air days now
- 2 days/yr
- Unhealthy air days in 30 yrs
- 3 days/yr
Risk factors via First Street. Map © Google.
Why this score? — see what drove the C- grade
The composite is a weighted blend of 9 inputs, each scored 0–100. Each bar is that input's sub-score; the figure is the points it added to the 100-point composite (weight × sub-score).
- Cash flow +20.3/30.0
- ARV discount +7.5/15.0
- DSCR +6.4/10.0
- 1% rule +4.2/10.0
- Schools +3.7/10.0
- Livability +3.7/5.0
- Rent growth +2.7/5.0
- Condition / age +2.5/5.0
- Appreciation +0.0/10.0
$499,900
🖨 Deal sheet 📄 Offer letter ✓ Due diligence
Multi-family units
County records classify this as Multi-Family (2-4 Unit). Listing-text estimate: 2 units. confirmed
Listing remarks MLS
AMAZING INVESTOR OPPORTUNITY! PROPERTY IN THE HEART OF WHITESTOWN ON MAIN ST THAT HAS BEEN FRAMED FOR A 3 BED ON MAIN LEVEL, 3 BED ON SECOND LEVEL WITH OPTION TO MAKE A 4TH BED OR A 3RD UNIT AS A ONE BED AIRBNB. SO MUCH POTENTIAL AS PROPERTY CAN BE CONVERTED TO A SINGLE FAMILY HOME, A DUPLEX, OR A TRIPLEX AIRBNB. STRUCTURE SITS ON A LARGE LOT WITH SPACE TO ADD A GARAGE, OUTDOOR SPACE, ETC. CLOSE TO HWY ACCESS, SHOPPING, RESTAURANTS, & MORE!
Key facts
- Whitestown duplex
- Gross rental income
- Mid-term rentals
Tags
Property features AI
Finance
- Financial info: Two-unit property; Gross income: $5,400 monthly (combined listed rents); Unit 1 rent: $3,000 monthly; Unit 2 rent: $2,400 monthly; Net operating income: $59,952; Expenses listed (example entry): 404; Owner pays: taxes, trash collection, water; Insurance expense listed: 96
Exterior
- Parking: Parking lot; Alley access with gravel parking
- Security: Security system (owned); Smoke alarm; Carbon monoxide detector(s); Fire alarm
- Utilities: Municipal water; Municipal storm connection; Solid waste: No
- Home design: Duplex (residential income); Converted property; Two levels
- Construction: Vinyl siding; Crawl space foundation; Built as a duplex
- Exterior features: Asphalt roof; Sidewalks; Suburban setting; Alley access; Gravel parking areas; County road access; City street frontage
Interior
- Kitchen: Dishwasher; Disposal; Range/Oven; Refrigerator
- Bedrooms: Both units are 3-bedroom units
- Heating & cooling: Forced air heating; Central air conditioning
- Interior features: Updated/remodeled units; Smoke alarm; Carbon monoxide detector(s); Fire alarm; Security system (owned)
- Laundry & utility: In-unit washer and dryer; Dedicated laundry room
Neighborhood map
What this means for you Summary
Snapshot
- This is a 2 × 3-bed/2.0-bath units multifamily listed at $500k.
Deal economics
- At list price, monthly cash flow is $638 ($8k/yr) — positive. Per door: $319/mo.
- The deal already cash-flows at list — no discount required.
- To meet the 1% rule (rent ≥ 1% of price), the offer needs to be $458k (8.5% below list).
- Recommended offer: $458k (8.5% below list) — sets the bar for 1% rule.
- Cap rate 7.8% vs local median 4.3% in Whitestown — top-decile yield for the area; either an underpriced asset or a hidden risk that comps aren't pricing in. Stress-test before assuming the spread holds.
Location & tenants
- Location reads 73/100 on livability (#109 in IN) — a middle-class / working-renter tenant base. Strengths: employment A+, housing A+, cost of living A; Watch: amenities F, commute F, health & safety F.
- Lebanon Community School Corporation (town): math 41% / reading 44% proficiency, ranked #115 of 301 in IN (top 38%) — families likely to look elsewhere, expect single-tenant / working-renter base with shorter leases.
- Zoned schools: Perry Worth Elementary School (math 57% / reading 47%, grade C-, #237 of 994 statewide, top 26%, 430 students, 30% FRL); Lebanon Senior High School (math 43% / reading 68%, grade C, #75 of 369 statewide, top 20%, 1,027 students, 38% FRL) — zoned schools at 34% FRL track the district average.
- Market conditions: Rents flat; 268 active listings in the ZIP; 13 comparable units currently listed for rent nearby; rentals leasing fast (median 8d on market — plan ~1-2 weeks tenant-placement turnaround); high-income renter base; 898 units permitted in Boone County in 2024 (0 in 5+ unit buildings).
- At $4,575/mo this rent would consume 47% of the median local household income ($117k/yr) (locally 287% of renters already pay >50% of income on rent) — very limited rent-growth headroom before tenants either downsize or default.
Forward outlook
- Local home prices are declining (-3.0%/yr); year-one equity from $3k of loan paydown is wiped out by about $15k of value loss. Plan a longer hold.
- Boone County population projected at +46% by 2050 — long-run rental-demand tailwind backs the buy-and-hold thesis.
Negotiation context
- It's been on market 16 days — a 2% lower offer ($492k) is reasonable based on typical stale-listing flexibility.
- 4 sale attempts since 3y ago with the ask held roughly flat each time — persistent listings suggest the price (not the market) is what's stuck; bring a comps-based counter.
- Current owner paid $135k; list at $500k implies a 270% gain — meaningful room to come down on a strong offer.
Risks & watch-outs
- Watch-outs: built in 1901 — expect roof / HVAC / electrical / plumbing capex.
Questions for the listing agent
- Can we see the unit-by-unit rent roll, current vacancy, and any below-market leases? What's the average tenancy length?
- What capital expenditures (roof, boiler, parking lot, exteriors) have been made in the last 5 years, and what's planned in the next 2?
- Built in 1901 — when were the roof, HVAC, electrical panel, plumbing, and water heater last replaced?
- Is there a deadline driving the sale (1031 exchange, divorce, estate, relocation)? That informs how much negotiation room exists.
- Schools are A-rated — typically a magnet for longer-tenancy family renters. What's the average tenant stay here, and is there a school-zone premium baked into asking?
- What's the average days-on-market for RENTAL listings here right now (not sales)? A rising rental-DOM trend means longer vacancies and softer asking-rent achievability than the comps imply.
- What's the recent tenant-quality profile in this submarket — average credit score on applications, eviction rate, late-payment / NSF rate, and stable-employment percentage? A property-management company in the area should have these aggregated.
- How much new apartment / multifamily construction is in the pipeline within 1–3 miles? Heavy new supply (>2% of stock underway) typically softens rents 12–24 months out; light construction supports rent growth.
Investment metrics
- 1% rule
- 0.92% ✗
- Cap rate
- 7.82%
- Cash-on-cash
- 5.47%
- DSCR
- 1.24
- GRM
- 9.1
CMA / ARV
No comps found within radius.
Projected returns pro-forma
-3.0% appreciation · 0.77% rent growth · sell at horizon
- IRR
- -10.1%
- Equity multiple
- 0.64×
- Total profit
- $-50,635
- Equity at exit
- $74,537
- IRR
- -3.8%
- Equity multiple
- 0.77×
- Total profit
- $-32,083
- Equity at exit
- $43,222
Cash invested: $139,972 (down + closing). Projections, not guarantees.
Landlord ↔ Tenant lean methodology
- Overall (STATE)
- 90 Strongly Landlord-Friendly
- State Indiana
- 90 Strongly Landlord-Friendly · R+11
- County
- — inherits STATE
- City
- — inherits STATE
ZIP-level market 46075
- Home prices YoY
- -20.0%
- Rents YoY
- 0.8%
- Active inventory
- 268
- Price-to-rent
- 18.2×
Monthly cashflow live
- Estimated rent
- $4,575 high interval (Pro) →
- Mortgage (P&I)
- −$2,622
- Tax from tax record
- −$146 /mo · $1,757/yr
- Insurance
- −$208
- HOA
- −$0
- Vacancy / Maint / Mgmt
- −$961
- Net cashflow
- $638
Break-even live
2-unit breakdown (identical units grouped — click to expand)
| Units | Beds | Baths | Est. rent |
|---|---|---|---|
| 2× units | 3 | 2 | $4,574 |
| #1 | 3 | 2 | $2,287 |
| #2 | 3 | 2 | $2,287 |
| Total (2 units) | $4,575 | ||
UW: 25.0% down · 7.5% · 30yr · 1.5% tax · 5.0% vac · 8.0% maint · 8.0% mgmt
Financing live
Cash to close
- Down payment
- $124,975
- Closing costs
- $14,997
- Reserves months
- —
- Total cash needed
- —
Loan-product check · same deal, 3 products live
Conventional
25% down · 7.5% · 30yr
- Down + closing
- —
- Monthly P&I
- —
- Monthly cashflow
- —
- DSCR
- —
- Eligible?
- —
Personal DTI + credit; lowest rate.
DSCR
20% down · 8.5% · 30yr
- Down + closing
- —
- Monthly P&I
- —
- Monthly cashflow
- —
- DSCR
- —
- Eligible?
- —
No personal income docs; deal must DSCR.
Hard money
10% down · 12.0% · 12mo
- Down + closing
- —
- Monthly P&I
- —
- Monthly cashflow
- —
- DSCR
- —
- Eligible?
- —
Short-term bridge; refi at stabilization.
Rent comps 13 comps
| Address | Beds | Baths | Sqft | Rent | $/sqft | DOM | Units | Dist |
|---|---|---|---|---|---|---|---|---|
| 3340 Preakness St Whitestown, IN | 4.0 | 2.5 | 2426 | $2,699 | $1.11 | 2d | 1 | 0.21mi |
| 3766 White Cliff Way Unit 1464961P Whitestown, IN | 5.0 | 2.0 | 2798 | $5,704 | $2.04 | 2d | 1 | 0.49mi |
| 6251 Rhinecliff Dr Whitestown, IN | 5.0 | 2.5 | 2376 | $2,399 | $1.01 | 43d | 1 | 0.50mi |
| 2881 Cross Branch Dr Whitestown, IN | 3.0–4.0 | 2.5 | 1835 | $2,399 | $1.31 | 19d | 4 | 0.62mi |
| 2606 Plano Dr Unit NA Whitestown, IN | 4.0 | 3.0 | 2119 | $2,600 | $1.23 | 1d | 1 | 0.68mi |
| 2557 Lamar Dr Whitestown, IN | 4.0 | 2.5 | 1981 | $2,199 | $1.11 | 43d | 1 | 0.73mi |
| 2519 Dixon Creek Dr Whitestown, IN | 5.0 | 3.0 | 3867 | $2,530 | $0.65 | 1d | 1 | 0.87mi |
| 5773 Weeping Willow Pl Whitestown, IN | 4.0 | 2.5 | 2514 | $2,201 | $0.88 | 7d | 1 | 0.96mi |
| 6831 Orchard Run Cir Whitestown, IN | 4.0 | 2.5 | 2131 | $2,350 | $1.10 | 1d | 1 | 0.98mi |
| 7073 Fowler Dr Whitestown, IN | 4.0 | 3.5 | 2491 | $2,550 | $1.02 | 1d | 1 | 1.01mi |
| 6870 Teder Creek Ln Whitestown, IN | 5.0 | 3.0 | 2450 | $2,600 | $1.06 | 10d | 1 | 1.25mi |
| 2060 Dixon Creek Dr Whitestown, IN | 4.0 | 2.5 | 2401 | $700 | $0.29 | 21d | 1 | 1.26mi |
| 7183 Finley Creek Dr Whitestown, IN | 5.0 | 3.0 | 2540 | $2,700 | $1.06 | 43d | 1 | 1.40mi |
Listing history 10 events
-
2026-06-15days on market $499,900 Active 16 DOM
-
2026-06-13days on market $499,900 Active 14 DOM
-
2026-06-09days on market $499,900 Active 10 DOM
-
2026-06-08days on market $499,900 Active 9 DOM
-
2026-06-07days on market $499,900 Active 8 DOM
-
2026-06-03days on market $499,900 Active 4 DOM
-
2026-06-02days on market $499,900 Active 3 DOM
-
2026-06-01days on market $499,900 Active 2 DOM
-
2026-05-31remarks 699-char remark
-
2026-05-31$499,900 Active 1 DOM
ⓘ Source: listings_history table (triggers on properties + properties_extension) + one-shot
backfill from property_details.listing_events for pre-trigger history.
Tax reassessment forecast IN · Partial reset (capped growth)
- Current annual tax
- $1,757 · $146/mo
- Projected year-2 tax
- $3,003 · $250/mo
- Expected delta
- +$1,246/yr (+$104/mo · 71.0%)
ⓘ Screening estimate from a state-policy table — verify with the county assessor before closing.
Climate risk First Street
- Flood 1/10 Low FEMA zone X (unshaded) · 0% chance over 30 yrs
- Wildfire 1/10 Low
- Heat 3/10 Moderate 7 d/yr ≥101°F today · 18 d/yr by 30 yrs out
- Wind 2/10 Low 100% chance of damaging wind over 30 yrs
- Air quality 3/10 Moderate 2 unhealthy d/yr today · 3 by 30 yrs out
Nearby sold comps map
Loading sold comps map…
Walkable amenities ~0.75 mi
Loading nearby amenities…
Taxation est. · year 1
- Rental income
- $54,900
- − Mortgage interest
- −$28,002
- − Property taxes
- −$1,757
- − Insurance
- −$2,500
- − Repairs & maintenance
- −$4,392
- − Management
- −$4,392
- − Depreciation
- −$14,543
- Taxable loss
- −$685
- Est. tax savings @ 24.0%
- +$164
- After-tax cash flow
- $7,821/yr
For passive investors: Depreciation is non-cash, so a rental often shows a tax loss while cash-flowing — sheltering income. Rental losses are passive: they offset passive income freely, and up to $25,000/yr can offset ordinary (W-2) income if you actively participate and your MAGI is under $100k (phasing out to $0 by $150k); unused losses carry forward. On sale, claimed depreciation is recaptured at up to 25%, and gains may owe capital-gains tax (a 1031 exchange can defer both). Figures are a year-1 estimate at your 24.0% rate — not tax advice; consult a CPA.
Schools (NCES district)
- District
- Lebanon Community School Corporation
- NCES district ID
- 1805790
- Math proficiency
- 41% ▼ -11.00%
- Reading proficiency
- 44% ▼ -5.00%
- Median HH income
- $52,178
- Composite
- 36.77/100
- National rank
- #4571
- State rank
- #115 of 301 in IN
Livability — Whitestown
- Score
- 73/100
- State rank
- #109
- US rank
- #5691
Category grades
Schools grade is shown separately in the Schools card above.
Census & demographics
- Census place
- Whitestown, IN
- County
- Boone County · 69,822 people
- City population
- 9,509
- Metro
- Indianapolis-Carmel-Anderson, IN
- Population (ZIP)
- 9,509
- Household income
- $117,002
- Rent vs Own
- Severe rent burden
- 287.0
Population outlook (Boone County) Hauer SSP2
- Today (2025)
- 77,877 people
- By 2030
- 85,185 · +9.4%
- By 2040
- 99,753 · +28.1%
- By 2050
- 113,572 · +45.8%
- By 2075
- 145,674 · +87.1%
- By 2100
- 161,165 · +106.9%
Race, ethnicity, and origin ACS 2023
- Neighborhood character
- Predominantly White (84%)
- Race & ethnicity
- White 84% Two or more races 6% Asian 4% Hispanic / Latino 3% Black 3%
- Common ancestry
- Italian 4% Romanian 3% Slovak 2%
- Foreign-born
- 7% · Canada, China
- Languages at home
- 91% English-only · Other Indo-European 5% Spanish 2% Chinese 1%
Political lean MEDSL · Boone
- 2024 margin
- R (+16.0) · D 41.0% · R 57.0% · Other 2.0%
- 2008→2024 swing
- +9.8pp toward D · 2008: -25.8pp · 2024: -16.0pp
- All cycles
- 2024: R+16.0 2020: R+18.4 2016: R+29.5 2012: R+37.8 2008: R+25.8
Not yet ingested
- Civics
- —
Market trends
- HPI YoY
- ▼ -49.51%
- Current HPI
- 198.3353
- Rent YoY
- ▲ 0.77%
- Metro
- Indianapolis-Carmel-Anderson, IN
- State GDP YoY
- ▲ 2.90%
- F500 in state
- 18
Industry mix (Fortune 500 HQ in IN)
| Industry | F500 HQs | Revenue |
|---|---|---|
| Industrial Machinery | 2 | $37B |
|
||
| Healthcare | 1 | $177B |
|
||
| Pharmaceuticals | 1 | $45B |
|
||
| Metals / Steel | 1 | $18B |
|
||
| Agriculture | 1 | $17B |
|
||
| Packaging | 1 | $12B |
|
||
Price history
+138.0% since first listed10 events — show timeline
- 2026-05-30 Listed $499,900 MIBOR as Distributed by MLS Grid
- 2024-02-28 Sold (MLS) $135,000 MIBOR as Distributed by MLS Grid
- 2024-02-22 Pending — MIBOR as Distributed by MLS Grid
- 2024-02-22 Relisted — MIBOR as Distributed by MLS Grid
- 2024-02-05 Listing Removed — MIBOR as Distributed by MLS Grid
- 2024-02-05 Listing Removed — MIBOR as Distributed by MLS Grid
- 2023-12-06 Price Changed $179,000 MIBOR as Distributed by MLS Grid
- 2023-12-06 Price Changed $179,000 MIBOR as Distributed by MLS Grid
- 2023-11-15 Listed $210,000 MIBOR as Distributed by MLS Grid
- 2023-11-15 Listed $210,000 MIBOR as Distributed by MLS Grid
Property tax history
+4.3%/yrLatest (2025): $1,757 · +2.5% YoY. Source: county tax records.
Cash-flow waterfall
monthlySold comps — $/sqft
last 12 mo · ≤1 miLoading sold comps…