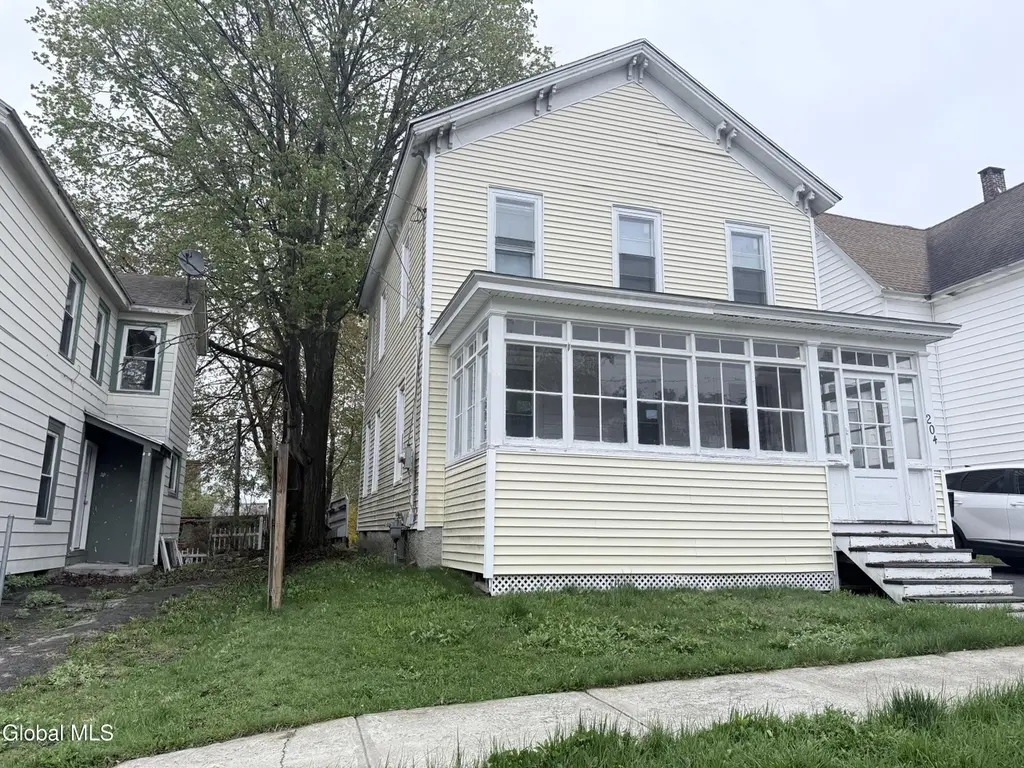
204 Glebe St · Johnstown, NY
Flood risk 1/10 · Minimal
- FEMA flood zone
- X
- Chance of flooding over 30 yrs
- 0.0%
- Est. flood insurance / yr
- $473 – $860
Fire risk 1/10 · Minimal
- Est. fire insurance / yr
- $691 – $1,283
Heat risk 3/10 · Minor
- Hot days now (above 94°F)
- 7 days/yr
- Hot days in 30 yrs
- 17 days/yr
Wind risk 2/10 · Minimal
- Chance of severe wind over 30 yrs
- 3.0%
Air-quality risk 1/10 · Minimal
- Unhealthy air days now
- 0 days/yr
- Unhealthy air days in 30 yrs
- 0 days/yr
Risk factors via First Street. Map © Google.
Why this score? — see what drove the B grade
The composite is a weighted blend of 9 inputs, each scored 0–100. Each bar is that input's sub-score; the figure is the points it added to the 100-point composite (weight × sub-score).
- Cash flow +21.7/30.0
- ARV discount +15.0/15.0
- Appreciation +10.0/10.0
- DSCR +6.9/10.0
- 1% rule +6.8/10.0
- Livability +3.9/5.0
- Schools +3.5/10.0
- Rent growth +2.5/5.0
- Condition / age +2.5/5.0
$99,900
🖨 Deal sheet 📄 Offer letter ✓ Due diligence
Listing remarks
Spacious 4-5 bedroom single-family home located in the heart of the city, featuring 2 bathrooms. This property offers generously sized bedrooms, including a master suite with a private bathroom. Washer and dryer hookups are available for your convenience. Enjoy a large backyard--perfect for outdoor activities and entertaining. Cash or conventional, being sold as is, inspections are for buyer's info only.
Key facts
- 5,227 sq ft lot
- 5 parking spots
- Built 1900
Property features AI
Exterior
- Parking: Five parking spaces
- Utilities: Public water; Public sewer; Electric service with circuit breakers
- Home design: Single family residence; Living area approximately 1,708
- Construction: Vinyl siding
- Exterior features: Backyard fencing; Paved driveway
Interior
- Kitchen: Kitchen on the first floor
- Bedrooms: Four bedrooms on the second floor; One bedroom on the first floor
- Bathrooms: One full bathroom (located on the second floor)
- Heating & cooling: Forced air heating; Window unit cooling
- Interior features: Storm door(s); Full basement
Neighborhood map
What this means for you Summary
Snapshot
- This is a 1-bed/1.0-bath single-family listed at $100k.
Deal economics
- At list price, monthly cash flow is $154 ($2k/yr) — positive.
- The deal already cash-flows at list — no discount required.
- Meets the 1% rule at list price ($1k rent vs $100k).
- Recommended offer: $97k (3.0% below list) — sets the bar for market timing.
- Cap rate 8.1% vs local median 4.0% in Johnstown — top-decile yield for the area; either an underpriced asset or a hidden risk that comps aren't pricing in. Stress-test before assuming the spread holds.
Location & tenants
- Location reads 78/100 on livability (#168 in NY, #2,603 nationally) — a middle-class / working-renter tenant base. Strengths: housing A+, health & safety A+, cost of living A; Watch: crime D-, amenities D-.
- Johnstown City School District (town): math 35% / reading 47% proficiency, ranked #509 of 590 in NY (top 86%) — families likely to look elsewhere, expect single-tenant / working-renter base with shorter leases.
- Market conditions: 82 active listings in the ZIP; 112 units permitted in Fulton County in 2024 (50 in 5+ unit buildings).
Forward outlook
- In year one you build about $11k of equity ($691 loan paydown + $10k appreciation (10.0% local appreciation)).
- Fulton County population projected at -23% by 2050 — secular population decline; favor cash flow + early exit over multi-decade hold.
- At projected returns (10.0% appreciation + 3.0% rent growth), your $28k cash investment doubles in ~3 years — after that, you're playing with house money.
- By year 4, paydown + projected appreciation supports a ~$38k cash-out refi (75% LTV) — recoverable capital for the next deal without selling this one.
Negotiation context
- It's been on market 51 days — a 3% lower offer ($97k) is reasonable based on typical stale-listing flexibility.
Risks & watch-outs
- Watch-outs: built in 1900 — expect roof / HVAC / electrical / plumbing capex.
Questions for the listing agent
- It's been on market 51 days. Have you received any prior offers? Is the seller open to a 3% concession, seller financing, or rate buy-down credit?
- Built in 1900 — when were the roof, HVAC, electrical panel, plumbing, and water heater last replaced?
- Is there a deadline driving the sale (1031 exchange, divorce, estate, relocation)? That informs how much negotiation room exists.
- Crime grade is D in this area — have there been break-ins, vandalism, or insurance claims at this property in the last 3 years? What carrier currently insures it and at what premium?
- What's the average days-on-market for RENTAL listings here right now (not sales)? A rising rental-DOM trend means longer vacancies and softer asking-rent achievability than the comps imply.
- What's the recent tenant-quality profile in this submarket — average credit score on applications, eviction rate, late-payment / NSF rate, and stable-employment percentage? A property-management company in the area should have these aggregated.
- How much new for-sale + rental construction is in the pipeline within 1–3 miles? Heavy new supply typically softens prices + rents 12–24 months out; constrained supply supports both.
Investment metrics
- 1% rule
- 1.18% ✓
- Cap rate
- 8.15%
- Cash-on-cash
- 6.62%
- DSCR
- 1.29
- GRM
- 7.1
CMA / ARV
- ARV (on-the-fly)
- $158,844
- Comps found
- 1
Show comp detail 1 sale within ~0.75 mi
| Address | Dist | Beds/Ba | Sqft | Sold | Price | $/sf | Match |
|---|---|---|---|---|---|---|---|
| 8 Woodland Dr | 0.63mi | 2/3.0 (+1) | 1,560 (-9%) | 4mo | $145,000 | $93 | 40 |
Match score weights: distance 35% · size 25% · config 20% · recency 20%. Top-matched comps best support the ARV.
Projected returns pro-forma
10.0% appreciation · 3.0% rent growth · sell at horizon
- IRR
- 29.1%
- Equity multiple
- 3.30×
- Total profit
- $64,311
- Equity at exit
- $89,998
- IRR
- 25.3%
- Equity multiple
- 7.50×
- Total profit
- $181,787
- Equity at exit
- $194,084
Cash invested: $27,972 (down + closing). Projections, not guarantees.
Landlord ↔ Tenant lean methodology
- Overall (STATE)
- 15 Strongly Tenant-Friendly
- State New York
- 15 Strongly Tenant-Friendly · D+10
- County
- — inherits STATE
- City
- — inherits STATE
ZIP-level market 12095
- Home prices YoY
- 3.8%
- Active inventory
- 82
- Price-to-rent
- 7.1×
Monthly cashflow live
- Estimated rent
- $1,174 medium interval (Pro) →
- Mortgage (P&I)
- −$524
- Tax from tax record
- −$208 /mo · $2,491/yr
- Insurance
- −$42
- HOA
- −$0
- Vacancy / Maint / Mgmt
- −$247
- Net cashflow
- $154
Break-even live
UW: 25.0% down · 7.5% · 30yr · 1.5% tax · 5.0% vac · 8.0% maint · 8.0% mgmt
Financing live
Cash to close
- Down payment
- $24,975
- Closing costs
- $2,997
- Reserves months
- —
- Total cash needed
- —
Loan-product check · same deal, 3 products live
Conventional
25% down · 7.5% · 30yr
- Down + closing
- —
- Monthly P&I
- —
- Monthly cashflow
- —
- DSCR
- —
- Eligible?
- —
Personal DTI + credit; lowest rate.
DSCR
20% down · 8.5% · 30yr
- Down + closing
- —
- Monthly P&I
- —
- Monthly cashflow
- —
- DSCR
- —
- Eligible?
- —
No personal income docs; deal must DSCR.
Hard money
10% down · 12.0% · 12mo
- Down + closing
- —
- Monthly P&I
- —
- Monthly cashflow
- —
- DSCR
- —
- Eligible?
- —
Short-term bridge; refi at stabilization.
Listing history 16 events
-
2026-06-18days on market $99,900 Active 51 DOM
-
2026-06-17days on market $99,900 Active 50 DOM
-
2026-06-16days on market $99,900 Active 49 DOM
-
2026-06-15days on market $99,900 Active 48 DOM
-
2026-06-13days on market $99,900 Active 46 DOM
-
2026-06-12days on market $99,900 Active 45 DOM
-
2026-06-09days on market $99,900 Active 42 DOM
-
2026-06-08days on market $99,900 Active 41 DOM
-
2026-06-07days on market $99,900 Active 40 DOM
-
2026-06-07days on market $99,900 Active 39 DOM
-
2026-06-04remarks 407-char remark
-
2026-06-04days on market $99,900 Active 36 DOM
-
2026-06-02days on market $99,900 Active 35 DOM
-
2026-06-01days on market $99,900 Active 34 DOM
-
2026-05-31days on market $99,900 Active 33 DOM
-
2026-04-26$99,900 Active
ⓘ Source: listings_history table (triggers on properties + properties_extension) + one-shot
backfill from property_details.listing_events for pre-trigger history.
Tax reassessment forecast NY · Partial reset (capped growth)
- Current annual tax
- $2,491 · $208/mo
- Projected year-2 tax
- $2,491 · $208/mo
- Expected delta
- $0/yr ($0/mo · 0.0%)
ⓘ Screening estimate from a state-policy table — verify with the county assessor before closing.
Climate risk First Street
- Flood 1/10 Low FEMA zone X · 0% chance over 30 yrs
- Wildfire 1/10 Low
- Heat 3/10 Moderate 7 d/yr ≥94°F today · 17 d/yr by 30 yrs out
- Wind 2/10 Low 3% chance of damaging wind over 30 yrs
- Air quality 1/10 Low 0 unhealthy d/yr today · 0 by 30 yrs out
Nearby sold comps map
Loading sold comps map…
Walkable amenities ~0.75 mi
Loading nearby amenities…
Taxation est. · year 1
- Rental income
- $14,089
- − Mortgage interest
- −$5,596
- − Property taxes
- −$2,491
- − Insurance
- −$500
- − Repairs & maintenance
- −$1,127
- − Management
- −$1,127
- − Depreciation
- −$2,906
- Taxable income
- $342
- Est. tax owed @ 24.0%
- −$82
- After-tax cash flow
- $1,771/yr
For passive investors: Depreciation is non-cash, so a rental often shows a tax loss while cash-flowing — sheltering income. Rental losses are passive: they offset passive income freely, and up to $25,000/yr can offset ordinary (W-2) income if you actively participate and your MAGI is under $100k (phasing out to $0 by $150k); unused losses carry forward. On sale, claimed depreciation is recaptured at up to 25%, and gains may owe capital-gains tax (a 1031 exchange can defer both). Figures are a year-1 estimate at your 24.0% rate — not tax advice; consult a CPA.
Schools (NCES district)
- District
- Johnstown City School District
- NCES district ID
- 3615980
- Math proficiency
- 35% ▼ -8.00%
- Reading proficiency
- 47% ▲ 4.00%
- Median HH income
- $45,999
- Composite
- 34.89/100
- National rank
- #5082
- State rank
- #509 of 590 in NY
Livability — Johnstown
- Score
- 78/100
- State rank
- #168
- US rank
- #2603
Category grades
Schools grade is shown separately in the Schools card above.
Census & demographics
- Census place
- Johnstown, NY
- Population (ZIP)
- 12,013
Population outlook (Fulton County) Hauer SSP2
- Today (2025)
- 51,132 people
- By 2030
- 49,114 · -3.9%
- By 2040
- 44,373 · -13.2%
- By 2050
- 39,321 · -23.1%
- By 2075
- 28,503 · -44.3%
- By 2100
- 19,268 · -62.3%
Race, ethnicity, and origin ACS 2023
- Neighborhood character
- Predominantly White (90%)
- Race & ethnicity
- White 90% Hispanic / Latino 4% Two or more races 4% Black 2%
- Common ancestry
- Iranian 6% Romanian 5% Lithuanian 4%
- Foreign-born
- 2% · Canada
- Languages at home
- 97% English-only · Spanish 2%
Political lean MEDSL · Fulton
- 2024 margin
- Solid R (+35.9) · D 32.1% · R 67.9%
- 2008→2024 swing
- -26.6pp toward R · 2008: -9.2pp · 2024: -35.9pp
- All cycles
- 2024: R+35.9 2020: R+31.4 2016: R+35.5 2012: R+10.5 2008: R+9.2
Not yet ingested
- Civics
- —
Market trends
- HPI YoY
- ▲ 10.82%
- Current HPI
- 297.365
- Rent YoY
- —
- Metro
- —
- State GDP YoY
- ▲ 2.60%
- F500 in state
- 92
Industry mix (Fortune 500 HQ in NY)
| Industry | F500 HQs | Revenue |
|---|---|---|
| Financial Services | 10 | $950B |
|
||
| Consumer Goods | 9 | $162B |
|
||
| Insurance | 4 | $225B |
|
||
| Telecommunications | 2 | $144B |
|
||
| Pharmaceuticals | 2 | $112B |
|
||
| Media / Entertainment | 2 | $69B |
|
||
Price history
1 event — show timeline
- 2026-04-26 Listed $99,900 Global MLS
Property tax history
+12.7%/yrLatest (2025): $2,491 · +5.8% YoY. Source: county tax records.
Cash-flow waterfall
monthlySold comps — $/sqft
last 12 mo · ≤1 miLoading sold comps…