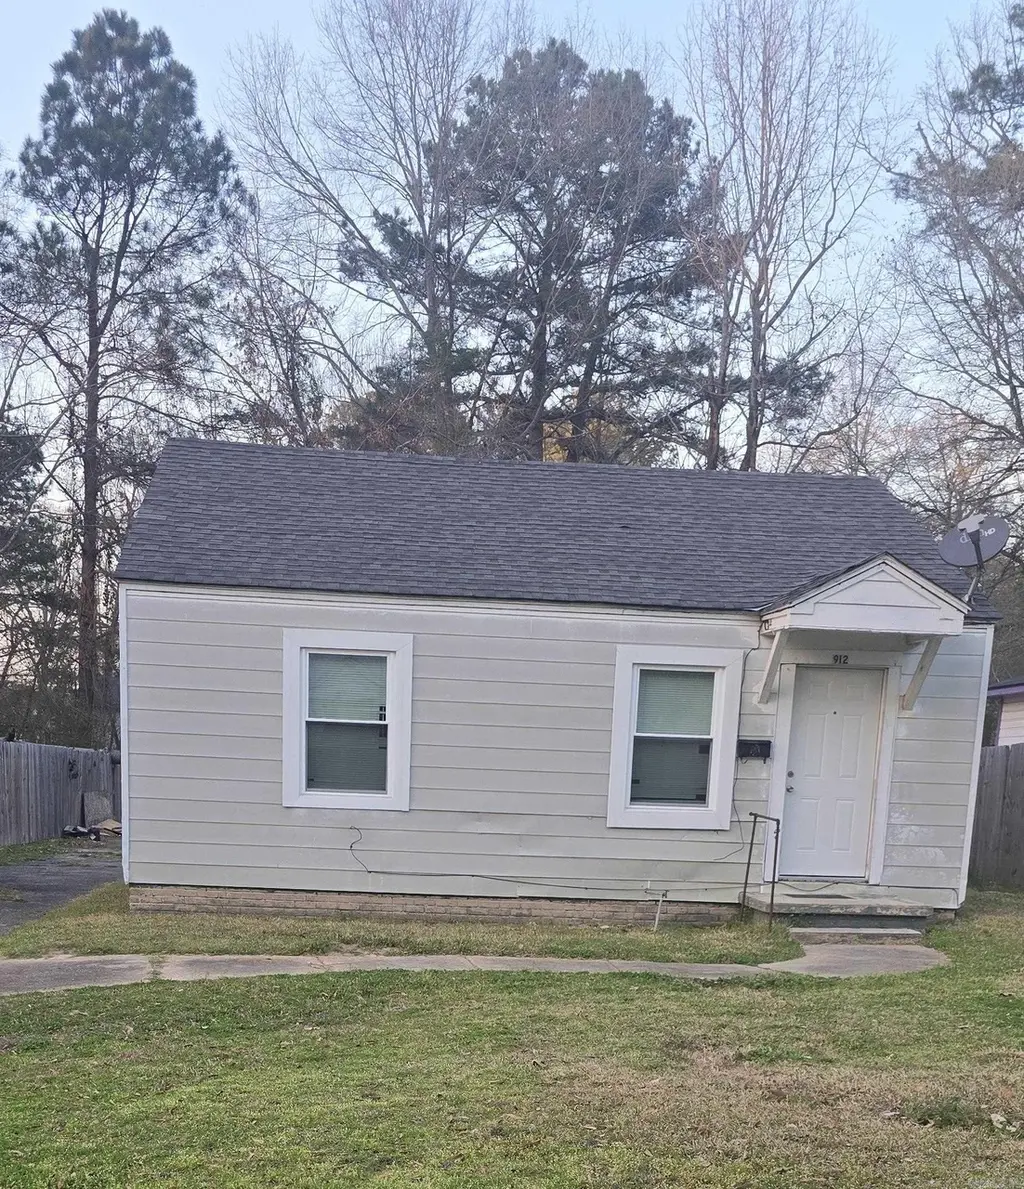
912 Ellen · Magnolia, AR
Flood risk No data
- FEMA flood zone
- —
- Chance of flooding over 30 yrs
- —
- Est. flood insurance / yr
- —
Fire risk No data
- Est. fire insurance / yr
- —
Heat risk No data
- Hot days now (above threshold)
- —
- Hot days in 30 yrs
- —
Wind risk No data
- Chance of severe wind over 30 yrs
- —
Air-quality risk No data
- Unhealthy air days now
- —
- Unhealthy air days in 30 yrs
- —
Risk factors via First Street. Map © Google.
Why this score? — see what drove the C+ grade
The composite is a weighted blend of 9 inputs, each scored 0–100. Each bar is that input's sub-score; the figure is the points it added to the 100-point composite (weight × sub-score).
- Cash flow +30.0/30.0
- 1% rule +10.0/10.0
- DSCR +10.0/10.0
- ARV discount +4.1/15.0
- Livability +3.2/5.0
- Rent growth +2.5/5.0
- Condition / age +2.5/5.0
- Schools +2.4/10.0
- Appreciation +0.0/10.0
$40,000
🖨 Deal sheet 📄 Offer letter ✓ Due diligence
Listing remarks
Attention investors and contractors this property presents an incredible opportunity to move a tenant right in. New steel doors, privacy fence, plumbing updated and new windows
Key facts
- Plumbing updated
- New steel doors
- Privacy fence
Tags
Property features AI
Finance
- Financial info: New conventional financing may be available
Exterior
- Utilities: Public water; Public sewer; Insulated windows; Wireless internet available
- Home design: Single-family residence (composition exterior noted); Composition roof; Crawl space foundation
- Construction: Composition exterior and roof; Crawl space foundation
- Exterior features: Wood fence; Level lot; Paved road access; Inside city limits
Interior
- Kitchen: Free-standing stove
- Bedrooms: Formal living room (listed as an additional room)
- Flooring: Laminate flooring
- Bathrooms: 1 full bathroom
- Heating & cooling: Window air conditioning units; Attic fan; Gas space heater
- Interior features: Washer stays; Dryer stays; Gas water heater; Smoke detectors; Ceiling fans; Kitchen counters with Formica; Sheetrock and paneling walls/ceilings
- Laundry & utility: Washer included; Dryer included
Neighborhood map
What this means for you Summary
Snapshot
- This is a 2-bed/1.0-bath single-family listed at $40k.
Deal economics
- At list price, monthly cash flow is $799 ($10k/yr) — positive.
- The deal already cash-flows at list — no discount required.
- Meets the 1% rule at list price ($1k rent vs $40k).
- Recommended offer: $39k (3.0% below list) — sets the bar for market timing.
- Cap rate 30.3% vs local median 3.1% in Magnolia — top-decile yield for the area; either an underpriced asset or a hidden risk that comps aren't pricing in. Stress-test before assuming the spread holds.
Location & tenants
- Location reads 65/100 on livability (#144 in AR) — a middle-class / working-renter tenant base. Strengths: cost of living A+, health & safety A+, housing B; Watch: schools D+, crime F, amenities F.
- Magnolia School District (town): math 29% / reading 28% proficiency, ranked #164 of 238 in AR (top 69%) — low school quality limits family demand, transient renter base, plan for 1-2y turnover; 63% free/reduced lunch — lower-income household profile, screen leases tightly.
- Market conditions: 38 active listings in the ZIP; 1 comparable units currently listed for rent nearby; 14 units permitted in Columbia County in 2024 (0 in 5+ unit buildings).
Forward outlook
- Local home prices are declining (-3.0%/yr); year-one equity from $277 of loan paydown is wiped out by about $1k of value loss. Plan a longer hold.
- Columbia County population projected at -11% by 2050 — secular population decline; favor cash flow + early exit over multi-decade hold.
- At projected returns (-3.0% appreciation + 3.0% rent growth), your $11k cash investment doubles in ~2 years — after that, you're playing with house money.
Negotiation context
- It's been on market 31 days — a 3% lower offer ($39k) is reasonable based on typical stale-listing flexibility.
- Current owner paid $22k; list at $40k implies a 82% gain — meaningful room to come down on a strong offer.
Risks & watch-outs
- Watch-outs: built in 1949 — expect roof / HVAC / electrical / plumbing capex.
Questions for the listing agent
- It's been on market 31 days. Have you received any prior offers? Is the seller open to a 3% concession, seller financing, or rate buy-down credit?
- Built in 1949 — when were the roof, HVAC, electrical panel, plumbing, and water heater last replaced?
- Is there a deadline driving the sale (1031 exchange, divorce, estate, relocation)? That informs how much negotiation room exists.
- Schools are D-rated, which usually means shorter tenancies and higher turnover. Who's the typical renter profile here, and what's been the actual vacancy rate?
- Crime grade is F in this area — have there been break-ins, vandalism, or insurance claims at this property in the last 3 years? What carrier currently insures it and at what premium?
- What's the average days-on-market for RENTAL listings here right now (not sales)? A rising rental-DOM trend means longer vacancies and softer asking-rent achievability than the comps imply.
- What's the recent tenant-quality profile in this submarket — average credit score on applications, eviction rate, late-payment / NSF rate, and stable-employment percentage? A property-management company in the area should have these aggregated.
- How much new for-sale + rental construction is in the pipeline within 1–3 miles? Heavy new supply typically softens prices + rents 12–24 months out; constrained supply supports both.
Investment metrics
- 1% rule
- 3.29% ✓
- Cap rate
- 30.27%
- Cash-on-cash
- 85.64%
- DSCR
- 4.81
- GRM
- 2.5
CMA / ARV
- ARV (on-the-fly)
- $37,224
- Comps found
- 1
Show comp detail 1 sale within ~0.75 mi
| Address | Dist | Beds/Ba | Sqft | Sold | Price | $/sf | Match |
|---|---|---|---|---|---|---|---|
| 823 W Main | 0.12mi | 2/1.0 | 833 (-2%) | 15mo | $37,000 | $44 | 80 |
Match score weights: distance 35% · size 25% · config 20% · recency 20%. Top-matched comps best support the ARV.
Projected returns pro-forma
-3.0% appreciation · 3.0% rent growth · sell at horizon
- IRR
- 86.1%
- Equity multiple
- 4.97×
- Total profit
- $44,425
- Equity at exit
- $5,964
- IRR
- 89.2%
- Equity multiple
- 10.31×
- Total profit
- $104,230
- Equity at exit
- $3,458
Cash invested: $11,200 (down + closing). Projections, not guarantees.
Landlord ↔ Tenant lean methodology
- Overall (STATE)
- 92 Strongly Landlord-Friendly
- State Arkansas
- 92 Strongly Landlord-Friendly · R+14
- County
- — inherits STATE
- City
- — inherits STATE
ZIP-level market 71753
- Home prices YoY
- -31.1%
- Active inventory
- 38
- Price-to-rent
- 2.5×
Monthly cashflow live
- Estimated rent
- $1,318 medium interval (Pro) →
- Mortgage (P&I)
- −$210
- Tax from tax record
- −$15 /mo · $181/yr
- Insurance
- −$17
- HOA
- −$0
- Vacancy / Maint / Mgmt
- −$277
- Net cashflow
- $799
Break-even live
UW: 25.0% down · 7.5% · 30yr · 1.5% tax · 5.0% vac · 8.0% maint · 8.0% mgmt
Financing live
Cash to close
- Down payment
- $10,000
- Closing costs
- $1,200
- Reserves months
- —
- Total cash needed
- —
Loan-product check · same deal, 3 products live
Conventional
25% down · 7.5% · 30yr
- Down + closing
- —
- Monthly P&I
- —
- Monthly cashflow
- —
- DSCR
- —
- Eligible?
- —
Personal DTI + credit; lowest rate.
DSCR
20% down · 8.5% · 30yr
- Down + closing
- —
- Monthly P&I
- —
- Monthly cashflow
- —
- DSCR
- —
- Eligible?
- —
No personal income docs; deal must DSCR.
Hard money
10% down · 12.0% · 12mo
- Down + closing
- —
- Monthly P&I
- —
- Monthly cashflow
- —
- DSCR
- —
- Eligible?
- —
Short-term bridge; refi at stabilization.
Rent comps 1 comps
| Address | Beds | Baths | Sqft | Rent | $/sqft | DOM | Units | Dist |
|---|---|---|---|---|---|---|---|---|
| 1032 Mullins St Magnolia, AR | 4.0 | 1.0–1.5 | 712 | $1,318 | $1.85 | 44d | 1 | 0.64mi |
Listing history 19 events
-
2026-06-19days on market $40,000 Active 31 DOM
-
2026-06-18days on market $40,000 Active 30 DOM
-
2026-06-17days on market $40,000 Active 29 DOM
-
2026-06-16days on market $40,000 Active 28 DOM
-
2026-06-15days on market $40,000 Active 27 DOM
-
2026-06-14days on market $40,000 Active 25 DOM
-
2026-06-12days on market $40,000 Active 24 DOM
-
2026-06-09days on market $40,000 Active 21 DOM
-
2026-06-08days on market $40,000 Active 20 DOM
-
2026-06-07days on market $40,000 Active 19 DOM
-
2026-06-07days on market $40,000 Active 18 DOM
-
2026-06-04days on market $40,000 Active 15 DOM
-
2026-06-02days on market $40,000 Active 14 DOM
-
2026-06-01days on market $40,000 Active 13 DOM
-
2026-05-31days on market $40,000 Active 12 DOM
-
2026-05-31days on market $40,000 Active 11 DOM
-
2026-05-18$40,000 New Listing
-
2015-06-25soldstatus $22,000
-
2000-12-06soldstatus $24,000
ⓘ Source: listings_history table (triggers on properties + properties_extension) + one-shot
backfill from property_details.listing_events for pre-trigger history.
Tax reassessment forecast AR · Resets to sale price
- Current annual tax
- $181 · $15/mo
- Projected year-2 tax
- $256 · $21/mo
- Expected delta
- +$75/yr (+$6/mo · 41.4%)
ⓘ Screening estimate from a state-policy table — verify with the county assessor before closing.
Nearby sold comps map
Loading sold comps map…
Walkable amenities ~0.75 mi
Loading nearby amenities…
Taxation est. · year 1
- Rental income
- $15,810
- − Mortgage interest
- −$2,241
- − Property taxes
- −$181
- − Insurance
- −$200
- − Repairs & maintenance
- −$1,265
- − Management
- −$1,265
- − Depreciation
- −$1,164
- Taxable income
- $9,495
- Est. tax owed @ 24.0%
- −$2,279
- After-tax cash flow
- $7,313/yr
For passive investors: Depreciation is non-cash, so a rental often shows a tax loss while cash-flowing — sheltering income. Rental losses are passive: they offset passive income freely, and up to $25,000/yr can offset ordinary (W-2) income if you actively participate and your MAGI is under $100k (phasing out to $0 by $150k); unused losses carry forward. On sale, claimed depreciation is recaptured at up to 25%, and gains may owe capital-gains tax (a 1031 exchange can defer both). Figures are a year-1 estimate at your 24.0% rate — not tax advice; consult a CPA.
Schools (NCES district)
- District
- Magnolia School District
- NCES district ID
- 0500044
- Math proficiency
- 29% ▼ -12.00%
- Reading proficiency
- 28% ▼ -10.00%
- Median HH income
- $35,467
- Composite
- 23.58/100
- National rank
- #7850
- State rank
- #164 of 238 in AR
Livability — Magnolia
- Score
- 65/100
- State rank
- #144
- US rank
- #12675
Category grades
Schools grade is shown separately in the Schools card above.
Census & demographics
- Census place
- Magnolia, AR
- Population (ZIP)
- 16,089
Population outlook (Columbia County) Hauer SSP2
- Today (2025)
- 23,099 people
- By 2030
- 22,536 · -2.4%
- By 2040
- 21,489 · -7.0%
- By 2050
- 20,536 · -11.1%
- By 2075
- 20,459 · -11.4%
- By 2100
- 19,797 · -14.3%
Race, ethnicity, and origin ACS 2023
- Neighborhood character
- Diverse neighborhood (Simpson 0.55)
- Race & ethnicity
- White 57% Black 36% Hispanic / Latino 4% Two or more races 3%
- Common ancestry
- Italian 2% Serbian 2% Slovak 2%
- Foreign-born
- 2% · Canada
- Languages at home
- 96% English-only · Spanish 3%
Political lean MEDSL · Columbia
- 2024 margin
- Solid R (+36.5) · D 31.1% · R 67.6% · Other 1.4%
- 2008→2024 swing
- -12.4pp toward R · 2008: -24.1pp · 2024: -36.5pp
- All cycles
- 2024: R+36.5 2020: R+31.2 2016: R+26.2 2012: R+23.6 2008: R+24.1
Not yet ingested
- Civics
- —
Market trends
- HPI YoY
- ▼ -65.64%
- Current HPI
- 145.3145
- Rent YoY
- —
- Metro
- —
- State GDP YoY
- ▲ 3.80%
- F500 in state
- 10
Industry mix (Fortune 500 HQ in AR)
| Industry | F500 HQs | Revenue |
|---|---|---|
| Retail | 1 | $681B |
|
||
| Food / Agriculture | 1 | $53B |
|
||
| Retail / Energy | 1 | $22B |
|
||
| Transportation / Logistics | 1 | $12B |
|
||
| Energy | 1 | $4B |
|
||
Price history
+66.7% since first listed3 events — show timeline
- 2026-05-18 Listed $40,000 CARMLS
- 2015-06-25 Sold (Public Records) $22,000 Public Records
- 2000-12-06 Sold (Public Records) $24,000 Public Records
Property tax history
+4.5%/yrLatest (2025): $181 · +5.4% YoY. Source: county tax records.
Cash-flow waterfall
monthlySold comps — $/sqft
last 12 mo · ≤1 miLoading sold comps…