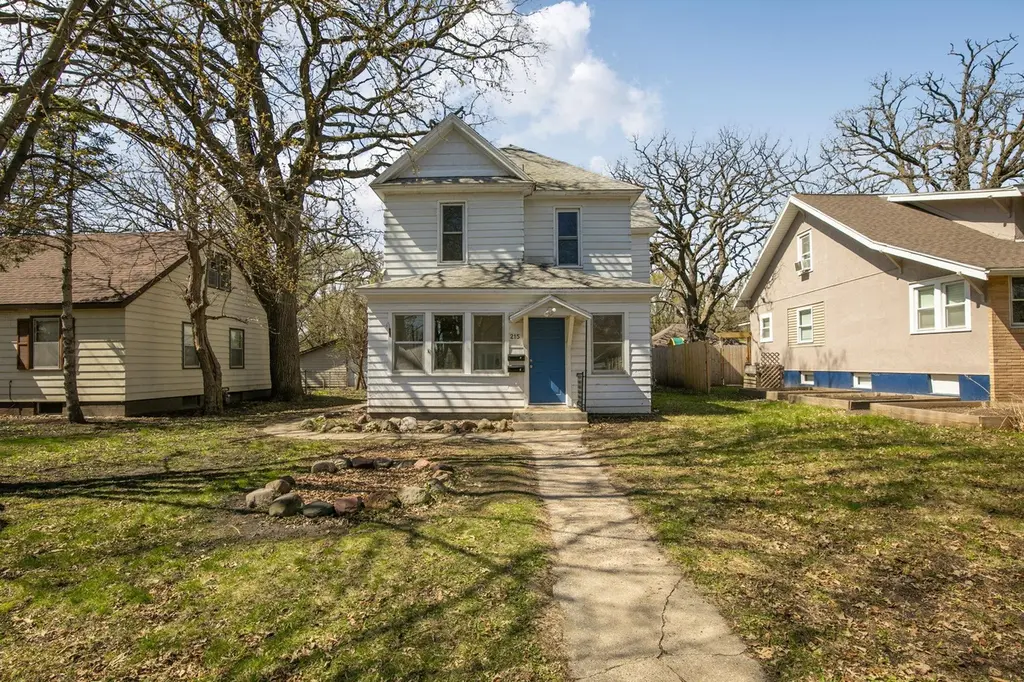
215 3rd Ave NE · St. Cloud, MN
Flood risk 1/10 · Minimal
- FEMA flood zone
- X (unshaded)
- Chance of flooding over 30 yrs
- 0.0%
- Est. flood insurance / yr
- $507 – $1,088
Fire risk 1/10 · Minimal
- Est. fire insurance / yr
- $888 – $1,650
Heat risk 2/10 · Minimal
- Hot days now (above 96°F)
- 7 days/yr
- Hot days in 30 yrs
- 13 days/yr
Wind risk 2/10 · Minimal
- Chance of severe wind over 30 yrs
- —
Air-quality risk 3/10 · Minor
- Unhealthy air days now
- 3 days/yr
- Unhealthy air days in 30 yrs
- 3 days/yr
Risk factors via First Street. Map © Google.
Why this score? — see what drove the C+ grade
The composite is a weighted blend of 9 inputs, each scored 0–100. Each bar is that input's sub-score; the figure is the points it added to the 100-point composite (weight × sub-score).
- Cash flow +26.0/30.0
- DSCR +8.7/10.0
- ARV discount +7.5/15.0
- 1% rule +6.9/10.0
- Rent growth +3.4/5.0
- Schools +2.8/10.0
- Livability +2.5/5.0
- Condition / age +2.5/5.0
- Appreciation +0.0/10.0
$159,000
🖨 Deal sheet 📄 Offer letter ✓ Due diligence
Listing remarks MLS
Cash Flow! This Duplex is reasonably priced and allows for instant cash flow. Unit 1 features main level living 2 bedrooms, 1 bathroom and over 1,000 square feet. Unit 2 is an upper level unit that offers 2 bedroom, 2 bathrooms, gas fireplace and just under 1000 square feet. Don't miss out on this great opportunity!
Key facts
- Generous lot
- Front porch
- Two stall garage
Tags
Property features AI
Finance
- Financial info: Property type is residential income with 2 total units; Gross income: $22,560; Net operating income: $16,820; Owner pays insurance, repairs, and taxes; Tenant pays electricity, fuel, lawn care, and snow removal; Water/sewer expense: $1,800; Insurance expense: $1,665; Maintenance expense: $1,200; Other annual assessment: $10
- HOA & community: Porch listed as an association amenity
Exterior
- Parking: Gravel parking; 2-car detached garage (28x28)
- Utilities: City water connected; City sewer connected; Natural gas; Electric service with circuit breakers
- Home design: Residential income duplex (up-and-down configuration); Two levels
- Construction: Block foundation; Asphalt roof (age 8 years or less)
- Exterior features: Enclosed porch; Metal exterior; City street frontage; Medium tree coverage; Public transit within about 6 blocks
Interior
- Kitchen: Each unit equipped with range and refrigerator
- Bedrooms: Total of 4 bedrooms (two 2-bedroom units)
- Bathrooms: Unit 1: 1 full bathroom; Unit 2: 1 full bathroom and 1 three-quarter bathroom
- Heating & cooling: Baseboard heating; Forced air
- Interior features: Full, unfinished basement; Common area laundry
- Laundry & utility: Common area laundry
Neighborhood map
What this means for you Summary
Snapshot
- This is a 4-bed/3.0-bath other listed at $159k.
Deal economics
- At list price, monthly cash flow is $396 ($5k/yr) — positive.
- The deal already cash-flows at list — no discount required.
- Meets the 1% rule at list price ($2k rent vs $159k).
- Recommended offer: $157k (1.5% below list) — sets the bar for market timing.
- Cap rate 9.3% vs local median 3.9% in St. Cloud — top-decile yield for the area; either an underpriced asset or a hidden risk that comps aren't pricing in. Stress-test before assuming the spread holds.
Location & tenants
- Location reads: area grade C — affects rentability + tenant quality, not the cash-flow math above.
- St. Cloud Public School District (urban): math 27% / reading 38% proficiency, ranked #264 of 301 in MN (top 88%) — families likely to look elsewhere, expect single-tenant / working-renter base with shorter leases.
- Market conditions: Rents rising (+3.8%/yr); 116 active listings in the ZIP; 7 comparable units currently listed for rent nearby; rentals lingering (median 44d on market — plan ~5-8 weeks vacancy on turnover, expect pricing pressure); 86% of comp listings sitting > 30 days — soft ceiling on asking rent; 82 units permitted in Benton County in 2024 (0 in 5+ unit buildings).
- This rent runs 39% of the median local income ($58k/yr) — at the standard rent-burdened threshold; future hikes will face affordability resistance.
Forward outlook
- Local home prices are declining (-3.0%/yr); year-one equity from $1k of loan paydown is wiped out by about $5k of value loss. Plan a longer hold.
- At projected returns (-3.0% appreciation + 3.8% rent growth), your $45k cash investment doubles in ~10 years — after that, you're playing with house money.
Negotiation context
- It's been on market 24 days — a 2% lower offer ($157k) is reasonable based on typical stale-listing flexibility.
- 5 sale attempts since 24y ago with the ask held roughly flat each time — persistent listings suggest the price (not the market) is what's stuck; bring a comps-based counter.
Risks & watch-outs
- Watch-outs: built in 1902 — expect roof / HVAC / electrical / plumbing capex.
Questions for the listing agent
- Built in 1902 — when were the roof, HVAC, electrical panel, plumbing, and water heater last replaced?
- Is there a deadline driving the sale (1031 exchange, divorce, estate, relocation)? That informs how much negotiation room exists.
- What's the average days-on-market for RENTAL listings here right now (not sales)? A rising rental-DOM trend means longer vacancies and softer asking-rent achievability than the comps imply.
- What's the recent tenant-quality profile in this submarket — average credit score on applications, eviction rate, late-payment / NSF rate, and stable-employment percentage? A property-management company in the area should have these aggregated.
- How much new for-sale + rental construction is in the pipeline within 1–3 miles? Heavy new supply typically softens prices + rents 12–24 months out; constrained supply supports both.
Investment metrics
- 1% rule
- 1.19% ✓
- Cap rate
- 9.28%
- Cash-on-cash
- 10.67%
- DSCR
- 1.47
- GRM
- 7.0
CMA / ARV
No comps found within radius.
Projected returns pro-forma
-3.0% appreciation · 3.79% rent growth · sell at horizon
- IRR
- 0.6%
- Equity multiple
- 1.02×
- Total profit
- $987
- Equity at exit
- $23,707
- IRR
- 11.0%
- Equity multiple
- 1.89×
- Total profit
- $39,740
- Equity at exit
- $13,747
Cash invested: $44,520 (down + closing). Projections, not guarantees.
Landlord ↔ Tenant lean methodology
- Overall (STATE)
- 46 Balanced
- State Minnesota
- 46 Balanced · D+2
- County
- — inherits STATE
- City
- — inherits STATE
ZIP-level market 56304
- Home prices YoY
- -21.4%
- Rents YoY
- 3.8%
- Active inventory
- 116
- Price-to-rent
- 7.0×
Monthly cashflow live
- Estimated rent
- $1,888 high interval (Pro) →
- Mortgage (P&I)
- −$834
- Tax from tax record
- −$195 /mo · $2,344/yr
- Insurance
- −$66
- HOA
- −$0
- Vacancy / Maint / Mgmt
- −$396
- Net cashflow
- $396
Break-even live
UW: 25.0% down · 7.5% · 30yr · 1.5% tax · 5.0% vac · 8.0% maint · 8.0% mgmt
Financing live
Cash to close
- Down payment
- $39,750
- Closing costs
- $4,770
- Reserves months
- —
- Total cash needed
- —
Loan-product check · same deal, 3 products live
Conventional
25% down · 7.5% · 30yr
- Down + closing
- —
- Monthly P&I
- —
- Monthly cashflow
- —
- DSCR
- —
- Eligible?
- —
Personal DTI + credit; lowest rate.
DSCR
20% down · 8.5% · 30yr
- Down + closing
- —
- Monthly P&I
- —
- Monthly cashflow
- —
- DSCR
- —
- Eligible?
- —
No personal income docs; deal must DSCR.
Hard money
10% down · 12.0% · 12mo
- Down + closing
- —
- Monthly P&I
- —
- Monthly cashflow
- —
- DSCR
- —
- Eligible?
- —
Short-term bridge; refi at stabilization.
Rent comps 7 comps
| Address | Beds | Baths | Sqft | Rent | $/sqft | DOM | Units | Dist |
|---|---|---|---|---|---|---|---|---|
| 723 5th Ave S Saint Cloud, MN | 4.0 | 2.5 | 2300 | $1,500 | $0.65 | 43d | 1 | 1.04mi |
| 1540 State Highway 23 Saint Cloud, MN | 1.0–3.0 | 1.0–2.0 | 1050 | $1,325 | $1.26 | 1d | 10 | 1.25mi |
| 801 15th Ave S Unit 1 St Cloud, MN | 4.0 | 2.0 | 1525 | $1,900 | $1.25 | 43d | 1 | 1.26mi |
| 1205 11th St SE Saint Cloud, MN | 4.0 | 2.0 | 1416 | $2,450 | $1.73 | 43d | 1 | 1.32mi |
| 1225 13th St SE Saint Cloud, MN | 4.0 | 3.0 | 1500 | $2,450 | $1.63 | 43d | 1 | 1.45mi |
| 444 23rd Ave N Saint Cloud, MN | 3.0 | 2.0 | 1373 | $1,745 | $1.27 | 43d | 1 | 1.45mi |
| 624 13th St S Unit US-201 St Cloud, MN | 4.0 | 1.0 | 1250 | $1,495 | $1.20 | 43d | 1 | 1.46mi |
Listing history 15 events
-
2026-05-17historical Contingent - Inspection 1104-char remark
-
2026-04-30$159,000 Active 1104-char remark
-
2020-03-02soldstatus $100,000
-
2020-02-26soldstatus $100,000 Sold 321-char remark
Show marketing remark (321 chars)
Cash Flow! This Duplex is reasonably priced and allows for instant cash flow. Unit 1 features main level living 2 bedrooms, 1 bathroom and over 1,000 square feet. Unit 2 is an upper level unit that offers 2 bedroom, 2 bathrooms, gas fireplace and just under 1000 square feet. Don't miss out on this great opportunity!
-
2020-01-09status Pending 321-char remark
Show marketing remark (321 chars)
Cash Flow! This Duplex is reasonably priced and allows for instant cash flow. Unit 1 features main level living 2 bedrooms, 1 bathroom and over 1,000 square feet. Unit 2 is an upper level unit that offers 2 bedroom, 2 bathrooms, gas fireplace and just under 1000 square feet. Don't miss out on this great opportunity!
-
2019-11-29historical Contingent - Inspection 321-char remark
Show marketing remark (321 chars)
Cash Flow! This Duplex is reasonably priced and allows for instant cash flow. Unit 1 features main level living 2 bedrooms, 1 bathroom and over 1,000 square feet. Unit 2 is an upper level unit that offers 2 bedroom, 2 bathrooms, gas fireplace and just under 1000 square feet. Don't miss out on this great opportunity!
-
2019-10-05$110,000 Active 321-char remark
Show marketing remark (321 chars)
Cash Flow! This Duplex is reasonably priced and allows for instant cash flow. Unit 1 features main level living 2 bedrooms, 1 bathroom and over 1,000 square feet. Unit 2 is an upper level unit that offers 2 bedroom, 2 bathrooms, gas fireplace and just under 1000 square feet. Don't miss out on this great opportunity!
-
2014-01-10soldstatus $78,000
-
2014-01-08soldstatus $78,000 Sold
Show marketing remark (173 chars)
Upper unit has new flooring & paint featuring 2BR/2BA. Main unit features hardwood floors, 2BR/1BA. FRONT PORCH. 2 WATER METERS, 2 ELEC METERS & BOXES, 2 GAS METERS.
-
2013-11-28historical Contingent - Inspection
Show marketing remark (173 chars)
Upper unit has new flooring & paint featuring 2BR/2BA. Main unit features hardwood floors, 2BR/1BA. FRONT PORCH. 2 WATER METERS, 2 ELEC METERS & BOXES, 2 GAS METERS.
-
2013-11-07status Active
Show marketing remark (173 chars)
Upper unit has new flooring & paint featuring 2BR/2BA. Main unit features hardwood floors, 2BR/1BA. FRONT PORCH. 2 WATER METERS, 2 ELEC METERS & BOXES, 2 GAS METERS.
-
2013-10-17historical Contingent - Inspection
Show marketing remark (173 chars)
Upper unit has new flooring & paint featuring 2BR/2BA. Main unit features hardwood floors, 2BR/1BA. FRONT PORCH. 2 WATER METERS, 2 ELEC METERS & BOXES, 2 GAS METERS.
-
2013-10-01$84,900 Active
Show marketing remark (173 chars)
Upper unit has new flooring & paint featuring 2BR/2BA. Main unit features hardwood floors, 2BR/1BA. FRONT PORCH. 2 WATER METERS, 2 ELEC METERS & BOXES, 2 GAS METERS.
-
2002-07-08soldstatus $89,000
-
2002-05-06$84,900
ⓘ Source: listings_history table (triggers on properties + properties_extension) + one-shot
backfill from property_details.listing_events for pre-trigger history.
Tax reassessment forecast MN · Partial reset (capped growth)
- Current annual tax
- $2,344 · $195/mo
- Projected year-2 tax
- $2,344 · $195/mo
- Expected delta
- $0/yr ($0/mo · 0.0%)
ⓘ Screening estimate from a state-policy table — verify with the county assessor before closing.
Climate risk First Street
- Flood 1/10 Low FEMA zone X (unshaded) · 0% chance over 30 yrs
- Wildfire 1/10 Low
- Heat 2/10 Low 7 d/yr ≥96°F today · 13 d/yr by 30 yrs out
- Wind 2/10 Low
- Air quality 3/10 Moderate 3 unhealthy d/yr today · 3 by 30 yrs out
Nearby sold comps map
Loading sold comps map…
Walkable amenities ~0.75 mi
Loading nearby amenities…
Taxation est. · year 1
- Rental income
- $22,652
- − Mortgage interest
- −$8,906
- − Property taxes
- −$2,344
- − Insurance
- −$795
- − Repairs & maintenance
- −$1,812
- − Management
- −$1,812
- − Depreciation
- −$4,625
- Taxable income
- $2,357
- Est. tax owed @ 24.0%
- −$566
- After-tax cash flow
- $4,185/yr
For passive investors: Depreciation is non-cash, so a rental often shows a tax loss while cash-flowing — sheltering income. Rental losses are passive: they offset passive income freely, and up to $25,000/yr can offset ordinary (W-2) income if you actively participate and your MAGI is under $100k (phasing out to $0 by $150k); unused losses carry forward. On sale, claimed depreciation is recaptured at up to 25%, and gains may owe capital-gains tax (a 1031 exchange can defer both). Figures are a year-1 estimate at your 24.0% rate — not tax advice; consult a CPA.
Schools (NCES district)
- District
- St. Cloud Public School District
- NCES district ID
- 2733510
- Math proficiency
- 27% ▼ -9.00%
- Reading proficiency
- 38% ▼ -5.00%
- Median HH income
- $46,638
- Composite
- 27.91/100
- National rank
- #6866
- State rank
- #264 of 301 in MN
Livability — St. Cloud
No livability data for this city. (Only ~50 U.S. cities are tracked.)
Census & demographics
- Census place
- St. Cloud, MN
- County
- Sherburne County · 120,363 people
- City population
- 60,914
- Metro
- Minneapolis-St. Paul-Bloomington, MN-WI
- Population (ZIP)
- 17,473
- Household income
- $58,148
- Rent vs Own
- Severe rent burden
- 1175.0
Population outlook (Benton County) Hauer SSP2
- Today (2025)
- 41,796 people
- By 2030
- 42,497 · +1.7%
- By 2040
- 43,143 · +3.2%
- By 2050
- 42,809 · +2.4%
- By 2075
- 39,973 · -4.4%
- By 2100
- 36,969 · -11.5%
Race, ethnicity, and origin ACS 2023
- Neighborhood character
- Predominantly White (65%)
- Race & ethnicity
- White 65% Black 17% Two or more races 9% Asian 5% Hispanic / Latino 4% Native American 2%
- Common ancestry
- Portuguese 6% Romanian 5% Slovak 3%
- Foreign-born
- 10% · Vietnam, Canada, China
- Languages at home
- 85% English-only · Spanish 3% Vietnamese 2% Other Asian/Pacific 1%
Political lean MEDSL · Benton
- 2024 margin
- Solid R (+35.9) · D 31.1% · R 67.0% · Other 1.8%
- 2008→2024 swing
- -26.2pp toward R · 2008: -9.8pp · 2024: -35.9pp
- All cycles
- 2024: R+35.9 2020: R+31.9 2016: R+36.3 2012: R+13.7 2008: R+9.8
Not yet ingested
- Civics
- —
Market trends
- HPI YoY
- ▼ -60.11%
- Current HPI
- 220.2539
- Rent YoY
- ▲ 3.79%
- Metro
- Minneapolis-St. Paul-Bloomington, MN-WI
- State GDP YoY
- ▲ 2.41%
- F500 in state
- 34
Industry mix (Fortune 500 HQ in MN)
| Industry | F500 HQs | Revenue |
|---|---|---|
| Healthcare | 2 | $407B |
|
||
| Retail | 2 | $150B |
|
||
| Consumer Goods | 2 | $32B |
|
||
| Industrial Machinery | 2 | $6B |
|
||
| Agriculture | 1 | $40B |
|
||
| Healthcare / Medical Devices | 1 | $32B |
|
||
Price history
+70.8% since first listed17 events — show timeline
- 2026-06-15 Sold (MLS) $145,000 NORTHSTARMLS as Distributed by MLS Grid
- 2026-05-25 Pending — NORTHSTARMLS as Distributed by MLS Grid
- 2026-05-17 Contingent — NORTHSTARMLS as Distributed by MLS Grid
- 2026-04-30 Listed $159,000 NORTHSTARMLS as Distributed by MLS Grid
- 2020-03-02 Sold (Public Records) $100,000 Public Records
- 2020-02-26 Sold (MLS) $100,000 NORTHSTARMLS as Distributed by MLS Grid
- 2020-01-09 Pending — NORTHSTARMLS as Distributed by MLS Grid
- 2019-11-29 Contingent — NORTHSTARMLS as Distributed by MLS Grid
- 2019-10-05 Listed $110,000 NORTHSTARMLS as Distributed by MLS Grid
- 2014-01-10 Sold (Public Records) $78,000 Public Records
- 2014-01-08 Sold (MLS) $78,000 NORTHSTARMLS as Distributed by MLS Grid
- 2013-11-28 Contingent — NORTHSTARMLS as Distributed by MLS Grid
- 2013-11-07 Relisted — NORTHSTARMLS as Distributed by MLS Grid
- 2013-10-17 Contingent — NORTHSTARMLS as Distributed by MLS Grid
- 2013-10-01 Listed $84,900 NORTHSTARMLS as Distributed by MLS Grid
- 2002-07-08 Sold (MLS) $89,000 NORTHSTARMLS as Distributed by MLS Grid
- 2002-05-06 Listed $84,900 NORTHSTARMLS as Distributed by MLS Grid
Property tax history
+1.8%/yrLatest (2025): $2,344 · +2.4% YoY. Source: county tax records.
Cash-flow waterfall
monthlySold comps — $/sqft
last 12 mo · ≤1 miLoading sold comps…