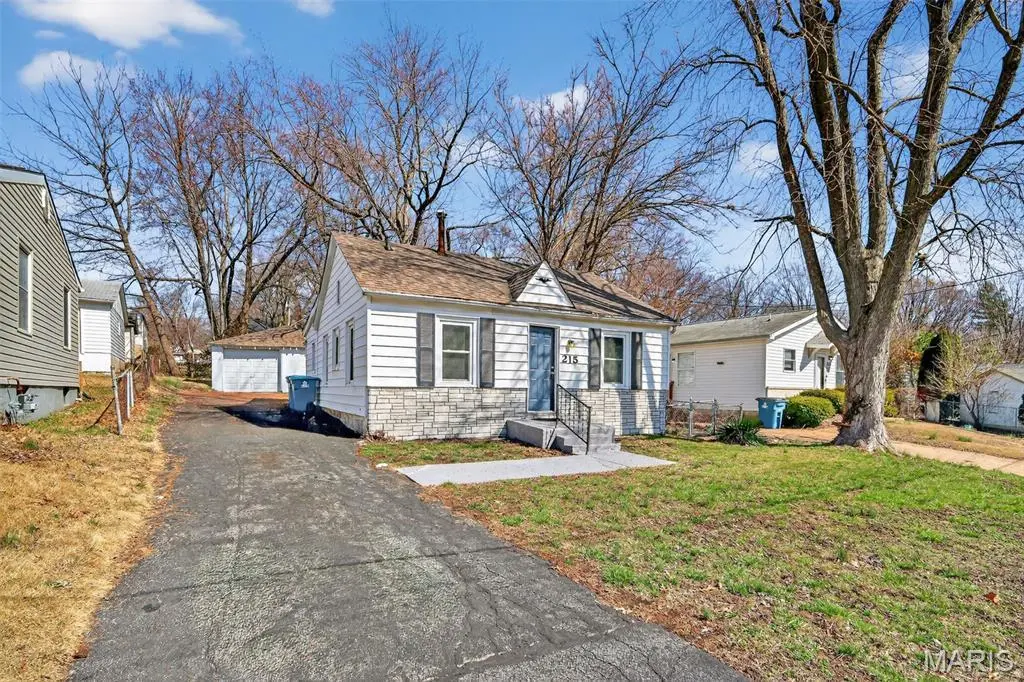
215 Ryan Ave · Hazelwood, MO
Flood risk 1/10 · Minimal
- FEMA flood zone
- X (unshaded)
- Chance of flooding over 30 yrs
- 0.0%
- Est. flood insurance / yr
- $507 – $1,088
Fire risk 1/10 · Minimal
- Est. fire insurance / yr
- $1,054 – $1,958
Heat risk 4/10 · Minor
- Hot days now (above 106°F)
- 7 days/yr
- Hot days in 30 yrs
- 20 days/yr
Wind risk 2/10 · Minimal
- Chance of severe wind over 30 yrs
- 1.0%
Air-quality risk 3/10 · Minor
- Unhealthy air days now
- 3 days/yr
- Unhealthy air days in 30 yrs
- 5 days/yr
Risk factors via First Street. Map © Google.
Why this score? — see what drove the C+ grade
The composite is a weighted blend of 9 inputs, each scored 0–100. Each bar is that input's sub-score; the figure is the points it added to the 100-point composite (weight × sub-score).
- Cash flow +30.0/30.0
- DSCR +10.0/10.0
- 1% rule +9.4/10.0
- Rent growth +4.8/5.0
- Livability +3.1/5.0
- Condition / age +2.5/5.0
- ARV discount +1.3/15.0
- Schools +1.2/10.0
- Appreciation +0.0/10.0
$89,900
🖨 Deal sheet 📄 Offer letter ✓ Due diligence
Listing remarks MLS
Located in Ferguson, Missouri, this one-story home offers 3 bedrooms and 1 full bathroom with a comfortable and functional layout. The property features inviting living spaces with plenty of natural light, providing practical single-level living. Situated in St. Louis County, the home offers convenient access to nearby shopping, dining, parks, and major roadways, making it easy to reach the greater St. Louis area while enjoying a quiet residential neighborhood setting.
Key facts
- One story home
- Convenient access
- Natural light
Tags
Neighborhood map
What this means for you Summary
Snapshot
- This is a 2-bed/1.0-bath single-family listed at $90k.
Deal economics
- At list price, monthly cash flow is $455 ($5k/yr) — positive.
- The deal already cash-flows at list — no discount required.
- Meets the 1% rule at list price ($1k rent vs $90k).
- Recommended offer: $85k (6.0% below list) — sets the bar for market timing.
- Cap rate 12.4% vs local median 7.2% in Hazelwood — top-decile yield for the area; either an underpriced asset or a hidden risk that comps aren't pricing in. Stress-test before assuming the spread holds.
Location & tenants
- Location reads 62/100 on livability (#395 in MO) — a middle-class / working-renter tenant base. Strengths: cost of living A+, housing A+; Watch: schools D-, crime F, amenities F.
- Ferguson-Florissant R-II (suburban): math 7% / reading 20% proficiency, ranked #311 of 324 in MO (top 96%) — low school quality limits family demand, transient renter base, plan for 1-2y turnover; 70% free/reduced lunch — lower-income household profile, screen leases tightly.
- Market conditions: Rents rising fast (+9.0%/yr); 162 active listings in the ZIP; 40 comparable units currently listed for rent nearby; rentals at typical pace (median 24d on market — plan ~3-4 weeks tenant-placement turnaround); 920 units permitted in St. Louis County in 2024 (250 in 5+ unit buildings).
Forward outlook
- Local home prices are declining (-3.0%/yr); year-one equity from $622 of loan paydown is wiped out by about $3k of value loss. Plan a longer hold.
- At projected returns (-3.0% appreciation + 8.0% rent growth), your $25k cash investment doubles in ~5 years — after that, you're playing with house money.
Negotiation context
- It's been on market 79 days — a 6% lower offer ($85k) is reasonable based on typical stale-listing flexibility.
- 4 sale attempts since 13y ago; this cycle's ask has dropped $5k (5%) from the opening price — seller is motivated, your offer sets the floor, not the list.
Risks & watch-outs
- Watch-outs: built in 1948 — expect roof / HVAC / electrical / plumbing capex.
Questions for the listing agent
- It's been on market 79 days. Have you received any prior offers? Is the seller open to a 6% concession, seller financing, or rate buy-down credit?
- Built in 1948 — when were the roof, HVAC, electrical panel, plumbing, and water heater last replaced?
- Why hasn't it sold? Are there any deal-killer items the seller is aware of (foundation, flood, title, zoning, code violations)?
- Is there a deadline driving the sale (1031 exchange, divorce, estate, relocation)? That informs how much negotiation room exists.
- Schools are D-rated, which usually means shorter tenancies and higher turnover. Who's the typical renter profile here, and what's been the actual vacancy rate?
- Crime grade is F in this area — have there been break-ins, vandalism, or insurance claims at this property in the last 3 years? What carrier currently insures it and at what premium?
- What's the average days-on-market for RENTAL listings here right now (not sales)? A rising rental-DOM trend means longer vacancies and softer asking-rent achievability than the comps imply.
- What's the recent tenant-quality profile in this submarket — average credit score on applications, eviction rate, late-payment / NSF rate, and stable-employment percentage? A property-management company in the area should have these aggregated.
- How much new for-sale + rental construction is in the pipeline within 1–3 miles? Heavy new supply typically softens prices + rents 12–24 months out; constrained supply supports both.
Investment metrics
- 1% rule
- 1.44% ✓
- Cap rate
- 12.36%
- Cash-on-cash
- 21.68%
- DSCR
- 1.96
- GRM
- 5.8
CMA / ARV
- ARV (median comp)
- $78,954
- List price
- $89,900
- Delta
- 13.86%
- Verdict
- OVERPRICED
- Comps
- 20 within 1.0 mi
Show comp detail 12 sales within ~0.75 mi
| Address | Dist | Beds/Ba | Sqft | Sold | Price | $/sf | Match |
|---|---|---|---|---|---|---|---|
| 135 Anistasia Dr | 0.32mi | 2/1.0 | 792 (+1%) | 4mo | $94,900 | $120 | 80 |
| 141 Flora Dr | 0.36mi | 2/1.0 | 800 (+2%) | 5mo | $70,000 | $88 | 76 |
| 233 Buddie Ave | 0.25mi | 2/1.0 | 862 (+10%) | 0mo | $74,900 | $87 | 72 |
| 110 Barto Dr | 0.49mi | 2/1.0 | 816 (+4%) | 5mo | $65,000 | $80 | 66 |
| 43 Connolly Dr | 0.50mi | 2/1.0 | 816 (+4%) | 5mo | $116,900 | $143 | 66 |
| 217 Anistasia Dr | 0.15mi | 3/1.5 (+1) | 864 (+10%) | 4mo | $64,900 | $75 | 66 |
| 6717 Thurston Ave | 0.47mi | 2/1.0 | 840 (+7%) | 2mo | $60,000 | $71 | 65 |
| 100 Du Bourg Ln | 0.54mi | 2/1.0 | 816 (+4%) | 6mo | $165,000 | $202 | 63 |
| 194 Elbring Dr | 0.24mi | 3/1.5 (+1) | 864 (+10%) | 3mo | $109,600 | $127 | 62 |
| 6640 Torlina Dr | 0.50mi | 2/1.0 | 720 (-8%) | 2mo | $89,500 | $124 | 62 |
| 116 Barto Dr | 0.47mi | 3/1.0 (+1) | 836 (+7%) | 3mo | $115,000 | $138 | 59 |
| 6612 Torlina Dr | 0.56mi | 2/1.0 | 840 (+7%) | 6mo | $50,000 | $60 | 57 |
Match score weights: distance 35% · size 25% · config 20% · recency 20%. Top-matched comps best support the ARV.
Projected returns pro-forma
-3.0% appreciation · 8.0% rent growth · sell at horizon
- IRR
- 19.6%
- Equity multiple
- 1.84×
- Total profit
- $21,205
- Equity at exit
- $13,404
- IRR
- 30.9%
- Equity multiple
- 4.45×
- Total profit
- $86,749
- Equity at exit
- $7,773
Cash invested: $25,172 (down + closing). Projections, not guarantees.
Landlord ↔ Tenant lean methodology
- Overall (STATE)
- 81 Strongly Landlord-Friendly
- State Missouri
- 81 Strongly Landlord-Friendly · R+10
- County
- — inherits STATE
- City
- — inherits STATE
ZIP-level market 63135
- Rents YoY
- 9.0%
- Active inventory
- 162
- Price-to-rent
- 5.8×
Monthly cashflow live
- Estimated rent
- $1,291 high interval (Pro) →
- Mortgage (P&I)
- −$471
- Tax from tax record
- −$56 /mo · $673/yr
- Insurance
- −$37
- HOA
- −$0
- Vacancy / Maint / Mgmt
- −$271
- Net cashflow
- $455
Break-even live
UW: 25.0% down · 7.5% · 30yr · 1.5% tax · 5.0% vac · 8.0% maint · 8.0% mgmt
Financing live
Cash to close
- Down payment
- $22,475
- Closing costs
- $2,697
- Reserves months
- —
- Total cash needed
- —
Loan-product check · same deal, 3 products live
Conventional
25% down · 7.5% · 30yr
- Down + closing
- —
- Monthly P&I
- —
- Monthly cashflow
- —
- DSCR
- —
- Eligible?
- —
Personal DTI + credit; lowest rate.
DSCR
20% down · 8.5% · 30yr
- Down + closing
- —
- Monthly P&I
- —
- Monthly cashflow
- —
- DSCR
- —
- Eligible?
- —
No personal income docs; deal must DSCR.
Hard money
10% down · 12.0% · 12mo
- Down + closing
- —
- Monthly P&I
- —
- Monthly cashflow
- —
- DSCR
- —
- Eligible?
- —
Short-term bridge; refi at stabilization.
Rent comps 40 comps
| Address | Beds | Baths | Sqft | Rent | $/sqft | DOM | Units | Dist |
|---|---|---|---|---|---|---|---|---|
| 260 Sadonia Ave Saint Louis, MO | 3.0 | 2.0 | 1088 | $1,623 | $1.49 | 20d | 1 | 0.11mi |
| 263 Sadonia Ave Saint Louis, MO | 3.0 | 2.0 | 888 | $1,350 | $1.52 | 43d | 1 | 0.14mi |
| 7025 Richwood Ln Hazelwood, MO | 3.0 | 1.0 | 936 | $1,375 | $1.47 | 17d | 1 | 0.24mi |
| 171 Elbring Dr Saint Louis, MO | 3.0 | 1.5 | 1008 | $1,395 | $1.38 | 12d | 1 | 0.25mi |
| 8330 Woodhurst Dr Saint Louis, MO | 3.0 | 1.0 | 1120 | $1,000 | $0.89 | 7d | 1 | 0.26mi |
| 204 Flora Dr Saint Louis, MO | 1.0 | 1.0 | 760 | $850 | $1.12 | 7d | 1 | 0.29mi |
| 153 Bascom Dr Saint Louis, MO | 3.0 | 1.0 | 1076 | $1,195 | $1.11 | 20d | 1 | 0.29mi |
| 241 Flora Dr Saint Louis, MO | 2.0 | 1.0 | 703 | $1,075 | $1.53 | 23d | 1 | 0.30mi |
| 107 Anistasia Dr Saint Louis, MO | 2.0 | 2.0 | 1030 | $1,400 | $1.36 | 23d | 1 | 0.38mi |
| 46 Bascom Dr Saint Louis, MO | 2.0 | 1.0 | 932 | $1,175 | $1.26 | 43d | 1 | 0.41mi |
| 220 Du Bourg Ln Florissant, MO | 2.0 | 1.0 | 816 | $1,150 | $1.41 | 43d | 1 | 0.45mi |
| 221 Barto Dr Saint Louis, MO | 3.0 | 2.0 | 958 | $1,295 | $1.35 | 20d | 1 | 0.47mi |
| 36 Connolly Dr Saint Louis, MO | 3.0 | 1.0 | 1024 | $1,149 | $1.12 | 23d | 1 | 0.50mi |
| 11 Anistasia Dr Saint Louis, MO | 3.0 | 1.5 | 1120 | $1,345 | $1.20 | 23d | 1 | 0.50mi |
| 1275 N Florissant Rd Saint Louis, MO | 2.0 | 1.0 | 1008 | $1,275 | $1.26 | 23d | 1 | 0.50mi |
| 24 Vierling Dr Saint Louis, MO | 2.0 | 1.0 | 850 | $1,290 | $1.52 | 7d | 1 | 0.52mi |
| 6625 Thurston Ave Saint Louis, MO | 2.0 | 1.0 | 939 | $1,300 | $1.38 | 43d | 1 | 0.55mi |
| 6625 Thurston Ave Saint Louis, MO | 2.0 | 1.0 | 939 | $1,400 | $1.49 | 23d | 1 | 0.55mi |
| 24 Barto Dr Saint Louis, MO | 3.0 | 1.0 | 864 | $1,400 | $1.62 | 43d | 1 | 0.55mi |
| 8507 Tally Ho Dr Hazelwood, MO | 2.0 | 1.5 | 1478 | $1,300 | $0.88 | 43d | 5 | 0.74mi |
| 1465 W Duchesne Dr Florissant, MO | 3.0 | 1.0 | 896 | $1,500 | $1.67 | 43d | 1 | 0.83mi |
| 6336 Washington Ave Berkeley, MO | 2.0 | 1.0 | 720 | $1,175 | $1.63 | 43d | 1 | 0.84mi |
| 6334 Washington Ave Berkeley, MO | 3.0 | 1.0 | 864 | $1,100 | $1.27 | 4d | 1 | 0.85mi |
| 6333 Peurifoy Ave Saint Louis, MO | 3.0 | 2.0 | 840 | $1,295 | $1.54 | 23d | 1 | 0.88mi |
| 6315 Washington Ave Berkeley, MO | 2.0 | 1.0 | 739 | $1,175 | $1.59 | 16d | 1 | 0.90mi |
| 1180 S New Florissant Rd Florissant, MO | 3.0 | 1.0 | 925 | $1,225 | $1.32 | 23d | 1 | 0.92mi |
| 135 Saint Maurice Ln Florissant, MO | 3.0 | 1.0 | 816 | $1,395 | $1.71 | 43d | 1 | 0.95mi |
| 6214 Jefferson Ave Saint Louis, MO | 2.0 | 1.0 | 816 | $1,195 | $1.46 | 23d | 1 | 1.02mi |
| 6234 Hancock Ave Berkeley, MO | 2.0 | 1.0 | 846 | $1,050 | $1.24 | 43d | 1 | 1.05mi |
| 8306 Whitewater Dr Saint Louis, MO | 3.0 | 1.0 | 792 | $1,195 | $1.51 | 7d | 1 | 1.10mi |
| 6132 Eaton Dr Saint Louis, MO | 2.0 | 1.0 | 792 | $1,125 | $1.42 | 23d | 1 | 1.11mi |
| 50 Lynn Meadows Ln Florissant, MO | 3.0 | 1.0 | 864 | $1,450 | $1.68 | 23d | 1 | 1.12mi |
| 222 Henquin Dr Saint Louis, MO | 2.0 | 1.0 | 816 | $1,050 | $1.29 | 17d | 1 | 1.14mi |
| 6044 Cascade Dr Saint Louis, MO | 2.0 | 1.0 | 984 | $1,150 | $1.17 | 7d | 1 | 1.16mi |
| 6156 Wulff Dr Saint Louis, MO | 3.0 | 2.0 | 960 | $1,425 | $1.48 | 10d | 1 | 1.17mi |
| 6042 Hancock Ave Berkeley, MO | 3.0 | 1.0 | 1041 | $1,495 | $1.44 | 23d | 1 | 1.34mi |
| 60 Mayme Dr Saint Louis, MO | 3.0 | 1.0 | 960 | $1,285 | $1.34 | 43d | 1 | 1.34mi |
| 297 Saint Eugene Ln Florissant, MO | 2.0 | 1.0 | 1100 | $1,100 | $1.00 | 43d | 1 | 1.35mi |
| 1600 Washington St Florissant, MO | 3.0 | 1.5 | 1095 | $1,250 | $1.14 | 20d | 1 | 1.36mi |
| 910 Disco Dr Saint Louis, MO | 3.0 | 1.0 | 924 | $1,260 | $1.36 | 16d | 1 | 1.38mi |
Listing history 33 events
-
2026-06-18days on market $89,900 Active 79 DOM
-
2026-06-17days on market $89,900 Active 78 DOM
-
2026-06-16days on market $89,900 Active 77 DOM
-
2026-06-15days on market $89,900 Active 76 DOM
-
2026-06-13days on market $89,900 Active 74 DOM
-
2026-06-13days on market $89,900 Active 73 DOM
-
2026-06-09days on market $89,900 Active 70 DOM
-
2026-06-08days on market $89,900 Active 69 DOM
-
2026-06-07days on market $89,900 Active 68 DOM
-
2026-06-05days on market $89,900 Active 65 DOM
-
2026-06-03days on market $89,900 Active 64 DOM
-
2026-06-02days on market $89,900 Active 63 DOM
-
2026-06-01days on market $89,900 Active 62 DOM
-
2026-05-31days on market $89,900 Active 61 DOM
-
2026-04-14status Active 473-char remark
Show marketing remark (473 chars)
Located in Ferguson, Missouri, this one-story home offers 3 bedrooms and 1 full bathroom with a comfortable and functional layout. The property features inviting living spaces with plenty of natural light, providing practical single-level living. Situated in St. Louis County, the home offers convenient access to nearby shopping, dining, parks, and major roadways, making it easy to reach the greater St. Louis area while enjoying a quiet residential neighborhood setting.
-
2026-03-27status Pending 473-char remark
Show marketing remark (473 chars)
Located in Ferguson, Missouri, this one-story home offers 3 bedrooms and 1 full bathroom with a comfortable and functional layout. The property features inviting living spaces with plenty of natural light, providing practical single-level living. Situated in St. Louis County, the home offers convenient access to nearby shopping, dining, parks, and major roadways, making it easy to reach the greater St. Louis area while enjoying a quiet residential neighborhood setting.
-
2026-03-13$94,900 Active 473-char remark
Show marketing remark (473 chars)
Located in Ferguson, Missouri, this one-story home offers 3 bedrooms and 1 full bathroom with a comfortable and functional layout. The property features inviting living spaces with plenty of natural light, providing practical single-level living. Situated in St. Louis County, the home offers convenient access to nearby shopping, dining, parks, and major roadways, making it easy to reach the greater St. Louis area while enjoying a quiet residential neighborhood setting.
-
2018-01-05soldstatus $1,067,500
-
2016-09-30price $39,400
-
2016-07-27price $39,900
-
2014-05-21soldstatus $28,000
-
2014-05-16soldstatus
-
2014-02-06$29,900
-
2013-12-23soldstatus $13,000
-
2013-12-20soldstatus
-
2013-01-07$18,900
-
2009-11-10soldstatus $32,000
-
2005-07-08soldstatus $42,500
-
2005-06-29soldstatus $37,000
-
2005-03-01soldstatus
-
1995-06-12soldstatus $32,500
-
1995-02-02soldstatus
-
1995-02-01soldstatus
ⓘ Source: listings_history table (triggers on properties + properties_extension) + one-shot
backfill from property_details.listing_events for pre-trigger history.
Tax reassessment forecast MO · Resets to sale price
- Current annual tax
- $673 · $56/mo
- Projected year-2 tax
- $872 · $73/mo
- Expected delta
- +$199/yr (+$17/mo · 29.6%)
ⓘ Screening estimate from a state-policy table — verify with the county assessor before closing.
Climate risk First Street
- Flood 1/10 Low FEMA zone X (unshaded) · 0% chance over 30 yrs
- Wildfire 1/10 Low
- Heat 4/10 Moderate 7 d/yr ≥106°F today · 20 d/yr by 30 yrs out
- Wind 2/10 Low 100% chance of damaging wind over 30 yrs
- Air quality 3/10 Moderate 3 unhealthy d/yr today · 5 by 30 yrs out
Nearby sold comps map
Loading sold comps map…
Walkable amenities ~0.75 mi
Loading nearby amenities…
Taxation est. · year 1
- Rental income
- $15,490
- − Mortgage interest
- −$5,036
- − Property taxes
- −$673
- − Insurance
- −$450
- − Repairs & maintenance
- −$1,239
- − Management
- −$1,239
- − Depreciation
- −$2,615
- Taxable income
- $4,238
- Est. tax owed @ 24.0%
- −$1,017
- After-tax cash flow
- $4,440/yr
For passive investors: Depreciation is non-cash, so a rental often shows a tax loss while cash-flowing — sheltering income. Rental losses are passive: they offset passive income freely, and up to $25,000/yr can offset ordinary (W-2) income if you actively participate and your MAGI is under $100k (phasing out to $0 by $150k); unused losses carry forward. On sale, claimed depreciation is recaptured at up to 25%, and gains may owe capital-gains tax (a 1031 exchange can defer both). Figures are a year-1 estimate at your 24.0% rate — not tax advice; consult a CPA.
Schools (NCES district)
- District
- Ferguson-Florissant R-II
- NCES district ID
- 2912010
- Math proficiency
- 7% ▼ -9.00%
- Reading proficiency
- 20% ▼ -6.00%
- Median HH income
- $44,610
- Composite
- 11.96/100
- National rank
- #9666
- State rank
- #311 of 324 in MO
Livability — Hazelwood
- Score
- 62/100
- State rank
- #395
- US rank
- #16956
Category grades
Schools grade is shown separately in the Schools card above.
Census & demographics
- Census place
- Hazelwood, MO
- County
- Saint Louis County · 888,823 people
- City population
- 17,813
- Metro
- St. Louis, MO-IL
- Population (ZIP)
- 18,381
- Household income
- $52,328
- Rent vs Own
- Severe rent burden
- 957.0
Population outlook (St. Louis County) Hauer SSP2
- Today (2025)
- 1,025,227 people
- By 2030
- 1,028,023 · +0.3%
- By 2040
- 1,020,940 · -0.4%
- By 2050
- 1,007,280 · -1.8%
- By 2075
- 987,277 · -3.7%
- By 2100
- 921,984 · -10.1%
Race, ethnicity, and origin ACS 2023
- Neighborhood character
- Predominantly Black (66%)
- Race & ethnicity
- Black 66% White 28% Two or more races 3% Hispanic / Latino 2%
- Common ancestry
- Lithuanian 1% Iranian 1% Romanian 1%
- Foreign-born
- 1% · Canada
- Languages at home
- 95% English-only · Spanish 4%
Political lean MEDSL · St. Louis
- 2024 margin
- Strong D (+23.4) · D 60.8% · R 37.4% · Other 1.7%
- 2008→2024 swing
- +3.5pp toward D · 2008: 19.9pp · 2024: 23.4pp
- All cycles
- 2024: D+23.4 2020: D+24.0 2016: D+16.2 2012: D+13.7 2008: D+19.9
Not yet ingested
- Civics
- —
Market trends
- HPI YoY
- ▼ -152.56%
- Current HPI
- 138.6781
- Rent YoY
- ▲ 9.03%
- Metro
- St. Louis, MO-IL
- State GDP YoY
- ▲ 1.84%
- F500 in state
- 20
Industry mix (Fortune 500 HQ in MO)
| Industry | F500 HQs | Revenue |
|---|---|---|
| Healthcare | 1 | $163B |
|
||
| Insurance | 1 | $21B |
|
||
| Industrial Technology | 1 | $17B |
|
||
| Retail | 1 | $16B |
|
||
| Industrial Distribution | 1 | $10B |
|
||
| Utilities | 1 | $9B |
|
||
Price history
+192.0% since first listed19 events — show timeline
- 2026-04-14 Relisted — MARIS as Distributed by MLS Grid
- 2026-03-27 Pending — MARIS as Distributed by MLS Grid
- 2026-03-13 Listed $94,900 MARIS as Distributed by MLS Grid
- 2018-01-05 Sold (Public Records) $1,067,500 Public Records
- 2016-09-30 Price Changed $39,400 MARIS as Distributed by MLS Grid
- 2016-07-27 Price Changed $39,900 MARIS as Distributed by MLS Grid
- 2014-05-21 Sold (Public Records) $28,000 Public Records
- 2014-05-16 Sold (MLS) — MARIS as Distributed by MLS Grid
- 2014-02-06 Listed $29,900 MARIS as Distributed by MLS Grid
- 2013-12-23 Sold (Public Records) $13,000 Public Records
- 2013-12-20 Sold (MLS) — MARIS as Distributed by MLS Grid
- 2013-01-07 Listed $18,900 MARIS as Distributed by MLS Grid
- 2009-11-10 Sold (Public Records) $32,000 Public Records
- 2005-07-08 Sold (Public Records) $42,500 Public Records
- 2005-06-29 Sold (Public Records) $37,000 Public Records
- 2005-03-01 Sold (Public Records) — Public Records
- 1995-06-12 Sold (Public Records) $32,500 Public Records
- 1995-02-02 Sold (Public Records) — Public Records
- 1995-02-01 Sold (Public Records) — Public Records
Property tax history
+3.9%/yrLatest (2022): $673 · +0.5% YoY. Source: county tax records.
Cash-flow waterfall
monthlySold comps — $/sqft
last 12 mo · ≤1 miLoading sold comps…