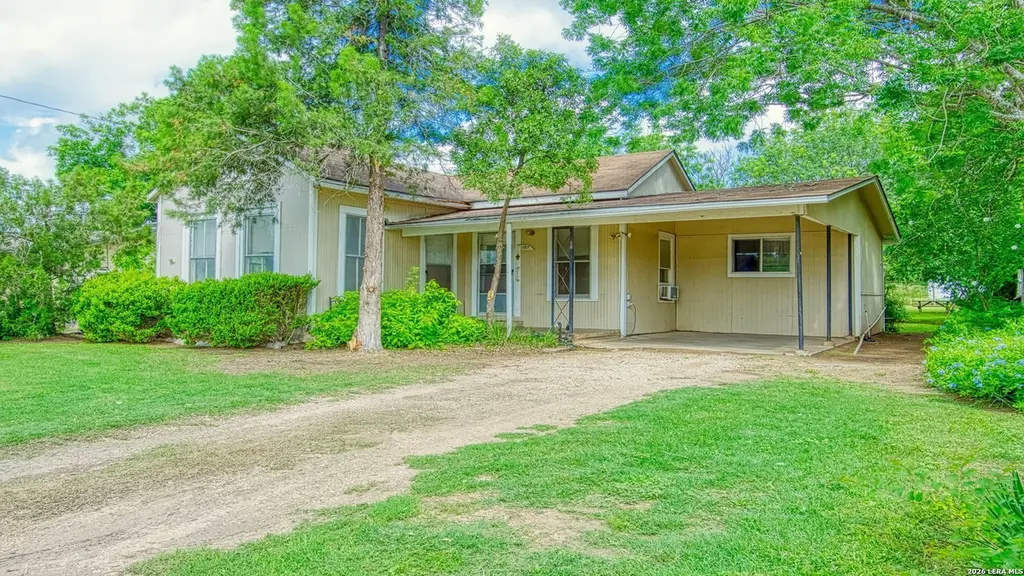
1107 Trail St · Floresville, TX
Flood risk 1/10 · Minimal
- FEMA flood zone
- X (unshaded)
- Chance of flooding over 30 yrs
- 0.0%
- Est. flood insurance / yr
- $507 – $1,088
Fire risk 4/10 · Minor
- Est. fire insurance / yr
- $1,222 – $2,270
Heat risk 8/10 · Major
- Hot days now (above 110°F)
- 7 days/yr
- Hot days in 30 yrs
- 21 days/yr
Wind risk 8/10 · Major
- Chance of severe wind over 30 yrs
- 80.0%
Air-quality risk 1/10 · Minimal
- Unhealthy air days now
- 0 days/yr
- Unhealthy air days in 30 yrs
- 0 days/yr
Risk factors via First Street. Map © Google.
Why this score? — see what drove the B grade
The composite is a weighted blend of 9 inputs, each scored 0–100. Each bar is that input's sub-score; the figure is the points it added to the 100-point composite (weight × sub-score).
- Cash flow +28.5/30.0
- ARV discount +15.0/15.0
- DSCR +10.0/10.0
- 1% rule +7.9/10.0
- Livability +3.2/5.0
- Schools +3.0/10.0
- Rent growth +2.5/5.0
- Condition / age +2.5/5.0
- Appreciation +0.0/10.0
$89,000
🖨 Deal sheet 📄 Offer letter ✓ Due diligence
Listing remarks
Charming small town living in the heart of Floresville, Texas! This cozy 2 bedroom, 1 bath home sits on a . 21 acre lot (that feels so much bigger!) and offers 742 square feet of comfortable living space with plenty of outdoor charm. Enjoy relaxing evenings on the back deck overlooking a large backyard filled with established landscaping, including fig and peach trees. The rich soil is perfect for a bountiful vegetable garden, and the property also includes a convenient storage shed and covered carport. Ideally located within walking distance to the highly active county library and just around the corner from downtown, restaurants, and stores. Enjoy an easy commute to San Antonio or the Eag
Key facts
- Large backyard
- Fig and peach trees
- Storage shed
Tags
Property features AI
Finance
- Other:
- Financial info:
- HOA & community: Located in FLORESVILLE SECTIONS
Exterior
- Parking:
- Security:
- Utilities: City water; City sewer; City garbage service; Natural gas supplied by Centerpoint; Electricity supplied by FELPS
- Home design: Pre-owned wood exterior home; Composition roof; Approximately 91 years old
- Construction: Wood exterior construction; Composition roof
- Exterior features: Covered patio; Storage building / shed; Workshop; Level lot; Paved street with curbs on a city street
Interior
- Kitchen: Gas cooking; Stove/Range; Refrigerator
- Bedrooms: Master bedroom with ceiling fan and full bath; Second bedroom (14 x 13)
- Flooring: Carpeting; Ceramic tile; Linoleum
- Bathrooms: 1 full bathroom
- Heating & cooling: Central heating (natural gas); Window air conditioning unit
- Interior features: Ceiling fans; Some window coverings remain; Eat-in kitchen; Utility room inside; 1 living area
- Laundry & utility: Washer and dryer included; Utility room (8 x 7)
Neighborhood map
What this means for you Summary
Snapshot
- This is a 2-bed/1.0-bath single-family listed at $89k.
Deal economics
- At list price, monthly cash flow is $291 ($3k/yr) — positive.
- The deal already cash-flows at list — no discount required.
- Meets the 1% rule at list price ($1k rent vs $89k).
- Recommended offer: $88k (1.5% below list) — sets the bar for market timing.
- Cap rate 10.2% vs local median 2.0% in Floresville — top-decile yield for the area; either an underpriced asset or a hidden risk that comps aren't pricing in. Stress-test before assuming the spread holds.
Location & tenants
- Location reads 65/100 on livability (#681 in TX) — a middle-class / working-renter tenant base. Strengths: cost of living A+, housing A+, crime A-; Watch: employment D+, health & safety D+, amenities F.
- Floresville ISD (town): math 32% / reading 36% proficiency, ranked #504 of 826 in TX (top 61%) — families likely to look elsewhere, expect single-tenant / working-renter base with shorter leases.
- Zoned schools: Floresville South El (math 35% / reading 33%, grade F, #2,149 of 4,322 statewide, top 50%, 1,025 students, 68% FRL); Floresville H S (math 36% / reading 45%, grade F, #798 of 1,632 statewide, top 49%, 1,246 students, 52% FRL).
- Market conditions: 302 active listings in the ZIP; 1 comparable units currently listed for rent nearby; solid renter incomes; 135 units permitted in Wilson County in 2024 (0 in 5+ unit buildings).
- This rent is only 16% of the median local income ($88k/yr) — well below the 30% rent-burden line; pricing power to push rent on renewal without tenant pushback.
Forward outlook
- Local home prices are declining (-3.0%/yr); year-one equity from $615 of loan paydown is wiped out by about $3k of value loss. Plan a longer hold.
- Wilson County population projected at +46% by 2050 — long-run rental-demand tailwind backs the buy-and-hold thesis.
- At projected returns (-3.0% appreciation + 3.0% rent growth), your $25k cash investment doubles in ~9 years — after that, you're playing with house money.
Negotiation context
- It's been on market 22 days — a 2% lower offer ($88k) is reasonable based on typical stale-listing flexibility.
Risks & watch-outs
- Watch-outs: built in 1935 — expect roof / HVAC / electrical / plumbing capex.
- Climate carrying-cost: severe wind risk, 80% chance of damaging wind over 30y; extreme-heat days projected 7→21/yr by 2055 (HVAC capex compounding) — expect insurance premiums to compound above CPI over the hold.
Questions for the listing agent
- Built in 1935 — when were the roof, HVAC, electrical panel, plumbing, and water heater last replaced?
- Is there a deadline driving the sale (1031 exchange, divorce, estate, relocation)? That informs how much negotiation room exists.
- What's the average days-on-market for RENTAL listings here right now (not sales)? A rising rental-DOM trend means longer vacancies and softer asking-rent achievability than the comps imply.
- What's the recent tenant-quality profile in this submarket — average credit score on applications, eviction rate, late-payment / NSF rate, and stable-employment percentage? A property-management company in the area should have these aggregated.
- How much new for-sale + rental construction is in the pipeline within 1–3 miles? Heavy new supply typically softens prices + rents 12–24 months out; constrained supply supports both.
Investment metrics
- 1% rule
- 1.29% ✓
- Cap rate
- 10.22%
- Cash-on-cash
- 14.03%
- DSCR
- 1.62
- GRM
- 6.5
CMA / ARV
- ARV (on-the-fly)
- $106,848
- Comps found
- 1
Show comp detail 1 sale within ~0.75 mi
| Address | Dist | Beds/Ba | Sqft | Sold | Price | $/sf | Match |
|---|---|---|---|---|---|---|---|
| 1206 7th St | 0.41mi | 2/1.0 | 696 (-6%) | 18mo | $100,000 | $144 | 55 |
Match score weights: distance 35% · size 25% · config 20% · recency 20%. Top-matched comps best support the ARV.
Projected returns pro-forma
-3.0% appreciation · 3.0% rent growth · sell at horizon
- IRR
- 4.3%
- Equity multiple
- 1.17×
- Total profit
- $4,157
- Equity at exit
- $13,270
- IRR
- 13.8%
- Equity multiple
- 2.11×
- Total profit
- $27,588
- Equity at exit
- $7,695
Cash invested: $24,920 (down + closing). Projections, not guarantees.
Landlord ↔ Tenant lean methodology
- Overall (STATE)
- 87 Strongly Landlord-Friendly
- State Texas
- 87 Strongly Landlord-Friendly · R+5
- County
- — inherits STATE
- City
- — inherits STATE
ZIP-level market 78114
- Home prices YoY
- -27.3%
- Active inventory
- 302
- Price-to-rent
- 6.5×
Monthly cashflow live
- Estimated rent
- $1,146 medium interval (Pro) →
- Mortgage (P&I)
- −$467
- Tax from tax record
- −$110 /mo · $1,321/yr
- Insurance
- −$37
- HOA
- −$0
- Vacancy / Maint / Mgmt
- −$241
- Net cashflow
- $291
Break-even live
UW: 25.0% down · 7.5% · 30yr · 1.5% tax · 5.0% vac · 8.0% maint · 8.0% mgmt
Financing live
Cash to close
- Down payment
- $22,250
- Closing costs
- $2,670
- Reserves months
- —
- Total cash needed
- —
Loan-product check · same deal, 3 products live
Conventional
25% down · 7.5% · 30yr
- Down + closing
- —
- Monthly P&I
- —
- Monthly cashflow
- —
- DSCR
- —
- Eligible?
- —
Personal DTI + credit; lowest rate.
DSCR
20% down · 8.5% · 30yr
- Down + closing
- —
- Monthly P&I
- —
- Monthly cashflow
- —
- DSCR
- —
- Eligible?
- —
No personal income docs; deal must DSCR.
Hard money
10% down · 12.0% · 12mo
- Down + closing
- —
- Monthly P&I
- —
- Monthly cashflow
- —
- DSCR
- —
- Eligible?
- —
Short-term bridge; refi at stabilization.
Rent comps 1 comps
| Address | Beds | Baths | Sqft | Rent | $/sqft | DOM | Units | Dist |
|---|---|---|---|---|---|---|---|---|
| 904 C St Unit 2 Floresville, TX | 1.0 | 1.0 | 640 | $900 | $1.41 | 1d | 1 | 0.46mi |
Listing history 14 events
-
2026-06-18days on market $89,000 Active 22 DOM
-
2026-06-17days on market $89,000 Active 21 DOM
-
2026-06-16days on market $89,000 Active 20 DOM
-
2026-06-15days on market $89,000 Active 19 DOM
-
2026-06-13days on market $89,000 Active 17 DOM
-
2026-06-09days on market $89,000 Active 13 DOM
-
2026-06-08days on market $89,000 Active 12 DOM
-
2026-06-07statusdays on market $89,000 Active 11 DOM
-
2026-06-04days on market $89,000 New 8 DOM
-
2026-06-03days on market $89,000 New 7 DOM
-
2026-06-02days on market $89,000 New 6 DOM
-
2026-06-01days on market $89,000 New 5 DOM
-
2026-05-31days on market $89,000 New 4 DOM
-
2026-05-27$89,000 New
ⓘ Source: listings_history table (triggers on properties + properties_extension) + one-shot
backfill from property_details.listing_events for pre-trigger history.
Tax reassessment forecast TX · Resets to sale price
- Current annual tax
- $1,321 · $110/mo
- Projected year-2 tax
- $1,629 · $136/mo
- Expected delta
- +$308/yr (+$26/mo · 23.3%)
ⓘ Screening estimate from a state-policy table — verify with the county assessor before closing.
Climate risk First Street
- Flood 1/10 Low FEMA zone X (unshaded) · 0% chance over 30 yrs
- Wildfire 4/10 Moderate
- Heat 8/10 Severe 7 d/yr ≥110°F today · 21 d/yr by 30 yrs out
- Wind 8/10 Severe 80% chance of damaging wind over 30 yrs
- Air quality 1/10 Low 0 unhealthy d/yr today · 0 by 30 yrs out
Nearby sold comps map
Loading sold comps map…
Walkable amenities ~0.75 mi
Loading nearby amenities…
Taxation est. · year 1
- Rental income
- $13,751
- − Mortgage interest
- −$4,985
- − Property taxes
- −$1,321
- − Insurance
- −$445
- − Repairs & maintenance
- −$1,100
- − Management
- −$1,100
- − Depreciation
- −$2,589
- Taxable income
- $2,211
- Est. tax owed @ 24.0%
- −$531
- After-tax cash flow
- $2,967/yr
For passive investors: Depreciation is non-cash, so a rental often shows a tax loss while cash-flowing — sheltering income. Rental losses are passive: they offset passive income freely, and up to $25,000/yr can offset ordinary (W-2) income if you actively participate and your MAGI is under $100k (phasing out to $0 by $150k); unused losses carry forward. On sale, claimed depreciation is recaptured at up to 25%, and gains may owe capital-gains tax (a 1031 exchange can defer both). Figures are a year-1 estimate at your 24.0% rate — not tax advice; consult a CPA.
Schools (NCES district)
- District
- Floresville ISD
- NCES district ID
- 4819350
- Math proficiency
- 32% ▼ -14.00%
- Reading proficiency
- 36% ▼ -5.00%
- Median HH income
- $59,736
- Composite
- 30.44/100
- National rank
- #6234
- State rank
- #504 of 826 in TX
Livability — Floresville
- Score
- 65/100
- State rank
- #681
- US rank
- #12747
Category grades
Schools grade is shown separately in the Schools card above.
Census & demographics
- Census place
- Floresville, TX
- County
- Wilson County · 24,283 people
- City population
- 24,283
- Metro
- San Antonio-New Braunfels, TX
- Population (ZIP)
- 24,283
- Household income
- $88,087
- Rent vs Own
- Severe rent burden
- 400.0
Population outlook (Wilson County) Hauer SSP2
- Today (2025)
- 58,434 people
- By 2030
- 63,912 · +9.4%
- By 2040
- 74,704 · +27.8%
- By 2050
- 85,024 · +45.5%
- By 2075
- 111,025 · +90.0%
- By 2100
- 126,692 · +116.8%
Race, ethnicity, and origin ACS 2023
- Neighborhood character
- Majority Hispanic (51%)
- Race & ethnicity
- Hispanic / Latino 51% White 44% Two or more races 23% Black 2%
- Hispanic origin (detail)
- Mexican 46%
- Common ancestry
- Romanian 6% Italian 1% Lithuanian 1%
- Foreign-born
- 4% · Canada, Vietnam
- Languages at home
- 71% English-only · Spanish 27% Russian/Polish/Slavic 1%
Political lean MEDSL · Wilson
- 2024 margin
- Solid R (+53.7) · D 22.9% · R 76.6%
- 2008→2024 swing
- -19.8pp toward R · 2008: -33.9pp · 2024: -53.7pp
- All cycles
- 2024: R+53.7 2020: R+48.4 2016: R+47.8 2012: R+43.0 2008: R+33.9
Not yet ingested
- Civics
- —
Market trends
- HPI YoY
- ▼ -79.16%
- Current HPI
- 210.9474
- Rent YoY
- —
- Metro
- San Antonio-New Braunfels, TX
- State GDP YoY
- ▲ 3.95%
- F500 in state
- 110
Industry mix (Fortune 500 HQ in TX)
| Industry | F500 HQs | Revenue |
|---|---|---|
| Energy | 16 | $1,198B |
|
||
| Technology | 5 | $198B |
|
||
| Engineering / Construction | 4 | $72B |
|
||
| Energy Services | 3 | $60B |
|
||
| Utilities | 3 | $41B |
|
||
| Healthcare | 2 | $330B |
|
||
Price history
1 event — show timeline
- 2026-05-27 Listed $89,000 LERA
Property tax history
+0.2%/yrLatest (2025): $1,321 · +1.1% YoY. Source: county tax records.
Cash-flow waterfall
monthlySold comps — $/sqft
last 12 mo · ≤1 miLoading sold comps…