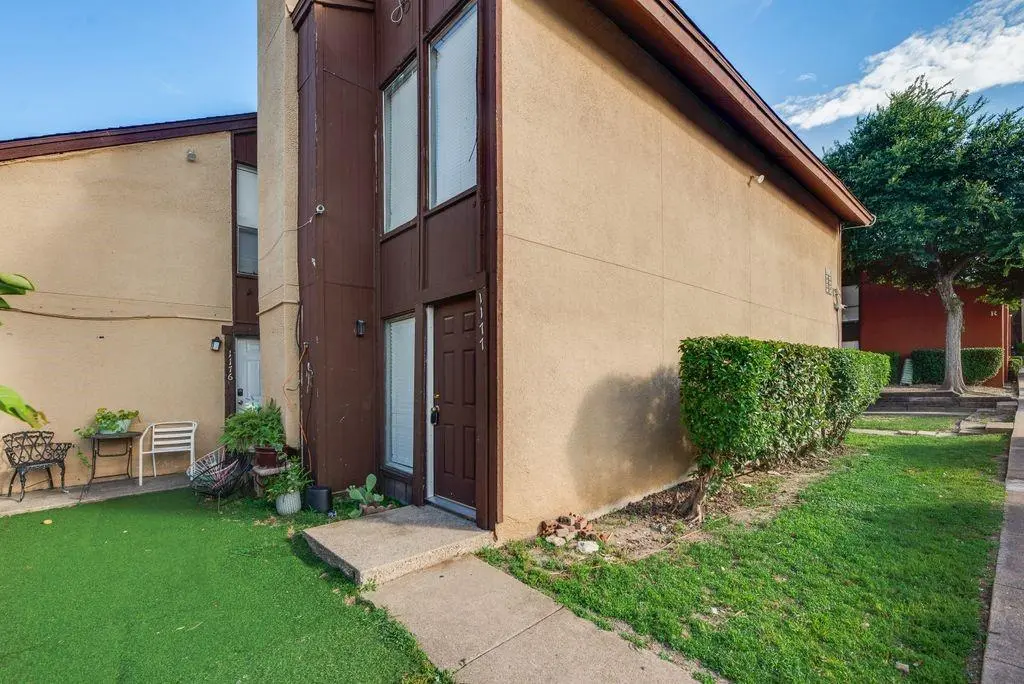
7152 Fair Oaks Ave #1177 · Dallas, TX
Flood risk No data
- FEMA flood zone
- —
- Chance of flooding over 30 yrs
- —
- Est. flood insurance / yr
- —
Fire risk No data
- Est. fire insurance / yr
- —
Heat risk No data
- Hot days now (above threshold)
- —
- Hot days in 30 yrs
- —
Wind risk No data
- Chance of severe wind over 30 yrs
- —
Air-quality risk No data
- Unhealthy air days now
- —
- Unhealthy air days in 30 yrs
- —
Risk factors via First Street. Map © Google.
Why this score? — see what drove the C+ grade
The composite is a weighted blend of 9 inputs, each scored 0–100. Each bar is that input's sub-score; the figure is the points it added to the 100-point composite (weight × sub-score).
- Cash flow +24.6/30.0
- 1% rule +8.4/10.0
- DSCR +8.0/10.0
- ARV discount +7.5/15.0
- Livability +4.0/5.0
- Rent growth +3.0/5.0
- Schools +2.8/10.0
- Condition / age +2.5/5.0
- Appreciation +0.0/10.0
$85,000
🖨 Deal sheet (PDF) 📄 Offer letter ✓ Due diligence
Listing remarks MLS
Multiple offers received deadline is Monday April 17 5pm. One bedroom and bath condo close to shopping and highways.
Key facts
- Unbeatable location
- $125 HOA
- Built 1975
Tags
Property features AI
Finance
- Other: Directions: From 75 Central Expressway, exit Park Lane East, turn left on Fair Oaks
- Financial info: Listing terms include cash and conventional financing
- HOA & community: Mandatory association (Lofts Owners Association); Association fee $125 monthly; Association fee includes management fees, sewer and water
Exterior
- Parking: On-site parking lot (no covered, carport, or garage spaces listed)
- Security: No specific security features provided
- Utilities: City water; City sewer; Municipal utility district not applicable
- Home design: Condominium; Attached property; One level; Built in 1975
- Construction: Brick and siding construction; Composition roof; Slab foundation
- Exterior features: Balcony
Interior
- Kitchen: Disposal; Electric range
- Bedrooms: One bedroom (10 x 10)
- Flooring: No flooring details provided
- Bathrooms: One full bathroom
- Heating & cooling: Central heating (electric); Central air conditioning (electric)
- Interior features: Cable TV available; High speed internet available; Window coverings; One living area; One dining area; Two total rooms
- Laundry & utility: No specific laundry details provided
Neighborhood map
What this means for you Summary
Snapshot
- This is a 1-bed/1.0-bath condo listed at $85k.
Deal economics
- At list price, monthly cash flow is $176 ($2k/yr) — positive.
- The deal already cash-flows at list — no discount required.
- Meets the 1% rule at list price ($1k rent vs $85k).
- Cap rate 8.8% vs local median 2.3% in Dallas — top-decile yield for the area; either an underpriced asset or a hidden risk that comps aren't pricing in. Stress-test before assuming the spread holds.
Location & tenants
- Location reads 81/100 on livability (#24 in TX, #1,380 nationally) — a professional / high-income tenant draw. Strengths: amenities A+, commute A+, housing A+; Watch: crime F.
- Dallas ISD (urban): math 31% / reading 36% proficiency, ranked #559 of 826 in TX (top 68%) — families likely to look elsewhere, expect single-tenant / working-renter base with shorter leases; 83% free/reduced lunch — lower-income household profile, screen leases tightly.
- Zoned schools: Jack Lowe Sr El (math 67% / reading 72%, grade A-, #146 of 4,322 statewide, top 4%, 526 students, 98% FRL).
- Zoned-school proficiency averages 70% at this address vs 34% district-wide (+36 pts) — the actual schools serving this property are materially stronger than the Dallas ISD average implies; a family-tenant draw the district grade alone would hide.
- Market conditions: Rents rising (+2.0%/yr); 214 active listings in the ZIP; 40 comparable units currently listed for rent nearby; rentals at typical pace (median 19d on market — plan ~3-4 weeks tenant-placement turnaround); 12,577 units permitted in Dallas County in 2024 (6,829 in 5+ unit buildings).
Forward outlook
- Local home prices are declining (-3.0%/yr); year-one equity from $588 of loan paydown is wiped out by about $3k of value loss. Plan a longer hold.
- Dallas County population projected at +35% by 2050 — long-run rental-demand tailwind backs the buy-and-hold thesis.
Negotiation context
- Only 3 days on market — expect competitive offers; lowballing is unlikely to land.
- 6 sale attempts since 3y ago with the ask held roughly flat each time — persistent listings suggest the price (not the market) is what's stuck; bring a comps-based counter.
Questions for the listing agent
- Built in 1975 — when were the roof, HVAC, electrical panel, plumbing, and water heater last replaced?
- What does the HOA fee cover, when was the last increase, and are there any pending special assessments or reserve-fund shortfalls?
- Any open or pending special assessments — roof, HVAC, plumbing, elevator, façade? What's the per-unit balance and payoff schedule, and is the seller paying it off at close or rolling it to the buyer?
- Is there a deadline driving the sale (1031 exchange, divorce, estate, relocation)? That informs how much negotiation room exists.
- Crime grade is F in this area — have there been break-ins, vandalism, or insurance claims at this property in the last 3 years? What carrier currently insures it and at what premium?
- What's the average days-on-market for RENTAL listings here right now (not sales)? A rising rental-DOM trend means longer vacancies and softer asking-rent achievability than the comps imply.
- What's the recent tenant-quality profile in this submarket — average credit score on applications, eviction rate, late-payment / NSF rate, and stable-employment percentage? A property-management company in the area should have these aggregated.
- How much new apartment / multifamily construction is in the pipeline within 1–3 miles? Heavy new supply (>2% of stock underway) typically softens rents 12–24 months out; light construction supports rent growth.
Investment metrics
- 1% rule
- 1.34% ✓
- Cap rate
- 8.78%
- Cash-on-cash
- 8.89%
- DSCR
- 1.40
- GRM
- 6.2
CMA / ARV
No comps found within radius.
Projected returns pro-forma
-3.0% appreciation · 1.96% rent growth · sell at horizon
- IRR
- -4.1%
- Equity multiple
- 0.85×
- Total profit
- $-3,618
- Equity at exit
- $12,674
- IRR
- 4.2%
- Equity multiple
- 1.29×
- Total profit
- $6,985
- Equity at exit
- $7,349
Cash invested: $23,800 (down + closing). Projections, not guarantees.
Landlord ↔ Tenant lean methodology
- Overall (STATE)
- 87 Strongly Landlord-Friendly
- State Texas
- 87 Strongly Landlord-Friendly · R+5
- County
- — inherits STATE
- City
- — inherits STATE
ZIP-level market 75231
- Rents YoY
- 2.0%
- Active inventory
- 214
- Price-to-rent
- 6.2×
Monthly cashflow live
- Estimated rent
- $1,139 high interval (Pro) →
- Mortgage (P&I)
- −$446
- Tax from tax record
- −$117 /mo · $1,403/yr
- Insurance
- −$35
- HOA
- −$125
- Vacancy / Maint / Mgmt
- −$239
- Net cashflow
- $176
Break-even live
Sensitivity live
| Price | -10% $225 | -5% $200 | +0% $176 | +5% $152 | +10% $128 |
|---|---|---|---|---|---|
| Rent | -10% $86 | -5% $131 | +0% $176 | +5% $221 | +10% $266 |
| Rate | -1.0pp $219 | -0.5pp $198 | base $176 | +0.5pp $154 | +1.0pp $132 |
UW: 25.0% down · 7.5% · 30yr · 1.5% tax · 5.0% vac · 8.0% maint · 8.0% mgmt
Financing live
Cash to close
- Down payment
- $21,250
- Closing costs
- $2,550
- Reserves months
- —
- Total cash needed
- —
Loan-product check · same deal, 3 products live
Conventional
25% down · 7.5% · 30yr
- Down + closing
- —
- Monthly P&I
- —
- Monthly cashflow
- —
- DSCR
- —
- Eligible?
- —
Personal DTI + credit; lowest rate.
DSCR
20% down · 8.5% · 30yr
- Down + closing
- —
- Monthly P&I
- —
- Monthly cashflow
- —
- DSCR
- —
- Eligible?
- —
No personal income docs; deal must DSCR.
Hard money
10% down · 12.0% · 12mo
- Down + closing
- —
- Monthly P&I
- —
- Monthly cashflow
- —
- DSCR
- —
- Eligible?
- —
Short-term bridge; refi at stabilization.
Rent comps 40 comps
| Address | Beds | Baths | Sqft | Rent | $/sqft | DOM | Units | Dist |
|---|---|---|---|---|---|---|---|---|
| 7025 Hemlock Ave #305 Dallas, TX | 1.0 | 1.0 | 720 | $1,100 | $1.53 | 44d | 1 | 0.13mi |
| 8510 Park Ln #102 Dallas, TX | 1.0 | 1.0 | 700 | $1,195 | $1.71 | 11d | 1 | 0.18mi |
| 8510 Park Ln #203 Dallas, TX | 1.0 | 1.0 | 700 | $1,275 | $1.82 | 12d | 1 | 0.18mi |
| 8510 Park Ln #201 Dallas, TX | 1.0 | 1.0 | 625 | $1,055 | $1.69 | 8d | 1 | 0.18mi |
| 6003 Ridgecrest Rd Dallas, TX | 1.0 | 1.0 | 634 | $1,200 | $1.89 | 8d | 1 | 0.21mi |
| 6014 Ridgecrest Rd Dallas, TX | 1.0 | 1.0 | 734 | $975 | $1.33 | 44d | 1 | 0.24mi |
| 6041 Ridgecrest Rd Dallas, TX | 1.0 | 1.0 | 587 | $1,165 | $1.98 | 18d | 4 | 0.24mi |
| 7418 Fair Oaks Ave Dallas, TX | — | 1.0 | 715 | $1,104 | $1.54 | 44d | 1 | 0.26mi |
| 8601 Park Ln Dallas, TX | 1.0 | 1.0 | 618 | $1,350 | $2.18 | 44d | 2 | 0.26mi |
| 5750 Phoenix Dr #19 Dallas, TX | 1.0 | 1.0 | 605 | $795 | $1.31 | 44d | 1 | 0.27mi |
| 8601 Park Ln #416 Dallas, TX | 1.0 | 1.0 | 618 | $1,400 | $2.27 | 25d | 1 | 0.30mi |
| 6050 Ridgecrest Rd Dallas, TX | 2.0 | 1.0–2.0 | 732 | $1,045 | $1.43 | 3d | 14 | 0.33mi |
| 5951 Melody Ln Dallas, TX | 1.0 | 1.0 | 588 | $1,075 | $1.83 | 8d | 5 | 0.34mi |
| 7431 Holly Hill Dr #201 Dallas, TX | 1.0 | 1.0 | 617 | $850 | $1.38 | 7d | 1 | 0.39mi |
| 6121 Melody Ln Dallas, TX | 1.0 | 1.0 | 653 | $960 | $1.47 | 25d | 1 | 0.40mi |
| 5759 Pineland Dr Dallas, TX | 1.0–2.0 | 1.0–2.0 | 747 | $911 | $1.22 | 0d | 28 | 0.44mi |
| 6251 Melody Ln Dallas, TX | 1.0–2.0 | 1.0–2.0 | 819 | $770 | $0.94 | 0d | 39 | 0.45mi |
| 6760 Eastridge Dr Unit 102 Dallas, TX | 1.0 | 1.0 | 725 | $1,350 | $1.86 | 19d | 1 | 0.50mi |
| 6311 Melody Ln Dallas, TX | 1.0 | 1.0 | 653 | $915 | $1.40 | 44d | 1 | 0.51mi |
| 6262 Melody Ln Dallas, TX | 1.0–2.0 | 1.0–2.0 | 820 | $830 | $1.01 | 25d | 2 | 0.56mi |
| 6262 Melody Ln Dallas, TX | 2.0 | 1.0–2.0 | 750 | $1,075 | $1.43 | 0d | 4 | 0.56mi |
| 6262 Melody Ln Dallas, TX | 2.0 | 1.0–2.0 | 750 | $1,054 | $1.41 | 0d | 6 | 0.56mi |
| 6262 Melody Ln Dallas, TX | 1.0–2.0 | 1.0–2.0 | 865 | $850 | $0.98 | 12d | 3 | 0.56mi |
| 5827 Blackwell St Dallas, TX | 2.0 | 1.0 | 669 | $820 | $1.23 | 3d | 4 | 0.59mi |
| 6466 Ridgecrest Rd Dallas, TX | 1.0 | 1.0 | 535 | $899 | $1.68 | 3d | 8 | 0.60mi |
| 8780 Park Ln Dallas, TX | 2.0 | 1.0–2.0 | 642 | $1,277 | $1.99 | 4d | 56 | 0.60mi |
| 9600 Golf Lakes Trl Dallas, TX | 1.0–2.0 | 1.0–2.0 | 865 | $1,049 | $1.21 | 2d | 12 | 0.64mi |
| 8110 Park Ln Dallas, TX | 2.0 | 1.0–2.0 | 1064 | $2,410 | $2.26 | 0d | 20 | 0.69mi |
| 9606 Golf Lakes Trl Dallas, TX | 1.0 | 1.0 | 712 | $1,330 | $1.87 | 23d | 1 | 0.77mi |
| 9606 Golf Lakes Trl Dallas, TX | 1.0 | 1.0 | 712 | $1,330 | $1.87 | 44d | 1 | 0.77mi |
| 8281 Walnut Hill Ln Dallas, TX | 1.0 | 1.0 | 662 | $1,561 | $2.36 | 44d | 1 | 0.80mi |
| 8281 Walnut Hill Ln Dallas, TX | 1.0 | 1.0 | 662 | $1,561 | $2.36 | 23d | 1 | 0.80mi |
| 6211 Northwest Hwy Unit G124 Dallas, TX | — | 1.0 | 390 | $1,400 | $3.59 | 44d | 1 | 0.82mi |
| 6211 E Northwest Hwy Unit G417 Dallas, TX | 1.0 | 1.0 | 397 | $2,000 | $5.04 | 19d | 1 | 0.82mi |
| 6211 E Northwest Hwy Unit G224 Dallas, TX | 1.0 | 1.0 | 721 | $1,950 | $2.70 | 25d | 1 | 0.82mi |
| 8611 Southwestern Blvd Unit 412 Dallas, TX | 1.0 | 1.0 | 561 | $1,425 | $2.54 | 13d | 1 | 0.88mi |
| 8611 Southwestern Blvd Unit 8626 Dallas, TX | 1.0 | 1.0 | 636 | $1,595 | $2.51 | 15d | 1 | 0.88mi |
| 8611 Southwestern Blvd Unit 8626 Dallas, TX | 1.0 | 1.0 | 561 | $1,425 | $2.54 | 0d | 1 | 0.88mi |
| 7557 Rambler Rd Ste 111 Dallas, TX | 1.0 | 1.0 | 610 | $1,182 | $1.94 | 44d | 1 | 0.91mi |
| 7783 Glen America Dr Dallas, TX | 1.0 | 1.0 | 700 | $1,302 | $1.86 | 44d | 1 | 0.92mi |
HOA detail condo
- Monthly dues
- $125 · $1,500/yr
- Assessments
- None detected in remarks — confirm with the listing agent.
Listing history 3 events
-
2026-06-21days on market $85,000 Active 3 DOM
-
2026-06-18remarks 545-char remark
-
2026-06-18$85,000 Active 1 DOM
ⓘ Source: listings_history table (triggers on properties + properties_extension) + one-shot
backfill from property_details.listing_events for pre-trigger history.
Tax reassessment forecast TX · Resets to sale price
- Current annual tax
- $1,403 · $117/mo
- Projected year-2 tax
- $1,556 · $130/mo
- Expected delta
- +$153/yr (+$13/mo · 10.9%)
ⓘ Screening estimate from a state-policy table — verify with the county assessor before closing.
Nearby sold comps map
Loading sold comps map…
Walkable amenities ~0.75 mi
Loading nearby amenities…
Taxation est. · year 1
- Rental income
- $13,663
- − Mortgage interest
- −$4,761
- − Property taxes
- −$1,403
- − Insurance
- −$425
- − Repairs & maintenance
- −$1,093
- − Management
- −$1,093
- − HOA
- −$1,500
- − Depreciation
- −$2,473
- Taxable income
- $915
- Est. tax owed @ 24.0%
- −$220
- After-tax cash flow
- $1,897/yr
For passive investors: Depreciation is non-cash, so a rental often shows a tax loss while cash-flowing — sheltering income. Rental losses are passive: they offset passive income freely, and up to $25,000/yr can offset ordinary (W-2) income if you actively participate and your MAGI is under $100k (phasing out to $0 by $150k); unused losses carry forward. On sale, claimed depreciation is recaptured at up to 25%, and gains may owe capital-gains tax (a 1031 exchange can defer both). Figures are a year-1 estimate at your 24.0% rate — not tax advice; consult a CPA.
Schools (NCES district)
- District
- Dallas ISD
- NCES district ID
- 4816230
- Math proficiency
- 31% ▼ -16.00%
- Reading proficiency
- 36% ▼ -4.00%
- Median HH income
- $42,881
- Composite
- 28.41/100
- National rank
- #6763
- State rank
- #559 of 826 in TX
Livability — Dallas
- Score
- 81/100
- State rank
- #24
- US rank
- #1380
Category grades
Schools grade is shown separately in the Schools card above.
Census & demographics
- Census place
- Dallas, TX
- County
- Dallas County · 2,612,404 people
- City population
- 1,168,437
- Metro
- Dallas-Fort Worth-Arlington, TX
- Population (ZIP)
- 38,370
- Household income
- $58,540
- Rent vs Own
- Severe rent burden
- 3482.0
Population outlook (Dallas County) Hauer SSP2
- Today (2025)
- 2,979,839 people
- By 2030
- 3,191,823 · +7.1%
- By 2040
- 3,619,611 · +21.5%
- By 2050
- 4,026,915 · +35.1%
- By 2075
- 4,957,073 · +66.4%
- By 2100
- 5,508,725 · +84.9%
Race, ethnicity, and origin ACS 2023
- Neighborhood character
- Highly diverse neighborhood (Simpson 0.74)
- Race & ethnicity
- Hispanic / Latino 33% White 29% Black 24% Two or more races 13% Asian 9%
- Hispanic origin (detail)
- Mexican 26%
- Common ancestry
- Slovak 1% Lithuanian 1% Romanian 1%
- Foreign-born
- 29% · Canada, Philippines, India
- Languages at home
- 57% English-only · Spanish 27% Other Asian/Pacific 4% Other Indo-European 3%
Political lean MEDSL · Dallas
- 2024 margin
- Strong D (+22.2) · D 60.2% · R 38.0% · Other 1.8%
- 2008→2024 swing
- +6.9pp toward D · 2008: 15.3pp · 2024: 22.2pp
- All cycles
- 2024: D+22.2 2020: D+31.6 2016: D+26.2 2012: D+15.4 2008: D+15.3
Not yet ingested
- Civics
- —
Market trends
- HPI YoY
- ▼ -359.41%
- Current HPI
- 249.5841
- Rent YoY
- ▲ 1.96%
- Metro
- Dallas-Fort Worth-Arlington, TX
- State GDP YoY
- ▲ 3.95%
- F500 in state
- 110
Industry mix (Fortune 500 HQ in TX)
| Industry | F500 HQs | Revenue |
|---|---|---|
| Energy | 16 | $1,198B |
|
||
| Technology | 5 | $198B |
|
||
| Engineering / Construction | 4 | $72B |
|
||
| Energy Services | 3 | $60B |
|
||
| Utilities | 3 | $41B |
|
||
| Healthcare | 2 | $330B |
|
||
Price history
+51.8% since first listed16 events — show timeline
- 2026-06-17 Listed $85,000 NTREIS
- 2026-03-01 Rental Removed $950 NTREIS
- 2025-12-28 Listed for Rent $950 NTREIS
- 2025-03-12 Listed $90,000 NTREIS
- 2024-12-01 Rental Removed $1,100 NTREIS
- 2024-09-23 Price Changed $1,100 NTREIS
- 2024-09-05 Listed for Rent $1,200 NTREIS
- 2023-09-09 Rental Removed $1,150 NTREIS
- 2023-07-16 Listed for Rent $1,150 NTREIS
- 2023-05-15 Sold (Public Records) — Public Records
- 2023-05-11 Sold (MLS) — NTREIS
- 2023-04-18 Pending — NTREIS
- 2023-04-14 Listed $56,000 NTREIS
- 2000-01-06 Sold (Public Records) — Public Records
- 1993-02-05 Sold (Public Records) — Public Records
- 1991-12-19 Sold (Public Records) — Public Records
Property tax history
+8.3%/yrLatest (2025): $1,403 · -0.4% YoY. Source: county tax records.
Cash-flow waterfall
monthlySold comps — $/sqft
last 12 mo · ≤1 miLoading sold comps…