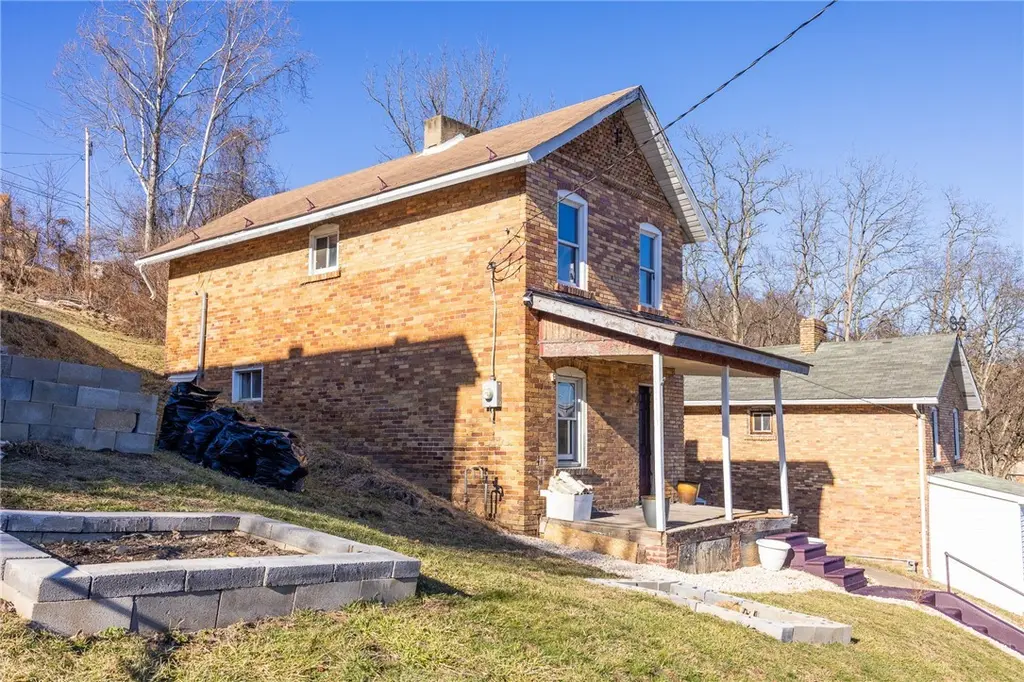
513 4th St · Marianna, PA
Flood risk 1/10 · Minimal
- FEMA flood zone
- X (unshaded)
- Chance of flooding over 30 yrs
- 0.0%
- Est. flood insurance / yr
- $473 – $860
Fire risk 1/10 · Minimal
- Est. fire insurance / yr
- $511 – $949
Heat risk 3/10 · Minor
- Hot days now (above 97°F)
- 7 days/yr
- Hot days in 30 yrs
- 18 days/yr
Wind risk 2/10 · Minimal
- Chance of severe wind over 30 yrs
- —
Air-quality risk 2/10 · Minimal
- Unhealthy air days now
- 1 days/yr
- Unhealthy air days in 30 yrs
- 2 days/yr
Risk factors via First Street. Map © Google.
Why this score? — see what drove the A- grade
The composite is a weighted blend of 9 inputs, each scored 0–100. Each bar is that input's sub-score; the figure is the points it added to the 100-point composite (weight × sub-score).
- Cash flow +30.0/30.0
- ARV discount +15.0/15.0
- 1% rule +10.0/10.0
- DSCR +10.0/10.0
- Appreciation +4.7/10.0
- Livability +3.0/5.0
- Rent growth +2.5/5.0
- Schools +2.5/10.0
- Condition / age +2.5/5.0
$34,900
🖨 Deal sheet (PDF) 📄 Offer letter ✓ Due diligence
Listing remarks MLS
This fully gutted 2-bedroom, 1-bath home is a prime opportunity for cash buyers, investors, and contractors. The property has been taken down to the studs, saving you time and demo costs so you can move straight into rebuilding. With a clean slate to design the layout and finishes, this is an ideal project for a flip, rental, or resale. Property is being sold as-is and is priced with renovation in mind — bring your vision and your offer.
Key facts
- 7,749 sq ft lot
- Built 1910
- Listed 106 days
Neighborhood map
What this means for you Summary
Snapshot
- This is a 2-bed/1.0-bath single-family listed at $35k.
Deal economics
- At list price, monthly cash flow is $585 ($7k/yr) — positive.
- The deal already cash-flows at list — no discount required.
- Meets the 1% rule at list price ($1k rent vs $35k).
- Recommended offer: $32k (9.0% below list) — sets the bar for market timing.
Location & tenants
- Location reads 60/100 on livability (#1,474 in PA) — a middle-class / working-renter tenant base. Strengths: cost of living A+, housing A+; Watch: employment C-, crime D+, amenities F.
- Bethlehem-Center SD (rural): math 18% / reading 39% proficiency, ranked #448 of 539 in PA (top 83%) — low school quality limits family demand, transient renter base, plan for 1-2y turnover.
- Zoned schools: Bethlehem-Center El Sch (math 24% / reading 50%, grade F, #1,004 of 1,518 statewide, top 68%, 435 students, 49% FRL); Bethlehem-Center Ms (math 3% / reading 29%, grade F, #467 of 512 statewide, top 91%, 242 students, 58% FRL); Bethlehem-Center Shs (math 90%, 302 students, 37% FRL).
- Market conditions: 9 active listings in the ZIP; 489 units permitted in Washington County in 2024 (30 in 5+ unit buildings).
Forward outlook
- In year one you build about $16 of equity ($241 loan paydown + $-225 appreciation (-0.7% local appreciation)).
- Washington County population projected to shrink 6% by 2050 — rents likely to lag national; underwrite the cash flow, not the appreciation.
- At projected returns (-0.7% appreciation + 3.0% rent growth), your $10k cash investment doubles in ~2 years — after that, you're playing with house money.
Negotiation context
- It's been on market 107 days — a 9% lower offer ($32k) is reasonable based on typical stale-listing flexibility.
- 2 sale attempts since 15y ago with the ask held roughly flat each time — persistent listings suggest the price (not the market) is what's stuck; bring a comps-based counter.
Risks & watch-outs
- Watch-outs: built in 1910 — expect roof / HVAC / electrical / plumbing capex.
Questions for the listing agent
- It's been on market 107 days. Have you received any prior offers? Is the seller open to a 9% concession, seller financing, or rate buy-down credit?
- Built in 1910 — when were the roof, HVAC, electrical panel, plumbing, and water heater last replaced?
- Why hasn't it sold? Are there any deal-killer items the seller is aware of (foundation, flood, title, zoning, code violations)?
- Is there a deadline driving the sale (1031 exchange, divorce, estate, relocation)? That informs how much negotiation room exists.
- Schools are F-rated, which usually means shorter tenancies and higher turnover. Who's the typical renter profile here, and what's been the actual vacancy rate?
- Crime grade is D in this area — have there been break-ins, vandalism, or insurance claims at this property in the last 3 years? What carrier currently insures it and at what premium?
- What's the average days-on-market for RENTAL listings here right now (not sales)? A rising rental-DOM trend means longer vacancies and softer asking-rent achievability than the comps imply.
- What's the recent tenant-quality profile in this submarket — average credit score on applications, eviction rate, late-payment / NSF rate, and stable-employment percentage? A property-management company in the area should have these aggregated.
- How much new for-sale + rental construction is in the pipeline within 1–3 miles? Heavy new supply typically softens prices + rents 12–24 months out; constrained supply supports both.
Investment metrics
- 1% rule
- 3.04% ✓
- Cap rate
- 26.40%
- Cash-on-cash
- 71.81%
- DSCR
- 4.20
- GRM
- 2.7
CMA / ARV
- ARV (median comp)
- $47,240
- List price
- $34,900
- Delta
- -26.12%
- Verdict
- UNDERPRICED
- Comps
- 6 within 1.0 mi
Show comp detail 1 sale within ~0.75 mi
| Address | Dist | Beds/Ba | Sqft | Sold | Price | $/sf | Match |
|---|---|---|---|---|---|---|---|
| 405 3rd St | 0.09mi | 3/1.0 (+1) | 1,116 (+6%) | 10mo | $8,500 | $8 | 73 |
Match score weights: distance 35% · size 25% · config 20% · recency 20%. Top-matched comps best support the ARV.
Projected returns pro-forma
-0.65% appreciation · 3.0% rent growth · sell at horizon
- IRR
- 73.4%
- Equity multiple
- 4.60×
- Total profit
- $35,200
- Equity at exit
- $9,021
- IRR
- 75.6%
- Equity multiple
- 9.41×
- Total profit
- $82,137
- Equity at exit
- $9,991
Cash invested: $9,772 (down + closing). Projections, not guarantees.
Landlord ↔ Tenant lean methodology
- Overall (STATE)
- 62 Landlord-Friendly
- State Pennsylvania
- 62 Landlord-Friendly · EVEN
- County
- — inherits STATE
- City
- — inherits STATE
ZIP-level market 15345
- Home prices YoY
- -0.6%
- Active inventory
- 9
- Price-to-rent
- 2.7×
Monthly cashflow live
- Estimated rent
- $1,062 medium interval (Pro) →
- Mortgage (P&I)
- −$183
- Tax from tax record
- −$57 /mo · $682/yr
- Insurance
- −$15
- HOA
- −$0
- Vacancy / Maint / Mgmt
- −$223
- Net cashflow
- $585
Break-even live
Sensitivity live
| Price | -10% $605 | -5% $595 | +0% $585 | +5% $575 | +10% $565 |
|---|---|---|---|---|---|
| Rent | -10% $501 | -5% $543 | +0% $585 | +5% $627 | +10% $669 |
| Rate | -1.0pp $602 | -0.5pp $594 | base $585 | +0.5pp $576 | +1.0pp $567 |
UW: 25.0% down · 7.5% · 30yr · 1.5% tax · 5.0% vac · 8.0% maint · 8.0% mgmt
Financing live
Cash to close
- Down payment
- $8,725
- Closing costs
- $1,047
- Reserves months
- —
- Total cash needed
- —
Loan-product check · same deal, 3 products live
Conventional
25% down · 7.5% · 30yr
- Down + closing
- —
- Monthly P&I
- —
- Monthly cashflow
- —
- DSCR
- —
- Eligible?
- —
Personal DTI + credit; lowest rate.
DSCR
20% down · 8.5% · 30yr
- Down + closing
- —
- Monthly P&I
- —
- Monthly cashflow
- —
- DSCR
- —
- Eligible?
- —
No personal income docs; deal must DSCR.
Hard money
10% down · 12.0% · 12mo
- Down + closing
- —
- Monthly P&I
- —
- Monthly cashflow
- —
- DSCR
- —
- Eligible?
- —
Short-term bridge; refi at stabilization.
Listing history 9 events
-
2026-06-09days on market $34,900 Active 107 DOM
-
2026-06-08days on market $34,900 Active 106 DOM
-
2026-06-07days on market $34,900 Active 105 DOM
-
2026-06-03days on market $34,900 Active 101 DOM
-
2026-06-02days on market $34,900 Active 100 DOM
-
2026-06-01days on market $34,900 Active 99 DOM
-
2026-05-31days on market $34,900 Active 98 DOM
-
2026-02-22$34,900 Active 447-char remark
Show marketing remark (447 chars)
This fully gutted 2-bedroom, 1-bath home is a prime opportunity for cash buyers, investors, and contractors. The property has been taken down to the studs, saving you time and demo costs so you can move straight into rebuilding. With a clean slate to design the layout and finishes, this is an ideal project for a flip, rental, or resale. Property is being sold as-is and is priced with renovation in mind — bring your vision and your offer.
-
2011-02-08$25,000 16-char remark
Show marketing remark (16 chars)
Being Sold As-Is
ⓘ Source: listings_history table (triggers on properties + properties_extension) + one-shot
backfill from property_details.listing_events for pre-trigger history.
Tax reassessment forecast PA · Partial reset (capped growth)
- Current annual tax
- $682 · $57/mo
- Projected year-2 tax
- $682 · $57/mo
- Expected delta
- $0/yr ($0/mo · 0.0%)
ⓘ Screening estimate from a state-policy table — verify with the county assessor before closing.
Climate risk First Street
- Flood 1/10 Low FEMA zone X (unshaded) · 0% chance over 30 yrs
- Wildfire 1/10 Low
- Heat 3/10 Moderate 7 d/yr ≥97°F today · 18 d/yr by 30 yrs out
- Wind 2/10 Low
- Air quality 2/10 Low 1 unhealthy d/yr today · 2 by 30 yrs out
Nearby sold comps map
Loading sold comps map…
Walkable amenities ~0.75 mi
Loading nearby amenities…
Taxation est. · year 1
- Rental income
- $12,747
- − Mortgage interest
- −$1,955
- − Property taxes
- −$682
- − Insurance
- −$174
- − Repairs & maintenance
- −$1,020
- − Management
- −$1,020
- − Depreciation
- −$1,015
- Taxable income
- $6,880
- Est. tax owed @ 24.0%
- −$1,651
- After-tax cash flow
- $5,366/yr
For passive investors: Depreciation is non-cash, so a rental often shows a tax loss while cash-flowing — sheltering income. Rental losses are passive: they offset passive income freely, and up to $25,000/yr can offset ordinary (W-2) income if you actively participate and your MAGI is under $100k (phasing out to $0 by $150k); unused losses carry forward. On sale, claimed depreciation is recaptured at up to 25%, and gains may owe capital-gains tax (a 1031 exchange can defer both). Figures are a year-1 estimate at your 24.0% rate — not tax advice; consult a CPA.
Schools (NCES district)
- District
- Bethlehem-Center SD
- NCES district ID
- 4203600
- Math proficiency
- 18% ▼ -14.00%
- Reading proficiency
- 39% ▼ -15.00%
- Median HH income
- $49,354
- Composite
- 24.81/100
- National rank
- #7596
- State rank
- #448 of 539 in PA
Livability — Marianna
- Score
- 60/100
- State rank
- #1474
- US rank
- #19015
Category grades
Schools grade is shown separately in the Schools card above.
Census & demographics
- Census place
- Marianna, PA
- City population
- 1,540
- Population (ZIP)
- 1,540
Population outlook (Washington County) Hauer SSP2
- Today (2025)
- 208,060 people
- By 2030
- 207,168 · -0.4%
- By 2040
- 202,738 · -2.6%
- By 2050
- 195,269 · -6.1%
- By 2075
- 175,588 · -15.6%
- By 2100
- 145,827 · -29.9%
Race, ethnicity, and origin ACS 2023
- Neighborhood character
- Predominantly White (89%)
- Race & ethnicity
- White 89% Two or more races 8% Hispanic / Latino 5% Black 2%
- Common ancestry
- Serbian 4% Romanian 3% Scotch-Irish 3%
- Foreign-born
- 1% · Canada
- Languages at home
- 98% English-only · Spanish 2%
Political lean MEDSL · Washington
- 2024 margin
- Strong R (+25.5) · D 36.9% · R 62.4%
- 2008→2024 swing
- -20.8pp toward R · 2008: -4.7pp · 2024: -25.5pp
- All cycles
- 2024: R+25.5 2020: R+22.8 2016: R+25.3 2012: R+13.3 2008: R+4.7
Not yet ingested
- Civics
- —
Market trends
- HPI YoY
- ▼ -0.65%
- Current HPI
- 110.0185
- Rent YoY
- —
- Metro
- —
- State GDP YoY
- ▲ 1.68%
- F500 in state
- 34
Industry mix (Fortune 500 HQ in PA)
| Industry | F500 HQs | Revenue |
|---|---|---|
| Healthcare | 2 | $309B |
|
||
| Insurance | 2 | $27B |
|
||
| Telecommunications / Media | 1 | $124B |
|
||
| Industrial Distribution | 1 | $22B |
|
||
| Financial Services | 1 | $20B |
|
||
| Chemicals / Materials | 1 | $18B |
|
||
Price history
+39.6% since first listed2 events — show timeline
- 2026-02-22 Listed $34,900 West Penn MLS
- 2011-02-08 Listed $25,000 West Penn MLS
Property tax history
+12.5%/yrLatest (2026): $682 · +18.1% YoY. Source: county tax records.
Cash-flow waterfall
monthlySold comps — $/sqft
last 12 mo · ≤1 miLoading sold comps…