146501` Pine St #108 · Harlingen, TX
Flood risk No data
- FEMA flood zone
- —
- Chance of flooding over 30 yrs
- —
- Est. flood insurance / yr
- —
Fire risk No data
- Est. fire insurance / yr
- —
Heat risk No data
- Hot days now (above threshold)
- —
- Hot days in 30 yrs
- —
Wind risk No data
- Chance of severe wind over 30 yrs
- —
Air-quality risk No data
- Unhealthy air days now
- —
- Unhealthy air days in 30 yrs
- —
Risk factors via First Street. Map © Google.
Why this score? — see what drove the B+ grade
The composite is a weighted blend of 9 inputs, each scored 0–100. Each bar is that input's sub-score; the figure is the points it added to the 100-point composite (weight × sub-score).
- Cash flow +30.0/30.0
- ARV discount +15.0/15.0
- 1% rule +10.0/10.0
- DSCR +10.0/10.0
- Livability +3.7/5.0
- Schools +2.5/10.0
- Condition / age +2.2/5.0
- Rent growth +2.0/5.0
- Appreciation +0.0/10.0
$62,500
🖨 Deal sheet 📄 Offer letter ✓ Due diligence
Listing remarks
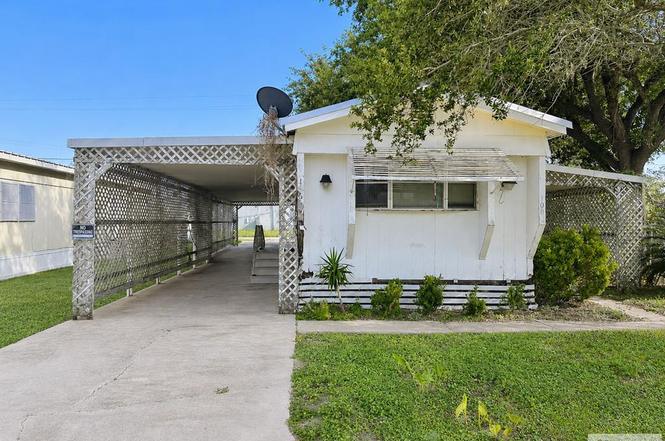
Located in a 55+ Community, quick and easy access to the highway, and conveniently located closely near a convenience store, two bedroom two bath residence with carport.
Key facts
- 5,250 sq ft lot
- Built 1978
Tags
Property features AI
Finance
- Other: Located in Sun Valley Acres subdivision
- HOA & community: Located in a senior community
Exterior
- Utilities: Public water; Public sewer
- Home design: Manufactured home; Single-story
- Construction: Wood siding; Composition roof
- Exterior features: Covered patio/porch
Interior
- Bedrooms: Manufactured home bedroom(s)
- Flooring: Carpet
- Bathrooms: 2 full bathrooms
- Heating & cooling: Central heating; Central air
- Interior features: Ceiling fans
Neighborhood map
What this means for you Summary
Snapshot
- This is a 2-bed/2.0-bath manufactured listed at $62k. Condition is rated fair.
Deal economics
- At list price, monthly cash flow is $523 ($6k/yr) — positive.
- The deal already cash-flows at list — no discount required.
- Meets the 1% rule at list price ($1k rent vs $62k).
- Cap rate 16.3% vs local median 3.8% in Harlingen — top-decile yield for the area; either an underpriced asset or a hidden risk that comps aren't pricing in. Stress-test before assuming the spread holds.
Location & tenants
- Location reads 73/100 on livability (#217 in TX) — a middle-class / working-renter tenant base. Strengths: amenities A+, cost of living A+, housing A+; Watch: crime C-, schools D+, commute F.
- La Feria ISD (suburban): math 27% / reading 35% proficiency, ranked #630 of 826 in TX (top 76%) — families likely to look elsewhere, expect single-tenant / working-renter base with shorter leases.
- Market conditions: Rents soft (-1.9%/yr); 534 active listings in the ZIP; 2,326 units permitted in Cameron County in 2024 (503 in 5+ unit buildings).
Forward outlook
- Local home prices are declining (-3.0%/yr); year-one equity from $432 of loan paydown is wiped out by about $2k of value loss. Plan a longer hold.
- Cameron County population projected at +3% by 2050 — modest demand growth; plan on rents tracking national, not racing it.
- At projected returns (-3.0% appreciation + 0.0% rent growth), your $18k cash investment doubles in ~4 years — after that, you're playing with house money.
Negotiation context
- Only 1 days on market — expect competitive offers; lowballing is unlikely to land.
Questions for the listing agent
- Have any recent inspections been done? Can we get a copy of the seller's disclosures and any deferred-maintenance estimates?
- Built in 1978 — when were the roof, HVAC, electrical panel, plumbing, and water heater last replaced?
- Is there a deadline driving the sale (1031 exchange, divorce, estate, relocation)? That informs how much negotiation room exists.
- Schools are D-rated, which usually means shorter tenancies and higher turnover. Who's the typical renter profile here, and what's been the actual vacancy rate?
- What's the average days-on-market for RENTAL listings here right now (not sales)? A rising rental-DOM trend means longer vacancies and softer asking-rent achievability than the comps imply.
- What's the recent tenant-quality profile in this submarket — average credit score on applications, eviction rate, late-payment / NSF rate, and stable-employment percentage? A property-management company in the area should have these aggregated.
- How much new for-sale + rental construction is in the pipeline within 1–3 miles? Heavy new supply typically softens prices + rents 12–24 months out; constrained supply supports both.
Investment metrics
- 1% rule
- 1.93% ✓
- Cap rate
- 16.34%
- Cash-on-cash
- 35.89%
- DSCR
- 2.60
- GRM
- 4.3
CMA / ARV
- ARV (on-the-fly)
- $77,616
- Comps found
- 2
Show comp detail 2 sales within ~0.75 mi
| Address | Dist | Beds/Ba | Sqft | Sold | Price | $/sf | Match |
|---|---|---|---|---|---|---|---|
| 25919 Maple Dr | 0.09mi | 2/1.5 | 896 (-3%) | 10mo | $75,000 | $84 | 80 |
| 14610 Oak St | 0.08mi | 3/1.5 (+1) | 1,052 (+14%) | 4mo | $56,999 | $54 | 63 |
Match score weights: distance 35% · size 25% · config 20% · recency 20%. Top-matched comps best support the ARV.
Projected returns pro-forma
-3.0% appreciation · 0.0% rent growth · sell at horizon
- IRR
- 28.1%
- Equity multiple
- 2.12×
- Total profit
- $19,685
- Equity at exit
- $9,319
- IRR
- 33.8%
- Equity multiple
- 3.65×
- Total profit
- $46,448
- Equity at exit
- $5,404
Cash invested: $17,500 (down + closing). Projections, not guarantees.
Landlord ↔ Tenant lean methodology
- Overall (STATE)
- 87 Strongly Landlord-Friendly
- State Texas
- 87 Strongly Landlord-Friendly · R+5
- County
- — inherits STATE
- City
- — inherits STATE
ZIP-level market 78552
- Home prices YoY
- -13.8%
- Rents YoY
- -1.9%
- Active inventory
- 534
- Price-to-rent
- 4.3×
Monthly cashflow live
- Estimated rent
- $1,209 medium interval (Pro) →
- Mortgage (P&I)
- −$328
- Tax est. 1.5%
- −$78 /mo · $938/yr
- Insurance
- −$26
- HOA
- −$0
- Vacancy / Maint / Mgmt
- −$254
- Net cashflow
- $523
Break-even live
UW: 25.0% down · 7.5% · 30yr · 1.5% tax · 5.0% vac · 8.0% maint · 8.0% mgmt
Financing live
Cash to close
- Down payment
- $15,625
- Closing costs
- $1,875
- Reserves months
- —
- Total cash needed
- —
Loan-product check · same deal, 3 products live
Conventional
25% down · 7.5% · 30yr
- Down + closing
- —
- Monthly P&I
- —
- Monthly cashflow
- —
- DSCR
- —
- Eligible?
- —
Personal DTI + credit; lowest rate.
DSCR
20% down · 8.5% · 30yr
- Down + closing
- —
- Monthly P&I
- —
- Monthly cashflow
- —
- DSCR
- —
- Eligible?
- —
No personal income docs; deal must DSCR.
Hard money
10% down · 12.0% · 12mo
- Down + closing
- —
- Monthly P&I
- —
- Monthly cashflow
- —
- DSCR
- —
- Eligible?
- —
Short-term bridge; refi at stabilization.
Listing history 2 events
-
2026-06-19remarks 169-char remark
-
2026-06-19$62,500 Active 1 DOM
ⓘ Source: listings_history table (triggers on properties + properties_extension) + one-shot
backfill from property_details.listing_events for pre-trigger history.
Nearby sold comps map
Loading sold comps map…
Walkable amenities ~0.75 mi
Loading nearby amenities…
Taxation est. · year 1
- Rental income
- $14,512
- − Mortgage interest
- −$3,501
- − Property taxes
- −$938
- − Insurance
- −$312
- − Repairs & maintenance
- −$1,161
- − Management
- −$1,161
- − Depreciation
- −$1,818
- Taxable income
- $5,621
- Est. tax owed @ 24.0%
- −$1,349
- After-tax cash flow
- $4,932/yr
For passive investors: Depreciation is non-cash, so a rental often shows a tax loss while cash-flowing — sheltering income. Rental losses are passive: they offset passive income freely, and up to $25,000/yr can offset ordinary (W-2) income if you actively participate and your MAGI is under $100k (phasing out to $0 by $150k); unused losses carry forward. On sale, claimed depreciation is recaptured at up to 25%, and gains may owe capital-gains tax (a 1031 exchange can defer both). Figures are a year-1 estimate at your 24.0% rate — not tax advice; consult a CPA.
Condition & rehab AI · 9 photos
This manufactured home requires moderate repairs and maintenance to improve its condition and increase its value.
Repairs flagged
- Major roof — visible wear
- Major exterior siding — some discoloration
- Major interior walls — wallpaper with discoloration
- Major flooring — carpeted floors with wear
Value-add opportunities
- Both paint interior walls — enhances curb appeal and interior aesthetics
- Both replace carpeting — improves comfort and reduces maintenance
- Both repair roof — prevents water damage and enhances overall appearance
- Both replace exterior siding — enhances curb appeal and improves structural integrity
Renovation cost estimate screening
| Repair item | Severity | Est. cost |
|---|---|---|
| roof · visible wear | Major | $15,000–50,000 |
| exterior siding · some discoloration | Major | $15,000–50,000 |
| interior walls · wallpaper with discoloration | Major | $15,000–50,000 |
| flooring · carpeted floors with wear | Major | $15,000–50,000 |
| Total estimated repair cost · 4 items | $60,000–200,000 |
Value-add ROI direction
- Both paint interior walls — enhances curb appeal and interior aesthetics ↑
- Both replace carpeting — improves comfort and reduces maintenance ↑
- Both repair roof — prevents water damage and enhances overall appearance ↑
- Both replace exterior siding — enhances curb appeal and improves structural integrity ↑
ⓘ Cost ranges are severity-bucket heuristics (US national rule-of-thumb). Get contractor quotes + a written scope before underwriting a rehab budget.
Schools (NCES district)
- District
- La Feria ISD
- NCES district ID
- 4826040
- Math proficiency
- 27% ▼ -25.00%
- Reading proficiency
- 35% ▼ -4.00%
- Median HH income
- $33,306
- Composite
- 25.41/100
- National rank
- #7460
- State rank
- #630 of 826 in TX
Livability — Harlingen
- Score
- 73/100
- State rank
- #217
- US rank
- #5347
Category grades
Schools grade is shown separately in the Schools card above.
Census & demographics
- County
- Cameron County · 310,734 people
- City population
- 95,667
- Metro
- Brownsville-Harlingen, TX
- Population (ZIP)
- 42,332
- Household income
- $69,811
- Rent vs Own
- Severe rent burden
- 487.0
Population outlook (Cameron County) Hauer SSP2
- Today (2025)
- 441,603 people
- By 2030
- 448,113 · +1.5%
- By 2040
- 456,385 · +3.3%
- By 2050
- 456,294 · +3.3%
- By 2075
- 423,851 · -4.0%
- By 2100
- 342,787 · -22.4%
Race, ethnicity, and origin ACS 2023
- Neighborhood character
- Predominantly Hispanic (80%)
- Race & ethnicity
- Hispanic / Latino 80% Two or more races 31% White 16% Asian 2%
- Hispanic origin (detail)
- Mexican 75%
- Common ancestry
- Lithuanian 1% Romanian 1% Slovak 1%
- Foreign-born
- 15% · Canada
- Languages at home
- 49% English-only · Spanish 49% Vietnamese 1%
Political lean MEDSL · Cameron
- 2024 margin
- Lean R (+5.8) · D 46.7% · R 52.5%
- 2008→2024 swing
- -34.6pp toward R · 2008: 28.8pp · 2024: -5.8pp
- All cycles
- 2024: R+5.8 2020: D+13.2 2016: D+32.5 2012: D+32.4 2008: D+28.8
Not yet ingested
- Civics
- —
Market trends
- HPI YoY
- ▼ -31.61%
- Current HPI
- 197.1906
- Rent YoY
- ▼ -1.87%
- Metro
- Brownsville-Harlingen, TX
- State GDP YoY
- ▲ 3.95%
- F500 in state
- 110
Industry mix (Fortune 500 HQ in TX)
| Industry | F500 HQs | Revenue |
|---|---|---|
| Energy | 16 | $1,198B |
|
||
| Technology | 5 | $198B |
|
||
| Engineering / Construction | 4 | $72B |
|
||
| Energy Services | 3 | $60B |
|
||
| Utilities | 3 | $41B |
|
||
| Healthcare | 2 | $330B |
|
||
Price history
1 event — show timeline
- 2026-06-18 Listed $62,500 RGVMLS
Cash-flow waterfall
monthlySold comps — $/sqft
last 12 mo · ≤1 miLoading sold comps…