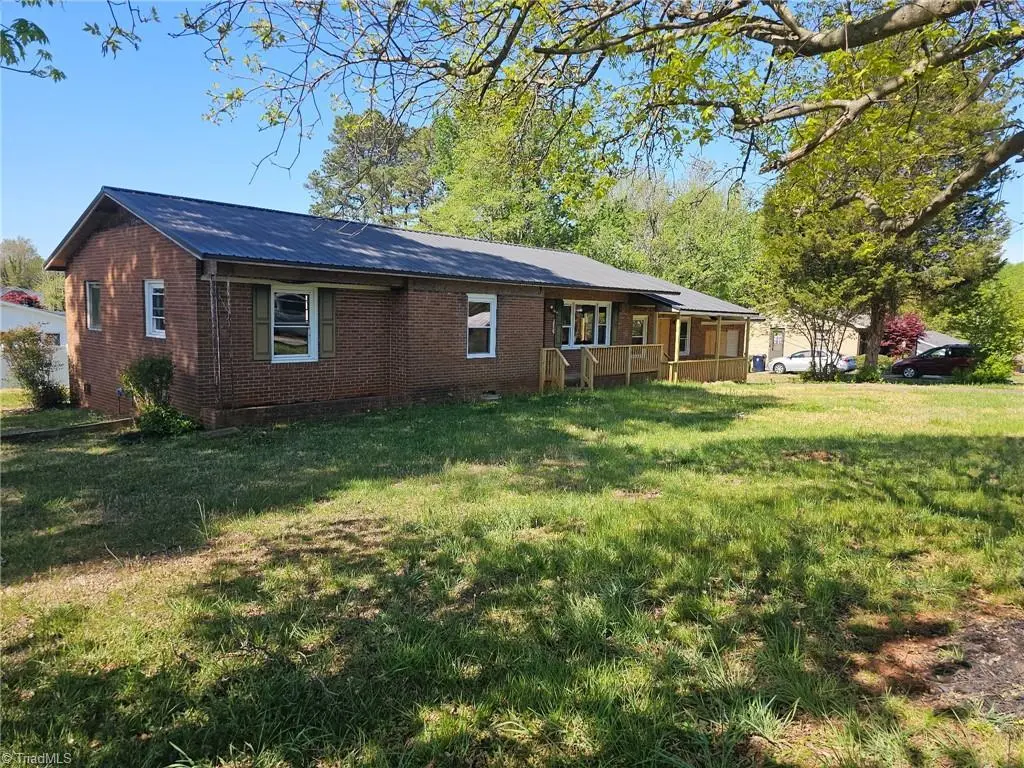
101 Markwood Ln · Lexington, NC
Flood risk 1/10 · Minimal
- FEMA flood zone
- X (unshaded)
- Chance of flooding over 30 yrs
- 0.0%
- Est. flood insurance / yr
- $507 – $1,088
Fire risk 1/10 · Minimal
- Est. fire insurance / yr
- $906 – $1,684
Heat risk 5/10 · Moderate
- Hot days now (above 103°F)
- 7 days/yr
- Hot days in 30 yrs
- 17 days/yr
Wind risk 4/10 · Minor
- Chance of severe wind over 30 yrs
- 13.0%
Air-quality risk 2/10 · Minimal
- Unhealthy air days now
- 1 days/yr
- Unhealthy air days in 30 yrs
- 2 days/yr
Risk factors via First Street. Map © Google.
Why this score? — see what drove the B- grade
The composite is a weighted blend of 9 inputs, each scored 0–100. Each bar is that input's sub-score; the figure is the points it added to the 100-point composite (weight × sub-score).
- Cash flow +26.6/30.0
- ARV discount +15.0/15.0
- DSCR +9.1/10.0
- 1% rule +5.9/10.0
- Livability +3.6/5.0
- Rent growth +3.3/5.0
- Schools +2.8/10.0
- Condition / age +2.5/5.0
- Appreciation +0.0/10.0
$175,000
🖨 Deal sheet 📄 Offer letter ✓ Due diligence
Listing remarks MLS
This spacious home offers great potential with its 3 bedrooms and 2 bathrooms. Please note, the property is currently in the unfinished stage, with walls not yet finished. Contact us for more details or to schedule a viewing. Home is being sold as-is in it's current condition **terms have been accepted; awaiting execution of contract**
Key facts
- Blank slate
- Completely gutted
- Endless potential
Tags
Property features AI
Finance
- Other: Directions: US 64 to downtown, left on W Center St Ext, right on Boaze Rd, left on Markwood Ln, house is on the left; Association listed as Greensboro (association not active)
- HOA & community: No homeowners association; Subdivision: Pleasant Hills
Exterior
- Parking: Attached garage; Driveway; 1 garage space
- Utilities: Public water; Public sewer; No water heater listed
- Home design: One-story house; Stick/site built residential property; Built in 1966; Brick construction; Existing structure
- Construction: Brick exterior; Crawl space foundation; Shallow lot (0.38 acre)
- Exterior features: Public water; Public sewer; Publicly maintained road; Lot 11
Interior
- Bathrooms: Two full bathrooms
- Heating & cooling: No heating; No cooling; No heating fuel
- Interior features: Primary bedroom on main level; Crawl space foundation
Neighborhood map
What this means for you Summary
Snapshot
- This is a 3-bed/2.0-bath single-family listed at $175k.
Deal economics
- At list price, monthly cash flow is $466 ($6k/yr) — positive.
- The deal already cash-flows at list — no discount required.
- Meets the 1% rule at list price ($2k rent vs $175k).
- Recommended offer: $170k (3.0% below list) — sets the bar for market timing.
- Cap rate 9.5% vs local median 3.5% in Lexington — top-decile yield for the area; either an underpriced asset or a hidden risk that comps aren't pricing in. Stress-test before assuming the spread holds.
Location & tenants
- Location reads 72/100 on livability (#89 in NC) — a middle-class / working-renter tenant base. Strengths: commute A+, cost of living A+, health & safety A+; Watch: schools D, crime F, amenities D-.
- Lexington City Schools (suburban): math 32% / reading 38% proficiency, ranked #136 of 178 in NC (top 76%) — families likely to look elsewhere, expect single-tenant / working-renter base with shorter leases; 78% free/reduced lunch — lower-income household profile, screen leases tightly.
- Market conditions: Rents rising (+3.4%/yr); 351 active listings in the ZIP; 3 comparable units currently listed for rent nearby; rentals at typical pace (median 24d on market — plan ~3-4 weeks tenant-placement turnaround); 990 units permitted in Davidson County in 2024 (54 in 5+ unit buildings).
- This rent runs 36% of the median local income ($64k/yr) — at the standard rent-burdened threshold; future hikes will face affordability resistance.
Forward outlook
- Local home prices are declining (-3.0%/yr); year-one equity from $1k of loan paydown is wiped out by about $5k of value loss. Plan a longer hold.
- Davidson County population projected to shrink 6% by 2050 — rents likely to lag national; underwrite the cash flow, not the appreciation.
- At projected returns (-3.0% appreciation + 3.4% rent growth), your $49k cash investment doubles in ~10 years — after that, you're playing with house money.
Negotiation context
- It's been on market 58 days — a 3% lower offer ($170k) is reasonable based on typical stale-listing flexibility.
- 2 sale attempts with the ask held roughly flat each time — persistent listings suggest the price (not the market) is what's stuck; bring a comps-based counter.
- Current owner paid $125k; 40% above their basis — modest negotiation headroom, anchor on the comps not their cost.
Risks & watch-outs
- Climate carrying-cost: extreme-heat days projected 7→17/yr by 2055 (HVAC capex compounding) — expect insurance premiums to compound above CPI over the hold.
Questions for the listing agent
- It's been on market 58 days. Have you received any prior offers? Is the seller open to a 3% concession, seller financing, or rate buy-down credit?
- Built in 1966 — when were the roof, HVAC, electrical panel, plumbing, and water heater last replaced?
- Is there a deadline driving the sale (1031 exchange, divorce, estate, relocation)? That informs how much negotiation room exists.
- Schools are D-rated, which usually means shorter tenancies and higher turnover. Who's the typical renter profile here, and what's been the actual vacancy rate?
- Crime grade is F in this area — have there been break-ins, vandalism, or insurance claims at this property in the last 3 years? What carrier currently insures it and at what premium?
- What's the average days-on-market for RENTAL listings here right now (not sales)? A rising rental-DOM trend means longer vacancies and softer asking-rent achievability than the comps imply.
- What's the recent tenant-quality profile in this submarket — average credit score on applications, eviction rate, late-payment / NSF rate, and stable-employment percentage? A property-management company in the area should have these aggregated.
- How much new for-sale + rental construction is in the pipeline within 1–3 miles? Heavy new supply typically softens prices + rents 12–24 months out; constrained supply supports both.
Investment metrics
- 1% rule
- 1.09% ✓
- Cap rate
- 9.49%
- Cash-on-cash
- 11.42%
- DSCR
- 1.51
- GRM
- 7.6
CMA / ARV
- ARV (on-the-fly)
- $292,039
- Comps found
- 12
Show comp detail 12 sales within ~0.75 mi
| Address | Dist | Beds/Ba | Sqft | Sold | Price | $/sf | Match |
|---|---|---|---|---|---|---|---|
| 132 Tannin Way | 0.37mi | 3/2.5 | 2,032 (-3%) | 2mo | $300,000 | $148 | 74 |
| 397 Ovada Ave | 0.40mi | 3/2.5 | 2,187 (+4%) | 6mo | $288,000 | $132 | 68 |
| 217 Woodhaven Dr | 0.31mi | 4/2.5 (+1) | 2,018 (-4%) | 8mo | $293,000 | $145 | 65 |
| 315 Ovada Ave | 0.38mi | 3/2.5 | 2,263 (+8%) | 10mo | $304,000 | $134 | 59 |
| 209 Hillside Dr | 0.23mi | 4/2.5 (+1) | 2,317 (+10%) | 10mo | $305,000 | $132 | 56 |
| 402 Vineyard Ln | 0.48mi | 3/2.0 | 1,918 (-9%) | 8mo | $300,000 | $156 | 56 |
| 128 Habersham Ct | 0.62mi | 3/2.5 | 1,963 (-7%) | 9mo | $302,000 | $154 | 51 |
| 115 Wintergreen Ct | 0.56mi | 4/2.5 (+1) | 2,231 (+6%) | 10mo | $309,000 | $139 | 48 |
| 140 Wintergreen Ct | 0.65mi | 3/2.5 | 2,255 (+7%) | 12mo | $340,000 | $151 | 46 |
| 213 Sidney St | 0.63mi | 3/2.0 | 2,400 (+14%) | 3mo | $285,000 | $119 | 45 |
| 207 Bremen Dr | 0.73mi | 3/2.0 | 1,865 (-11%) | 3mo | $255,000 | $137 | 45 |
| 201 Broadview Ave | 0.63mi | 3/1.0 | 1,869 (-11%) | 9mo | $190,000 | $102 | 40 |
Match score weights: distance 35% · size 25% · config 20% · recency 20%. Top-matched comps best support the ARV.
Projected returns pro-forma
-3.0% appreciation · 3.37% rent growth · sell at horizon
- IRR
- 1.1%
- Equity multiple
- 1.04×
- Total profit
- $1,974
- Equity at exit
- $26,093
- IRR
- 11.0%
- Equity multiple
- 1.87×
- Total profit
- $42,612
- Equity at exit
- $15,131
Cash invested: $49,000 (down + closing). Projections, not guarantees.
Landlord ↔ Tenant lean methodology
- Overall (STATE)
- 85 Strongly Landlord-Friendly
- State North Carolina
- 85 Strongly Landlord-Friendly · R+3
- County
- — inherits STATE
- City
- — inherits STATE
ZIP-level market 27295
- Home prices YoY
- -15.2%
- Rents YoY
- 3.4%
- Active inventory
- 351
- Price-to-rent
- 7.6×
Monthly cashflow live
- Estimated rent
- $1,913 medium interval (Pro) →
- Mortgage (P&I)
- −$918
- Tax from tax record
- −$55 /mo · $659/yr
- Insurance
- −$73
- HOA
- −$0
- Vacancy / Maint / Mgmt
- −$402
- Net cashflow
- $466
Break-even live
UW: 25.0% down · 7.5% · 30yr · 1.5% tax · 5.0% vac · 8.0% maint · 8.0% mgmt
Financing live
Cash to close
- Down payment
- $43,750
- Closing costs
- $5,250
- Reserves months
- —
- Total cash needed
- —
Loan-product check · same deal, 3 products live
Conventional
25% down · 7.5% · 30yr
- Down + closing
- —
- Monthly P&I
- —
- Monthly cashflow
- —
- DSCR
- —
- Eligible?
- —
Personal DTI + credit; lowest rate.
DSCR
20% down · 8.5% · 30yr
- Down + closing
- —
- Monthly P&I
- —
- Monthly cashflow
- —
- DSCR
- —
- Eligible?
- —
No personal income docs; deal must DSCR.
Hard money
10% down · 12.0% · 12mo
- Down + closing
- —
- Monthly P&I
- —
- Monthly cashflow
- —
- DSCR
- —
- Eligible?
- —
Short-term bridge; refi at stabilization.
Rent comps 3 comps
| Address | Beds | Baths | Sqft | Rent | $/sqft | DOM | Units | Dist |
|---|---|---|---|---|---|---|---|---|
| 206 Crane Creek Way Lexington, NC | 3.0 | 2.5 | 1588 | $1,650 | $1.04 | 23d | 1 | 0.55mi |
| 119 Habersham Ct Lexington, NC | 3.0 | 2.5 | 2252 | $1,775 | $0.79 | 23d | 1 | 0.59mi |
| 152 Iroquois Trl Lexington, NC | 3.0 | 2.5 | 1828 | $2,010 | $1.10 | 14d | 1 | 1.21mi |
Listing history 20 events
-
2026-06-18days on market $175,000 Active 58 DOM
-
2026-06-17days on market $175,000 Active 57 DOM
-
2026-06-16days on market $175,000 Active 56 DOM
-
2026-06-15days on market $175,000 Active 55 DOM
-
2026-06-14days on market $175,000 Active 53 DOM
-
2026-06-10days on market $175,000 Active 50 DOM
-
2026-06-09days on market $175,000 Active 49 DOM
-
2026-06-08days on market $175,000 Active 48 DOM
-
2026-06-07days on market $175,000 Active 47 DOM
-
2026-06-05days on market $175,000 Active 44 DOM
-
2026-06-03days on market $175,000 Active 43 DOM
-
2026-06-02days on market $175,000 Active 42 DOM
-
2026-06-01days on market $175,000 Active 41 DOM
-
2026-05-31days on market $175,000 Active 40 DOM
-
2026-05-31days on market $175,000 Active 39 DOM
-
2026-04-21$175,000 Active
-
2025-09-29soldstatus $125,000 Closed 339-char remark
Show marketing remark (339 chars)
This spacious home offers great potential with its 3 bedrooms and 2 bathrooms. Please note, the property is currently in the unfinished stage, with walls not yet finished. Contact us for more details or to schedule a viewing. Home is being sold as-is in it's current condition **terms have been accepted; awaiting execution of contract**
-
2025-09-10status Pending 339-char remark
Show marketing remark (339 chars)
This spacious home offers great potential with its 3 bedrooms and 2 bathrooms. Please note, the property is currently in the unfinished stage, with walls not yet finished. Contact us for more details or to schedule a viewing. Home is being sold as-is in it's current condition **terms have been accepted; awaiting execution of contract**
-
2025-07-17$119,900 Active 339-char remark
Show marketing remark (339 chars)
This spacious home offers great potential with its 3 bedrooms and 2 bathrooms. Please note, the property is currently in the unfinished stage, with walls not yet finished. Contact us for more details or to schedule a viewing. Home is being sold as-is in it's current condition **terms have been accepted; awaiting execution of contract**
-
1988-06-01soldstatus $48,000
ⓘ Source: listings_history table (triggers on properties + properties_extension) + one-shot
backfill from property_details.listing_events for pre-trigger history.
Tax reassessment forecast NC · Resets to sale price
- Current annual tax
- $659 · $55/mo
- Projected year-2 tax
- $1,435 · $120/mo
- Expected delta
- +$776/yr (+$65/mo · 117.9%)
ⓘ Screening estimate from a state-policy table — verify with the county assessor before closing.
Climate risk First Street
- Flood 1/10 Low FEMA zone X (unshaded) · 0% chance over 30 yrs
- Wildfire 1/10 Low
- Heat 5/10 Major 7 d/yr ≥103°F today · 17 d/yr by 30 yrs out
- Wind 4/10 Moderate 13% chance of damaging wind over 30 yrs
- Air quality 2/10 Low 1 unhealthy d/yr today · 2 by 30 yrs out
Nearby sold comps map
Loading sold comps map…
Walkable amenities ~0.75 mi
Loading nearby amenities…
Taxation est. · year 1
- Rental income
- $22,962
- − Mortgage interest
- −$9,803
- − Property taxes
- −$659
- − Insurance
- −$875
- − Repairs & maintenance
- −$1,837
- − Management
- −$1,837
- − Depreciation
- −$5,091
- Taxable income
- $2,861
- Est. tax owed @ 24.0%
- −$687
- After-tax cash flow
- $4,907/yr
For passive investors: Depreciation is non-cash, so a rental often shows a tax loss while cash-flowing — sheltering income. Rental losses are passive: they offset passive income freely, and up to $25,000/yr can offset ordinary (W-2) income if you actively participate and your MAGI is under $100k (phasing out to $0 by $150k); unused losses carry forward. On sale, claimed depreciation is recaptured at up to 25%, and gains may owe capital-gains tax (a 1031 exchange can defer both). Figures are a year-1 estimate at your 24.0% rate — not tax advice; consult a CPA.
Schools (NCES district)
- District
- Lexington City Schools
- NCES district ID
- 3702640
- Math proficiency
- 32% ▲ 3.00%
- Reading proficiency
- 38% ▲ 6.00%
- Median HH income
- $27,758
- Composite
- 28.2/100
- National rank
- #6807
- State rank
- #136 of 178 in NC
Livability — Lexington
- Score
- 72/100
- State rank
- #89
- US rank
- #6051
Category grades
Schools grade is shown separately in the Schools card above.
Census & demographics
- Census place
- Lexington, NC
- County
- Davidson County · 129,088 people
- City population
- 79,578
- Metro
- Winston-Salem, NC
- Population (ZIP)
- 39,267
- Household income
- $63,961
- Rent vs Own
- Severe rent burden
- 733.0
Population outlook (Davidson County) Hauer SSP2
- Today (2025)
- 167,156 people
- By 2030
- 167,216 · +0.0%
- By 2040
- 164,524 · -1.6%
- By 2050
- 157,229 · -5.9%
- By 2075
- 138,084 · -17.4%
- By 2100
- 112,729 · -32.6%
Race, ethnicity, and origin ACS 2023
- Neighborhood character
- Predominantly White (82%)
- Race & ethnicity
- White 82% Hispanic / Latino 6% Black 6% Two or more races 4% Asian 3%
- Hispanic origin (detail)
- Mexican 4%
- Common ancestry
- Serbian 2% Slovak 2% Italian 2%
- Foreign-born
- 5% · Canada, Jamaica
- Languages at home
- 93% English-only · Spanish 5% Other Asian/Pacific 1%
Political lean MEDSL · Davidson
- 2024 margin
- Solid R (+47.1) · D 25.9% · R 73.0% · Other 1.1%
- 2008→2024 swing
- -13.5pp toward R · 2008: -33.5pp · 2024: -47.1pp
- All cycles
- 2024: R+47.1 2020: R+47.5 2016: R+49.4 2012: R+40.9 2008: R+33.5
Not yet ingested
- Civics
- —
Market trends
- HPI YoY
- ▼ -46.39%
- Current HPI
- 258.6557
- Rent YoY
- ▲ 3.37%
- Metro
- Winston-Salem, NC
- State GDP YoY
- ▲ 3.28%
- F500 in state
- 26
Industry mix (Fortune 500 HQ in NC)
| Industry | F500 HQs | Revenue |
|---|---|---|
| Financial Services | 2 | $213B |
|
||
| Retail | 2 | $95B |
|
||
| Industrial Conglomerate | 1 | $38B |
|
||
| Metals / Steel | 1 | $35B |
|
||
| Utilities | 1 | $30B |
|
||
| Industrial Machinery | 1 | $19B |
|
||
Price history
+264.6% since first listed5 events — show timeline
- 2026-04-21 Listed $175,000 Triad MLS
- 2025-09-29 Sold (MLS) $125,000 Triad MLS
- 2025-09-10 Pending — Triad MLS
- 2025-07-17 Listed $119,900 Triad MLS
- 1988-06-01 Sold (Public Records) $48,000 Public Records
Property tax history
-6.6%/yrLatest (2025): $659 · +0.0% YoY. Source: county tax records.
Cash-flow waterfall
monthlySold comps — $/sqft
last 12 mo · ≤1 miLoading sold comps…