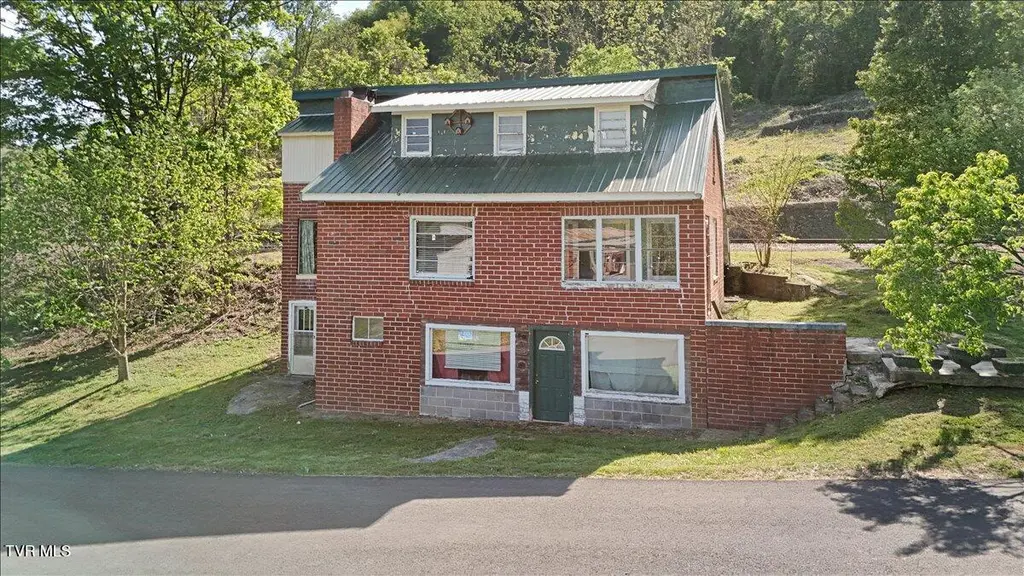
143 Mustang St · Clinchport, VA
Flood risk 10/10 · Severe
- FEMA flood zone
- AE
- Chance of flooding over 30 yrs
- 0.99%
- Est. flood insurance / yr
- $2,026 – $9,024
Fire risk 6/10 · Moderate
- Est. fire insurance / yr
- $666 – $1,236
Heat risk 4/10 · Minor
- Hot days now (above 98°F)
- 7 days/yr
- Hot days in 30 yrs
- 22 days/yr
Wind risk 2/10 · Minimal
- Chance of severe wind over 30 yrs
- —
Air-quality risk 2/10 · Minimal
- Unhealthy air days now
- 1 days/yr
- Unhealthy air days in 30 yrs
- 1 days/yr
Risk factors via First Street. Map © Google.
Why this score? — see what drove the A- grade
The composite is a weighted blend of 9 inputs, each scored 0–100. Each bar is that input's sub-score; the figure is the points it added to the 100-point composite (weight × sub-score).
- Cash flow +30.0/30.0
- ARV discount +15.0/15.0
- 1% rule +10.0/10.0
- DSCR +10.0/10.0
- Appreciation +6.2/10.0
- Schools +5.8/10.0
- Rent growth +2.5/5.0
- Condition / age +2.5/5.0
- Livability +2.2/5.0
$95,000
🖨 Deal sheet (PDF) 📄 Offer letter ✓ Due diligence
Listing remarks
Are you looking for a weekend getaway close to the Clinch River? This fixer upper is just a hop, skip, and a jump from the water. Walk to the water's edge and drop in your line or drive just a few minutes to the public boat launch to drop in your kayak or jon boat. Home potentially has room for up to 5 bedrooms; however septic records will need to verify actual permitted space. There are currently 3 bathrooms in the home. Roof installed in 2013. Water tanks to the rear of the home were used for campers and will convey with property. No heat pump present. Current method of heat is a wood stove and electric heaters. This home will not qualify for any gov't backed loan. This will be a cash o
Key facts
- Wood stove
- Water tanks
- Public boat launch
Tags
Property features AI
Finance
- HOA & community: Community offers fishing
Exterior
- Parking: Gravel parking
- Utilities: Public water; Private sewer; Electricity available; Cable available; Phone available; Water connected
- Home design: Single-family house; One and one-half stories; Residential zoning
- Construction: Block, brick, concrete, and plaster construction; Block foundation; Built as a house
- Exterior features: Enclosed side porch; Metal roof; Storage and workshop on the property; Rolling/sloped topography; Has a view
Interior
- Flooring: Concrete; Vinyl
- Bathrooms: 2 full bathrooms
- Heating & cooling: Heating available: space heater, wood stove, wood; No central cooling
- Interior features: Concrete and vinyl flooring; Basement with block and concrete construction and walk-out access; Six total rooms; Fixer condition
Neighborhood map
What this means for you Summary
Snapshot
- This is a 2-bed/1.5-bath single-family listed at $95k.
Deal economics
- At list price, monthly cash flow is $246 ($3k/yr) — positive.
- The deal already cash-flows at list — no discount required.
- Meets the 1% rule at list price ($2k rent vs $95k).
- Recommended offer: $92k (3.0% below list) — sets the bar for market timing.
Location & tenants
- Location reads 45/100 on livability (#566 in VA) — a working-class tenant base; expect higher turnover. Strengths: cost of living A+, crime A; Watch: amenities F, commute F, employment F.
- Scott County Public School District (rural): math 66% / reading 73% proficiency, ranked #33 of 131 in VA (top 25%) — acceptable for families but not a draw, mixed tenant base, ~2y average lease.
- Zoned schools: Duffield-Pattonsville Primary (math 67% / reading 72%, grade A-, #313 of 1,108 statewide, top 32%, 286 students, 78% FRL); Rye Cove Intermediate (math 42% / reading 72%, grade B, #178 of 342 statewide, top 53%, 153 students, 78% FRL); Rye Cove High (math 57% / reading 72%, grade B-, #213 of 319 statewide, top 69%, 279 students, 76% FRL) — zoned schools average 77% FRL vs 48% district-wide (29 pts higher); higher-poverty schools than district average — tighter screening recommended.
- Market conditions: 35 active listings in the ZIP; 22 units permitted in Scott County in 2024 (0 in 5+ unit buildings).
Forward outlook
- In year one you build about $3k of equity ($657 loan paydown + $2k appreciation (2.4% local appreciation)).
- Scott County population projected at -24% by 2050 — secular population decline; favor cash flow + early exit over multi-decade hold.
- At projected returns (2.4% appreciation + 3.0% rent growth), your $27k cash investment doubles in ~5 years — after that, you're playing with house money.
Negotiation context
- It's been on market 58 days — a 3% lower offer ($92k) is reasonable based on typical stale-listing flexibility.
Risks & watch-outs
- Watch-outs: flood insurance adds $460/mo; built in 1930 — expect roof / HVAC / electrical / plumbing capex.
- Climate carrying-cost: in FEMA flood zone AE (mandatory federal flood insurance); major wildfire risk — expect insurance premiums to compound above CPI over the hold.
Questions for the listing agent
- It's been on market 58 days. Have you received any prior offers? Is the seller open to a 3% concession, seller financing, or rate buy-down credit?
- Built in 1930 — when were the roof, HVAC, electrical panel, plumbing, and water heater last replaced?
- What's the actual annual flood-insurance premium (NFIP or private), and is the property in a SFHA with mandatory coverage?
- Is there a deadline driving the sale (1031 exchange, divorce, estate, relocation)? That informs how much negotiation room exists.
- Schools are B-rated — typically a magnet for longer-tenancy family renters. What's the average tenant stay here, and is there a school-zone premium baked into asking?
- What's the average days-on-market for RENTAL listings here right now (not sales)? A rising rental-DOM trend means longer vacancies and softer asking-rent achievability than the comps imply.
- What's the recent tenant-quality profile in this submarket — average credit score on applications, eviction rate, late-payment / NSF rate, and stable-employment percentage? A property-management company in the area should have these aggregated.
- How much new for-sale + rental construction is in the pipeline within 1–3 miles? Heavy new supply typically softens prices + rents 12–24 months out; constrained supply supports both.
Investment metrics
- 1% rule
- 1.68% ✓
- Cap rate
- 15.21%
- Cash-on-cash
- 31.86%
- DSCR
- 2.42
- GRM
- 4.9
CMA / ARV
- ARV (median comp)
- $163,068
- List price
- $95,000
- Delta
- -41.74%
- Verdict
- UNDERPRICED
- Comps
- 2 within 1.0 mi
Projected returns pro-forma
2.39% appreciation · 3.0% rent growth · sell at horizon
- IRR
- 16.6%
- Equity multiple
- 1.91×
- Total profit
- $24,323
- Equity at exit
- $39,494
- IRR
- 18.7%
- Equity multiple
- 3.59×
- Total profit
- $68,855
- Equity at exit
- $58,469
Cash invested: $26,600 (down + closing). Projections, not guarantees.
Landlord ↔ Tenant lean methodology
- Overall (STATE)
- 55 Moderately Landlord-Leaning
- State Virginia
- 55 Moderately Landlord-Leaning · D+2
- County
- — inherits STATE
- City
- — inherits STATE
ZIP-level market 24244
- Home prices YoY
- 1.3%
- Active inventory
- 35
- Price-to-rent
- 4.9×
Monthly cashflow live
- Estimated rent
- $1,600 medium interval (Pro) →
- Mortgage (P&I)
- −$498
- Tax from tax record
- −$20 /mo · $243/yr
- Insurance
- −$40
- Flood insurance flood zone
- −$460 /mo · $5,525/yr
- HOA
- −$0
- Vacancy / Maint / Mgmt
- −$336
- Net cashflow
- $246
Break-even live
Sensitivity live
| Price | -10% $300 | -5% $273 | +0% $246 | +5% $219 | +10% $192 |
|---|---|---|---|---|---|
| Rent | -10% $119 | -5% $183 | +0% $246 | +5% $309 | +10% $372 |
| Rate | -1.0pp $294 | -0.5pp $270 | base $246 | +0.5pp $221 | +1.0pp $196 |
UW: 25.0% down · 7.5% · 30yr · 1.5% tax · 5.0% vac · 8.0% maint · 8.0% mgmt
Financing live
Cash to close
- Down payment
- $23,750
- Closing costs
- $2,850
- Reserves months
- —
- Total cash needed
- —
Loan-product check · same deal, 3 products live
Conventional
25% down · 7.5% · 30yr
- Down + closing
- —
- Monthly P&I
- —
- Monthly cashflow
- —
- DSCR
- —
- Eligible?
- —
Personal DTI + credit; lowest rate.
DSCR
20% down · 8.5% · 30yr
- Down + closing
- —
- Monthly P&I
- —
- Monthly cashflow
- —
- DSCR
- —
- Eligible?
- —
No personal income docs; deal must DSCR.
Hard money
10% down · 12.0% · 12mo
- Down + closing
- —
- Monthly P&I
- —
- Monthly cashflow
- —
- DSCR
- —
- Eligible?
- —
Short-term bridge; refi at stabilization.
Listing history 18 events
-
2026-06-21days on market $95,000 Active 58 DOM
-
2026-06-21days on market $95,000 Active 57 DOM
-
2026-06-18days on market $95,000 Active 55 DOM
-
2026-06-17days on market $95,000 Active 54 DOM
-
2026-06-16days on market $95,000 Active 53 DOM
-
2026-06-15days on market $95,000 Active 52 DOM
-
2026-06-15days on market $95,000 Active 51 DOM
-
2026-06-13days on market $95,000 Active 50 DOM
-
2026-06-12days on market $95,000 Active 49 DOM
-
2026-06-09days on market $95,000 Active 46 DOM
-
2026-06-08days on market $95,000 Active 45 DOM
-
2026-06-08days on market $95,000 Active 44 DOM
-
2026-06-07days on market $95,000 Active 43 DOM
-
2026-06-03days on market $95,000 Active 40 DOM
-
2026-06-02days on market $95,000 Active 39 DOM
-
2026-06-01days on market $95,000 Active 38 DOM
-
2026-05-31days on market $95,000 Active 37 DOM
-
2026-04-23$95,000 Active 938-char remark
ⓘ Source: listings_history table (triggers on properties + properties_extension) + one-shot
backfill from property_details.listing_events for pre-trigger history.
Tax reassessment forecast VA · Resets to sale price
- Current annual tax
- $243 · $20/mo
- Projected year-2 tax
- $779 · $65/mo
- Expected delta
- +$536/yr (+$45/mo · 220.2%)
ⓘ Screening estimate from a state-policy table — verify with the county assessor before closing.
Climate risk First Street
- Flood 10/10 Extreme FEMA zone AE · 99% chance over 30 yrs
- Wildfire 6/10 Major
- Heat 4/10 Moderate 7 d/yr ≥98°F today · 22 d/yr by 30 yrs out
- Wind 2/10 Low
- Air quality 2/10 Low 1 unhealthy d/yr today · 1 by 30 yrs out
Nearby sold comps map
Loading sold comps map…
Walkable amenities ~0.75 mi
Loading nearby amenities…
Taxation est. · year 1
- Rental income
- $19,206
- − Mortgage interest
- −$5,321
- − Property taxes
- −$243
- − Insurance
- −$6,000
- − Repairs & maintenance
- −$1,536
- − Management
- −$1,536
- − Depreciation
- −$2,764
- Taxable income
- $1,804
- Est. tax owed @ 24.0%
- −$433
- After-tax cash flow
- $2,518/yr
For passive investors: Depreciation is non-cash, so a rental often shows a tax loss while cash-flowing — sheltering income. Rental losses are passive: they offset passive income freely, and up to $25,000/yr can offset ordinary (W-2) income if you actively participate and your MAGI is under $100k (phasing out to $0 by $150k); unused losses carry forward. On sale, claimed depreciation is recaptured at up to 25%, and gains may owe capital-gains tax (a 1031 exchange can defer both). Figures are a year-1 estimate at your 24.0% rate — not tax advice; consult a CPA.
Schools (NCES district)
- District
- Scott County Public School District
- NCES district ID
- 5103480
- Math proficiency
- 66% ▼ -26.00%
- Reading proficiency
- 73% ▼ -12.00%
- Median HH income
- $36,567
- Composite
- 57.65/100
- National rank
- #1061
- State rank
- #33 of 131 in VA
Livability — Clinchport
- Score
- 45/100
- State rank
- #566
- US rank
- #26657
Category grades
Schools grade is shown separately in the Schools card above.
Census & demographics
- Census place
- Clinchport, VA
- Population (ZIP)
- 5,531
Population outlook (Scott County) Hauer SSP2
- Today (2025)
- 20,405 people
- By 2030
- 19,379 · -5.0%
- By 2040
- 17,325 · -15.1%
- By 2050
- 15,464 · -24.2%
- By 2075
- 11,845 · -42.0%
- By 2100
- 8,516 · -58.3%
Race, ethnicity, and origin ACS 2023
- Neighborhood character
- Predominantly White (96%)
- Race & ethnicity
- White 96% Black 2% Two or more races 2% Hispanic / Latino 1%
- Common ancestry
- Italian 1% Serbian 1%
- Foreign-born
- 0%
- Languages at home
- 99% English-only · Spanish 1%
Political lean MEDSL · Scott
- 2024 margin
- Solid R (+70.4) · D 14.5% · R 84.9%
- 2008→2024 swing
- -27.3pp toward R · 2008: -43.1pp · 2024: -70.4pp
- All cycles
- 2024: R+70.4 2020: R+67.8 2016: R+66.3 2012: R+50.6 2008: R+43.1
Not yet ingested
- Civics
- —
Market trends
- HPI YoY
- ▲ 2.39%
- Current HPI
- 192.6919
- Rent YoY
- —
- Metro
- —
- State GDP YoY
- ▲ 2.40%
- F500 in state
- 50
Industry mix (Fortune 500 HQ in VA)
| Industry | F500 HQs | Revenue |
|---|---|---|
| Aerospace / Defense | 4 | $236B |
|
||
| Technology / Defense | 3 | $32B |
|
||
| Financial Services | 2 | $176B |
|
||
| Utilities | 2 | $27B |
|
||
| Insurance | 2 | $25B |
|
||
| Technology | 2 | $15B |
|
||
Price history
1 event — show timeline
- 2026-04-23 Listed $95,000 TVRMLS
Property tax history
+8.2%/yrLatest (2025): $243 · +0.0% YoY. Source: county tax records.
Cash-flow waterfall
monthlySold comps — $/sqft
last 12 mo · ≤1 miLoading sold comps…