 8-Plex
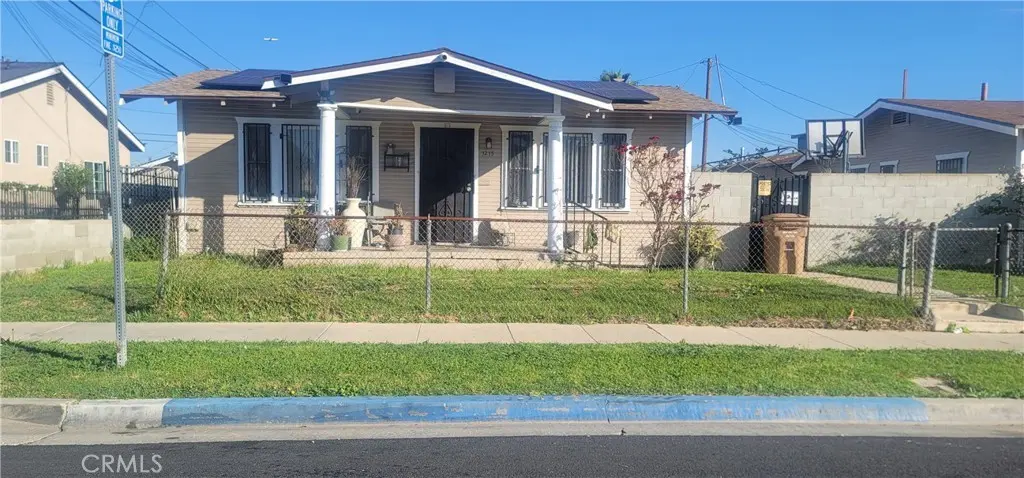
1211 W 105th St · Westmont, CA
Flood risk 1/10 · Minimal
- FEMA flood zone
- X (unshaded)
- Chance of flooding over 30 yrs
- 0.0%
- Est. flood insurance / yr
- $507 – $1,088
Fire risk 1/10 · Minimal
- Est. fire insurance / yr
- $659 – $1,223
Heat risk 5/10 · Moderate
- Hot days now (above 87°F)
- 7 days/yr
- Hot days in 30 yrs
- 22 days/yr
Wind risk 1/10 · Minimal
- Chance of severe wind over 30 yrs
- —
Air-quality risk 5/10 · Moderate
- Unhealthy air days now
- 7 days/yr
- Unhealthy air days in 30 yrs
- 7 days/yr
Risk factors via First Street. Map © Google.
Why this score? — see what drove the B- grade
The composite is a weighted blend of 9 inputs, each scored 0–100. Each bar is that input's sub-score; the figure is the points it added to the 100-point composite (weight × sub-score).
- Cash flow +30.0/30.0
- 1% rule +10.0/10.0
- DSCR +10.0/10.0
- ARV discount +7.5/15.0
- Schools +3.6/10.0
- Livability +3.0/5.0
- Condition / age +2.5/5.0
- Rent growth +1.9/5.0
- Appreciation +0.0/10.0
$950,000
🖨 Deal sheet 📄 Offer letter ✓ Due diligence
Multi-family units
County records classify this as Multi-Family (2-4 Unit). Listing-text estimate: 8 units. estimate disagrees with records
Listing remarks
Three-unit property located next to the Inglewood corridor. Three separate homes on one lot with 2 lot numbers that can be divided. An investor's dream with a large 14,672 square feet. Separate the lot and build more units. The property has solar panels that are paid on 1215 W 105th Street. Lot space for a Additional Dwelling Unit. The property is in average condition with a good location next to the (105) Glen Anderson Freeway, the (110) Harbor Freeway, and close to the Sofi and Clippers stadium, hotels, shopping, pubic transportation, public utilities, schools, and parks.
Key facts
- Solar panels
- Close to shopping
- 0.34 acre lot
Tags
Property features AI
Finance
- Other: Total building area reported as 3,282 (unit of measure unspecified in this section); Additional parcels: Lot 29 and 30
- Financial info: Tenant pays gas, water, and electricity
- HOA & community: Rent control applies
Exterior
- Parking: Garage (3 spaces); Carport (2 spaces); Total of 5 parking spaces; Access via city streets with alley access
- Security: Window bars; Smoke detector
- Utilities: Public sewer; District/public water; Natural gas connected; Electricity available and connected; Electric features include 220V in garage, kitchen, laundry and throughout; Separate water, gas, and electric meters for each unit (3 each)
- Home design: Single-story property; Three separate buildings; Three total units; No ADU
- Construction: Drywall walls
- Exterior features: Asphalt roof; Brick wall fencing; Corner lot; Rectangular lot shape; Near public transit; Street lighting; Storm drains; Alley paved access; No pool
Interior
- Kitchen: Garbage disposal; Central water heater
- Bedrooms: Total of 8 bedrooms across the property (multi-unit)
- Flooring: Vinyl; Carpet
- Bathrooms: Total of 4 full bathrooms across the property
- Heating & cooling: Wall heaters
- Interior features: One-level entry via front door; Window bars; Smoke detector; Raised foundation; No common walls
- Laundry & utility: Washer hookup; Gas dryer hookup; 220V supply available in laundry
Neighborhood map
What this means for you Summary
Snapshot
- This is a 8 × 1-bed/?-bath units multifamily listed at $950k.
Deal economics
- At list price, monthly cash flow is $6k ($74k/yr) — positive. Per door: $776/mo.
- The deal already cash-flows at list — no discount required.
- Meets the 1% rule at list price ($15k rent vs $950k).
- Cap rate 14.1% vs local median 3.6% in Westmont — top-decile yield for the area; either an underpriced asset or a hidden risk that comps aren't pricing in. Stress-test before assuming the spread holds.
Location & tenants
- Location reads 59/100 on livability (#625 in CA) — a working-class tenant base; expect higher turnover. Strengths: schools A+, commute A+, housing B; Watch: crime F, amenities F, employment D-.
- Los Angeles Unified (urban): math 29% / reading 54% proficiency, ranked #223 of 517 in CA (top 43%) — families likely to look elsewhere, expect single-tenant / working-renter base with shorter leases; 67% free/reduced lunch — lower-income household profile, screen leases tightly.
- Market conditions: Rents soft (-2.5%/yr); 172 active listings in the ZIP; 40 comparable units currently listed for rent nearby; rentals at typical pace (median 25d on market — plan ~3-4 weeks tenant-placement turnaround); 48% of comp listings sitting > 30 days — soft ceiling on asking rent; 19,697 units permitted in Los Angeles County in 2024 (9,426 in 5+ unit buildings).
- At $15,325/mo this rent would consume 345% of the median local household income ($53k/yr) (locally 7490% of renters already pay >50% of income on rent) — very limited rent-growth headroom before tenants either downsize or default.
Forward outlook
- Local home prices are declining (-3.0%/yr); year-one equity from $7k of loan paydown is wiped out by about $28k of value loss. Plan a longer hold.
- Los Angeles County population projected at +9% by 2050 — modest demand growth; plan on rents tracking national, not racing it.
- At projected returns (-3.0% appreciation + 0.0% rent growth), your $266k cash investment doubles in ~5 years — after that, you're playing with house money.
Negotiation context
- Only 13 days on market — expect competitive offers; lowballing is unlikely to land.
- 2 sale attempts since 2y ago with the ask held roughly flat each time — persistent listings suggest the price (not the market) is what's stuck; bring a comps-based counter.
- Current owner paid $203k; list at $950k implies a 368% gain — meaningful room to come down on a strong offer.
Risks & watch-outs
- Watch-outs: built in 1937 — expect roof / HVAC / electrical / plumbing capex.
- Climate carrying-cost: extreme-heat days projected 7→22/yr by 2055 (HVAC capex compounding) — expect insurance premiums to compound above CPI over the hold.
Questions for the listing agent
- Can we see the unit-by-unit rent roll, current vacancy, and any below-market leases? What's the average tenancy length?
- What capital expenditures (roof, boiler, parking lot, exteriors) have been made in the last 5 years, and what's planned in the next 2?
- Built in 1937 — when were the roof, HVAC, electrical panel, plumbing, and water heater last replaced?
- Is there a deadline driving the sale (1031 exchange, divorce, estate, relocation)? That informs how much negotiation room exists.
- Schools are A-rated — typically a magnet for longer-tenancy family renters. What's the average tenant stay here, and is there a school-zone premium baked into asking?
- Crime grade is F in this area — have there been break-ins, vandalism, or insurance claims at this property in the last 3 years? What carrier currently insures it and at what premium?
- What's the average days-on-market for RENTAL listings here right now (not sales)? A rising rental-DOM trend means longer vacancies and softer asking-rent achievability than the comps imply.
- What's the recent tenant-quality profile in this submarket — average credit score on applications, eviction rate, late-payment / NSF rate, and stable-employment percentage? A property-management company in the area should have these aggregated.
- How much new apartment / multifamily construction is in the pipeline within 1–3 miles? Heavy new supply (>2% of stock underway) typically softens rents 12–24 months out; light construction supports rent growth.
Investment metrics
- 1% rule
- 1.61% ✓
- Cap rate
- 14.13%
- Cash-on-cash
- 27.99%
- DSCR
- 2.25
- GRM
- 5.2
CMA / ARV
No comps found within radius.
Projected returns pro-forma
-3.0% appreciation · 0.0% rent growth · sell at horizon
- IRR
- 18.9%
- Equity multiple
- 1.74×
- Total profit
- $196,156
- Equity at exit
- $141,648
- IRR
- 25.2%
- Equity multiple
- 2.90×
- Total profit
- $505,390
- Equity at exit
- $82,139
Cash invested: $266,000 (down + closing). Projections, not guarantees.
Landlord ↔ Tenant lean methodology
- Overall (STATE)
- 18 Strongly Tenant-Friendly
- State California
- 18 Strongly Tenant-Friendly · D+13
- County
- — inherits STATE
- City
- — inherits STATE
ZIP-level market 90044
- Rents YoY
- -2.5%
- Active inventory
- 172
- Price-to-rent
- 41.3×
Monthly cashflow live
- Estimated rent
- $15,325 high interval (Pro) →
- Mortgage (P&I)
- −$4,982
- Tax from tax record
- −$524 /mo · $6,291/yr
- Insurance
- −$396
- HOA
- −$0
- Vacancy / Maint / Mgmt
- −$3,218
- Net cashflow
- $6,205
Break-even live
8-unit breakdown (identical units grouped — click to expand)
| Units | Beds | Baths | Est. rent |
|---|---|---|---|
| 8× units | 1 | — | $15,328 |
| #1 | 1 | — | $1,916 |
| #2 | 1 | — | $1,916 |
| #3 | 1 | — | $1,916 |
| #4 | 1 | — | $1,916 |
| #5 | 1 | — | $1,916 |
| #6 | 1 | — | $1,916 |
| #7 | 1 | — | $1,916 |
| #8 | 1 | — | $1,916 |
| Total (8 units) | $15,325 | ||
UW: 25.0% down · 7.5% · 30yr · 1.5% tax · 5.0% vac · 8.0% maint · 8.0% mgmt
Financing live
Cash to close
- Down payment
- $237,500
- Closing costs
- $28,500
- Reserves months
- —
- Total cash needed
- —
Loan-product check · same deal, 3 products live
Conventional
25% down · 7.5% · 30yr
- Down + closing
- —
- Monthly P&I
- —
- Monthly cashflow
- —
- DSCR
- —
- Eligible?
- —
Personal DTI + credit; lowest rate.
DSCR
20% down · 8.5% · 30yr
- Down + closing
- —
- Monthly P&I
- —
- Monthly cashflow
- —
- DSCR
- —
- Eligible?
- —
No personal income docs; deal must DSCR.
Hard money
10% down · 12.0% · 12mo
- Down + closing
- —
- Monthly P&I
- —
- Monthly cashflow
- —
- DSCR
- —
- Eligible?
- —
Short-term bridge; refi at stabilization.
Rent comps 40 comps
| Address | Beds | Baths | Sqft | Rent | $/sqft | DOM | Units | Dist |
|---|---|---|---|---|---|---|---|---|
| 1153 W 106th St Unit 04 Los Angeles, CA | 1.0 | 1.0 | 550 | $1,800 | $3.27 | 43d | 1 | 0.09mi |
| 10623 S Budlong Ave Los Angeles, CA | 2.0 | 1.0 | 700 | $2,095 | $2.99 | 3d | 2 | 0.12mi |
| 1303 W 107th St Los Angeles, CA | 2.0 | 1.0 | 952 | $1,945 | $2.04 | 3d | 1 | 0.15mi |
| 1212 W 107th St Unit 22 Los Angeles, CA | 1.0 | 1.0 | 675 | $1,595 | $2.36 | 43d | 1 | 0.17mi |
| 1043 W 107th St Unit 1 Los Angeles, CA | 2.0 | 1.0 | 800 | $2,200 | $2.75 | 7d | 1 | 0.24mi |
| 1037 W 108th St Apt 5 Los Angeles, CA | 2.0 | 1.0 | 870 | $2,100 | $2.41 | 24d | 1 | 0.28mi |
| 1451 W 105th St Unit 6 Los Angeles, CA | 2.0 | 1.5 | 1095 | $2,200 | $2.01 | 22d | 1 | 0.30mi |
| 1336 W 109th St Los Angeles, CA | 2.0 | 1.0 | 580 | $2,200 | $3.79 | 43d | 1 | 0.31mi |
| 1451 W 105th St Los Angeles, CA | 2.0 | 2.0 | 900 | $2,197 | $2.44 | 43d | 1 | 0.31mi |
| 1451 W 105th St Unit 2 Los Angeles, CA | 2.0 | 1.0 | 900 | $2,197 | $2.44 | 43d | 1 | 0.31mi |
| 1031 W 102nd St Apt 1 Los Angeles, CA | 3.0 | 2.0 | 1080 | $2,950 | $2.73 | 22d | 1 | 0.32mi |
| 10514 1/4 S Vermont Ave Los Angeles, CA | 1.0 | 1.0 | 650 | $1,695 | $2.61 | 7d | 1 | 0.33mi |
| 10514 1/4 S Vermont Ave Los Angeles, CA | 3.0 | 2.0 | 1025 | $3,495 | $3.41 | 43d | 1 | 0.33mi |
| 10516 1/2 S Vermont Ave Los Angeles, CA | 2.0 | 1.0 | 850 | $2,095 | $2.46 | 43d | 1 | 0.34mi |
| 1515 W 103rd St Apt 9 Los Angeles, CA | 2.0 | 2.0 | 1000 | $2,250 | $2.25 | 43d | 1 | 0.38mi |
| 1458 W 101st St Los Angeles, CA | 2.0 | 2.0 | 1000 | $2,150 | $2.15 | 43d | 1 | 0.40mi |
| 1543 W 105th St Unit C Los Angeles, CA | 1.0 | 1.0 | 635 | $1,850 | $2.91 | 43d | 1 | 0.40mi |
| 1125 1/2 W 111th St Los Angeles, CA | 1.0 | 1.0 | 625 | $1,650 | $2.64 | 24d | 1 | 0.44mi |
| 1535 W 102nd St Unit 06 Los Angeles, CA | 2.0 | 1.0 | 625 | $1,895 | $3.03 | 43d | 1 | 0.44mi |
| 1127 W 111th St Los Angeles, CA | 2.0 | 1.0 | 800 | $2,095 | $2.62 | 24d | 1 | 0.45mi |
| 11100 Normandie Ave Unit 3/4 Los Angeles, CA | 2.0 | 1.0 | 750 | $2,100 | $2.80 | 24d | 1 | 0.46mi |
| 745 W 106th St Los Angeles, CA | 2.0 | 1.0 | 804 | $3,000 | $3.73 | 43d | 1 | 0.48mi |
| 817 W 101st St Los Angeles, CA | 2.0 | 1.0 | 638 | $2,100 | $3.29 | 43d | 1 | 0.48mi |
| 11106 S Normandie Ave Los Angeles, CA | 2.0 | 1.0 | 692 | $2,061 | $2.98 | 43d | 1 | 0.49mi |
| 1317 W 97th St Unit 1 Los Angeles, CA | 1.0 | 1.0 | 750 | $1,750 | $2.33 | 16d | 1 | 0.49mi |
| 11134 S New Hampshire Ave Unit 10 Los Angeles, CA | 1.0 | 1.0 | 750 | $1,625 | $2.17 | 24d | 1 | 0.56mi |
| 11134 S New Hampshire Ave Los Angeles, CA | 1.0 | 1.0 | 750 | $1,625 | $2.17 | 43d | 1 | 0.56mi |
| 1073 W 112th St Los Angeles, CA | 3.0 | 2.0 | 800 | $3,200 | $4.00 | 43d | 1 | 0.58mi |
| 1377 W 112th St Unit 8 Los Angeles, CA | 1.0 | 1.0 | 650 | $1,900 | $2.92 | 43d | 1 | 0.58mi |
| 1731 W 107th St Unit 1733 01 Los Angeles, CA | 1.0 | 1.0 | 622 | $2,000 | $3.22 | 43d | 1 | 0.64mi |
| 1033 W 95th St Los Angeles, CA | 1.0 | 1.0 | 646 | $1,595 | $2.47 | 24d | 1 | 0.65mi |
| 9449 Normandie Ave Unit 2 Los Angeles, CA | 1.0 | 1.0 | 535 | $1,595 | $2.98 | 2d | 1 | 0.67mi |
| 1122 W 94th St Unit 3 Los Angeles, CA | 2.0 | 1.0 | 800 | $2,400 | $3.00 | 24d | 1 | 0.68mi |
| 1110 W 94th St Unit 2 Los Angeles, CA | 2.0 | 1.0 | 880 | $2,550 | $2.90 | 43d | 1 | 0.69mi |
| 9417 Normandie Ave Los Angeles, CA | 1.0 | 1.0 | 550 | $1,595 | $2.90 | 2d | 1 | 0.69mi |
| 1327 W 94th St Unit 2 Los Angeles, CA | 2.0 | 1.0 | 910 | $2,900 | $3.19 | 24d | 1 | 0.71mi |
| 1719 W 110th St Los Angeles, CA | 3.0 | 1.0 | 1036 | $4,000 | $3.86 | 24d | 1 | 0.71mi |
| 550 W 106th St Unit 550 Los Angeles, CA | 1.0 | 1.0 | 572 | $1,650 | $2.88 | 4d | 1 | 0.72mi |
| 1107 1/2 W 94th St Los Angeles, CA | 2.0 | 1.0 | 800 | $1,845 | $2.31 | 3d | 1 | 0.73mi |
| 607 W 101st St Los Angeles, CA | 2.0 | 1.0 | 995 | $2,800 | $2.81 | 24d | 1 | 0.73mi |
Listing history 9 events
-
2026-06-18days on market $950,000 Active 13 DOM
-
2026-06-17days on market $950,000 Active 12 DOM
-
2026-06-16days on market $950,000 Active 11 DOM
-
2026-06-15days on market $950,000 Active 10 DOM
-
2026-06-13days on market $950,000 Active 8 DOM
-
2026-06-09days on market $950,000 Active 4 DOM
-
2026-06-08days on market $950,000 Active 3 DOM
-
2026-06-07remarks 580-char remark
-
2026-06-07$950,000 Active 2 DOM
ⓘ Source: listings_history table (triggers on properties + properties_extension) + one-shot
backfill from property_details.listing_events for pre-trigger history.
Tax reassessment forecast CA · Resets to sale price
- Current annual tax
- $6,291 · $524/mo
- Projected year-2 tax
- $7,220 · $602/mo
- Expected delta
- +$929/yr (+$77/mo · 14.8%)
ⓘ Screening estimate from a state-policy table — verify with the county assessor before closing.
Climate risk First Street
- Flood 1/10 Low FEMA zone X (unshaded) · 0% chance over 30 yrs
- Wildfire 1/10 Low
- Heat 5/10 Major 7 d/yr ≥87°F today · 22 d/yr by 30 yrs out
- Wind 1/10 Low
- Air quality 5/10 Major 7 unhealthy d/yr today · 7 by 30 yrs out
Nearby sold comps map
Loading sold comps map…
Walkable amenities ~0.75 mi
Loading nearby amenities…
Taxation est. · year 1
- Rental income
- $183,900
- − Mortgage interest
- −$53,215
- − Property taxes
- −$6,291
- − Insurance
- −$4,750
- − Repairs & maintenance
- −$14,712
- − Management
- −$14,712
- − Depreciation
- −$27,636
- Taxable income
- $62,584
- Est. tax owed @ 24.0%
- −$15,020
- After-tax cash flow
- $59,437/yr
For passive investors: Depreciation is non-cash, so a rental often shows a tax loss while cash-flowing — sheltering income. Rental losses are passive: they offset passive income freely, and up to $25,000/yr can offset ordinary (W-2) income if you actively participate and your MAGI is under $100k (phasing out to $0 by $150k); unused losses carry forward. On sale, claimed depreciation is recaptured at up to 25%, and gains may owe capital-gains tax (a 1031 exchange can defer both). Figures are a year-1 estimate at your 24.0% rate — not tax advice; consult a CPA.
Schools (NCES district)
- District
- Los Angeles Unified
- NCES district ID
- 0622710
- Math proficiency
- 29% ▼ -4.00%
- Reading proficiency
- 54% ▲ 10.00%
- Median HH income
- $50,403
- Composite
- 35.67/100
- National rank
- #4875
- State rank
- #223 of 517 in CA
Livability — Westmont
- Score
- 59/100
- State rank
- #625
- US rank
- #19861
Category grades
Schools grade is shown separately in the Schools card above.
Census & demographics
- Census place
- Westmont, CA
- County
- Los Angeles County · 9,444,647 people
- City population
- 95,859
- Metro
- Los Angeles-Long Beach-Anaheim, CA
- Population (ZIP)
- 94,830
- Household income
- $53,302
- Rent vs Own
- Severe rent burden
- 7490.0
Population outlook (Los Angeles County) Hauer SSP2
- Today (2025)
- 10,940,515 people
- By 2030
- 11,256,481 · +2.9%
- By 2040
- 11,729,929 · +7.2%
- By 2050
- 11,948,407 · +9.2%
- By 2075
- 11,818,114 · +8.0%
- By 2100
- 10,842,928 · -0.9%
Race, ethnicity, and origin ACS 2023
- Neighborhood character
- Predominantly Hispanic (67%)
- Race & ethnicity
- Hispanic / Latino 67% Black 29% Two or more races 23% White 1% Native American 1%
- Hispanic origin (detail)
- Mexican 39%
- Foreign-born
- 34% · Canada
- Languages at home
- 37% English-only · Spanish 62%
Political lean MEDSL · Los Angeles
- 2024 margin
- Solid D (+32.9) · D 64.8% · R 31.9% · Other 3.3%
- 2008→2024 swing
- -7.4pp toward R · 2008: 40.4pp · 2024: 32.9pp
- All cycles
- 2024: D+32.9 2020: D+44.2 2016: D+48.0 2012: D+40.0 2008: D+40.4
Not yet ingested
- Civics
- —
Market trends
- HPI YoY
- ▼ -691.99%
- Current HPI
- 467.9845
- Rent YoY
- ▼ -2.50%
- Metro
- Los Angeles-Long Beach-Anaheim, CA
- State GDP YoY
- ▲ 3.21%
- F500 in state
- 116
Industry mix (Fortune 500 HQ in CA)
| Industry | F500 HQs | Revenue |
|---|---|---|
| Technology | 27 | $1,492B |
|
||
| Financial Services | 3 | $174B |
|
||
| Retail | 3 | $44B |
|
||
| Insurance | 3 | $26B |
|
||
| Media / Entertainment | 2 | $115B |
|
||
| Pharmaceuticals / Biotech | 2 | $62B |
|
||
Price history
+2467.6% since first listed6 events — show timeline
- 2026-06-05 Listed $950,000 CRMLS
- 2024-03-29 Contingent — TheMLS
- 2024-03-29 Price Changed — TheMLS
- 2024-03-08 Listed — TheMLS
- 1999-10-29 Sold (Public Records) $203,000 Public Records
- 1975-08-11 Sold (Public Records) $37,000 Public Records
Property tax history
+2.5%/yrLatest (2025): $6,291 · +9.1% YoY. Source: county tax records.
Cash-flow waterfall
monthlySold comps — $/sqft
last 12 mo · ≤1 miLoading sold comps…