 Fourplex
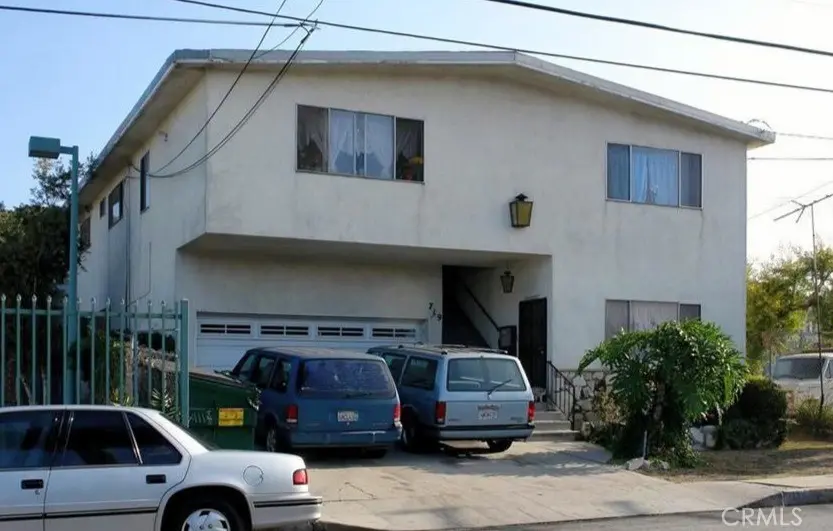
719 E 65th · Inglewood, CA
Flood risk 1/10 · Minimal
- FEMA flood zone
- X (unshaded)
- Chance of flooding over 30 yrs
- 0.0%
- Est. flood insurance / yr
- $507 – $1,088
Fire risk 1/10 · Minimal
- Est. fire insurance / yr
- $659 – $1,223
Heat risk 5/10 · Moderate
- Hot days now (above 86°F)
- 7 days/yr
- Hot days in 30 yrs
- 20 days/yr
Wind risk 1/10 · Minimal
- Chance of severe wind over 30 yrs
- —
Air-quality risk 5/10 · Moderate
- Unhealthy air days now
- 7 days/yr
- Unhealthy air days in 30 yrs
- 7 days/yr
Risk factors via First Street. Map © Google.
Why this score? — see what drove the D- grade
The composite is a weighted blend of 9 inputs, each scored 0–100. Each bar is that input's sub-score; the figure is the points it added to the 100-point composite (weight × sub-score).
- Cash flow +13.5/30.0
- ARV discount +9.5/15.0
- DSCR +4.1/10.0
- 1% rule +3.8/10.0
- Livability +3.2/5.0
- Rent growth +2.2/5.0
- Schools +1.8/10.0
- Condition / age +1.0/5.0
- Appreciation +0.0/10.0
$1,299,000
🖨 Deal sheet 📄 Offer letter ✓ Due diligence
Multi-family units
County records classify this as Multi-Family (2-4 Unit). Listing-text estimate: 4 units. confirmed
Listing remarks MLS
This property is suited for the investor to trade up from 2 or 3 unit to 4 units in north Inglewood. First floor has 4 bedroom 5 baths unit with attached garage. Other three unit are 2 bedrooms 2 baths each upstairs, with attached garages in the rear. Property streches from 65th to Hyde Park Blvd and is north of SoFi Stadium. Now is the chance to invest for your future.
Key facts
- 5,894 sq ft lot
- 6 garage spots
- Built 1966
Property features AI
Finance
- Other: Lot features indicate 2–5 units per acre
- Financial info: Total building area: 5,137; Gross scheduled/gross operating/gross income: $82,752; Net operating income: $56,539; Laundry income: $1,500; Total operating expenses: $26,212 (includes insurance $9,037, taxes $16,875, gardener $2,400, licenses $300); Property is subject to rent control; Current actual rents listed for three units: $1,100; $1,122; $1,149
Exterior
- Parking: Total of 6 parking spaces; Individual garages: one unit has a 2-car attached garage; three units each have 1-car garage
- Utilities: Public sewer; District/public water; 1 separate water meter; 5 separate gas meters; 4 separate electric meters
- Home design: Attached multi-unit property; 2 total stories; 2+ common walls
- Construction: Single building (1 building); Year built source: Assessor
- Exterior features: No pool; Street lighting in the neighborhood
Interior
- Kitchen: No appliance details provided
- Bedrooms: One 4-bedroom unit (main level mentioned); Three 2-bedroom units
- Bathrooms: Units include 1 to 2 full bathrooms
- Interior features: Two levels; Entry on main level
- Laundry & utility: On-site community laundry; Tenants pay gas and electricity
Neighborhood map
What this means for you Summary
Snapshot
- This is a 4 × 2-bed/1.8-bath units multifamily listed at $1.30M. Condition is rated poor.
Deal economics
- At list price, monthly cash flow is $49 ($584/yr) — positive. Per door: $12/mo.
- The deal already cash-flows at list — no discount required.
- To meet the 1% rule (rent ≥ 1% of price), the offer needs to be $1.14M (12.0% below list).
- Recommended offer: $1.14M (12.0% below list) — sets the bar for 1% rule.
- Cap rate 6.3% vs local median 2.6% in Inglewood — top-decile yield for the area; either an underpriced asset or a hidden risk that comps aren't pricing in. Stress-test before assuming the spread holds.
Location & tenants
- Location reads 64/100 on livability (#431 in CA) — a middle-class / working-renter tenant base. Strengths: commute A+, housing B; Watch: health & safety C-, schools D, crime F.
- Inglewood Unified (suburban): math 14% / reading 27% proficiency, ranked #457 of 517 in CA (top 88%) — low school quality limits family demand, transient renter base, plan for 1-2y turnover; 74% free/reduced lunch — lower-income household profile, screen leases tightly.
- Market conditions: Rents soft (-1.1%/yr); 80 active listings in the ZIP; 19,697 units permitted in Los Angeles County in 2024 (9,426 in 5+ unit buildings).
- At $11,425/mo this rent would consume 186% of the median local household income ($74k/yr) (locally 2145% of renters already pay >50% of income on rent) — very limited rent-growth headroom before tenants either downsize or default.
Forward outlook
- Local home prices are declining (-3.0%/yr); year-one equity from $9k of loan paydown is wiped out by about $39k of value loss. Plan a longer hold.
- Los Angeles County population projected at +9% by 2050 — modest demand growth; plan on rents tracking national, not racing it.
Negotiation context
- It's been on market 55 days — a 3% lower offer ($1.26M) is reasonable based on typical stale-listing flexibility.
- 2 sale attempts since 4y ago with the ask held roughly flat each time — persistent listings suggest the price (not the market) is what's stuck; bring a comps-based counter.
Risks & watch-outs
- Climate carrying-cost: extreme-heat days projected 7→20/yr by 2055 (HVAC capex compounding) — expect insurance premiums to compound above CPI over the hold.
Questions for the listing agent
- It's been on market 55 days. Have you received any prior offers? Is the seller open to a 12% concession, seller financing, or rate buy-down credit?
- Can we see the unit-by-unit rent roll, current vacancy, and any below-market leases? What's the average tenancy length?
- What capital expenditures (roof, boiler, parking lot, exteriors) have been made in the last 5 years, and what's planned in the next 2?
- Have any recent inspections been done? Can we get a copy of the seller's disclosures and any deferred-maintenance estimates?
- Built in 1966 — when were the roof, HVAC, electrical panel, plumbing, and water heater last replaced?
- Is there a deadline driving the sale (1031 exchange, divorce, estate, relocation)? That informs how much negotiation room exists.
- Schools are D-rated, which usually means shorter tenancies and higher turnover. Who's the typical renter profile here, and what's been the actual vacancy rate?
- Crime grade is F in this area — have there been break-ins, vandalism, or insurance claims at this property in the last 3 years? What carrier currently insures it and at what premium?
- The area grade is low — what's the realistic commute time and amenity access for the typical tenant pool here? Any planned neighborhood developments (good or bad) we should know about?
- What's the average days-on-market for RENTAL listings here right now (not sales)? A rising rental-DOM trend means longer vacancies and softer asking-rent achievability than the comps imply.
- What's the recent tenant-quality profile in this submarket — average credit score on applications, eviction rate, late-payment / NSF rate, and stable-employment percentage? A property-management company in the area should have these aggregated.
- How much new apartment / multifamily construction is in the pipeline within 1–3 miles? Heavy new supply (>2% of stock underway) typically softens rents 12–24 months out; light construction supports rent growth.
Investment metrics
- 1% rule
- 0.88% ✗
- Cap rate
- 6.34%
- Cash-on-cash
- 0.16%
- DSCR
- 1.01
- GRM
- 9.5
CMA / ARV
- ARV (median comp)
- $1,359,551
- List price
- $1,299,000
- Delta
- -4.45%
- Verdict
- FAIR
- Comps
- 20 within 1.0 mi
Show comp detail 1 sale within ~0.75 mi
| Address | Dist | Beds/Ba | Sqft | Sold | Price | $/sf | Match |
|---|---|---|---|---|---|---|---|
| 4479 W 61st St | 0.74mi | 8/8.0 | 4,510 (-12%) | 8mo | $1,375,000 | $305 | 35 |
Match score weights: distance 35% · size 25% · config 20% · recency 20%. Top-matched comps best support the ARV.
Projected returns pro-forma
-3.0% appreciation · 0.0% rent growth · sell at horizon
- IRR
- -19.5%
- Equity multiple
- 0.34×
- Total profit
- $-240,705
- Equity at exit
- $193,685
- IRR
- -20.2%
- Equity multiple
- 0.08×
- Total profit
- $-334,307
- Equity at exit
- $112,314
Cash invested: $363,720 (down + closing). Projections, not guarantees.
Landlord ↔ Tenant lean methodology
- Overall (STATE)
- 18 Strongly Tenant-Friendly
- State California
- 18 Strongly Tenant-Friendly · D+13
- County
- — inherits STATE
- City
- — inherits STATE
ZIP-level market 90302
- Rents YoY
- -1.1%
- Active inventory
- 80
- Price-to-rent
- 37.9×
Monthly cashflow live
- Estimated rent
- $11,425 high interval (Pro) →
- Mortgage (P&I)
- −$6,812
- Tax est. 1.5%
- −$1,624 /mo · $19,485/yr
- Insurance
- −$541
- HOA
- −$0
- Vacancy / Maint / Mgmt
- −$2,399
- Net cashflow
- $49
Break-even live
4-unit breakdown (identical units grouped — click to expand)
| Units | Beds | Baths | Est. rent |
|---|---|---|---|
| 4× units | 2 | 1.8 | $11,424 |
| #1 | 2 | 1.8 | $2,856 |
| #2 | 2 | 1.8 | $2,856 |
| #3 | 2 | 1.8 | $2,856 |
| #4 | 2 | 1.8 | $2,856 |
| Total (4 units) | $11,425 | ||
UW: 25.0% down · 7.5% · 30yr · 1.5% tax · 5.0% vac · 8.0% maint · 8.0% mgmt
Financing live
Cash to close
- Down payment
- $324,750
- Closing costs
- $38,970
- Reserves months
- —
- Total cash needed
- —
Loan-product check · same deal, 3 products live
Conventional
25% down · 7.5% · 30yr
- Down + closing
- —
- Monthly P&I
- —
- Monthly cashflow
- —
- DSCR
- —
- Eligible?
- —
Personal DTI + credit; lowest rate.
DSCR
20% down · 8.5% · 30yr
- Down + closing
- —
- Monthly P&I
- —
- Monthly cashflow
- —
- DSCR
- —
- Eligible?
- —
No personal income docs; deal must DSCR.
Hard money
10% down · 12.0% · 12mo
- Down + closing
- —
- Monthly P&I
- —
- Monthly cashflow
- —
- DSCR
- —
- Eligible?
- —
Short-term bridge; refi at stabilization.
Listing history 20 events
-
2026-06-18days on market $1,299,000 Active 55 DOM
-
2026-06-17days on market $1,299,000 Active 54 DOM
-
2026-06-16days on market $1,299,000 Active 53 DOM
-
2026-06-15days on market $1,299,000 Active 52 DOM
-
2026-06-13days on market $1,299,000 Active 50 DOM
-
2026-06-13days on market $1,299,000 Active 49 DOM
-
2026-06-09days on market $1,299,000 Active 46 DOM
-
2026-06-08days on market $1,299,000 Active 45 DOM
-
2026-06-07days on market $1,299,000 Active 44 DOM
-
2026-06-04days on market $1,299,000 Active 41 DOM
-
2026-06-03days on market $1,299,000 Active 40 DOM
-
2026-06-02days on market $1,299,000 Active 39 DOM
-
2026-06-01days on market $1,299,000 Active 38 DOM
-
2026-05-31days on market $1,299,000 Active 37 DOM
-
2026-05-19price $1,299,000 800-char remark
-
2026-04-24$1,350,000 Active 800-char remark
-
2023-07-17soldstatus $1,200,000 Closed Sale 372-char remark
Show marketing remark (372 chars)
This property is suited for the investor to trade up from 2 or 3 unit to 4 units in north Inglewood. First floor has 4 bedroom 5 baths unit with attached garage. Other three unit are 2 bedrooms 2 baths each upstairs, with attached garages in the rear. Property streches from 65th to Hyde Park Blvd and is north of SoFi Stadium. Now is the chance to invest for your future.
-
2023-06-01status Pending Sale 372-char remark
Show marketing remark (372 chars)
This property is suited for the investor to trade up from 2 or 3 unit to 4 units in north Inglewood. First floor has 4 bedroom 5 baths unit with attached garage. Other three unit are 2 bedrooms 2 baths each upstairs, with attached garages in the rear. Property streches from 65th to Hyde Park Blvd and is north of SoFi Stadium. Now is the chance to invest for your future.
-
2023-02-19price $1,250,000 372-char remark
Show marketing remark (372 chars)
This property is suited for the investor to trade up from 2 or 3 unit to 4 units in north Inglewood. First floor has 4 bedroom 5 baths unit with attached garage. Other three unit are 2 bedrooms 2 baths each upstairs, with attached garages in the rear. Property streches from 65th to Hyde Park Blvd and is north of SoFi Stadium. Now is the chance to invest for your future.
-
2022-11-08$1,300,000 Active 372-char remark
Show marketing remark (372 chars)
This property is suited for the investor to trade up from 2 or 3 unit to 4 units in north Inglewood. First floor has 4 bedroom 5 baths unit with attached garage. Other three unit are 2 bedrooms 2 baths each upstairs, with attached garages in the rear. Property streches from 65th to Hyde Park Blvd and is north of SoFi Stadium. Now is the chance to invest for your future.
ⓘ Source: listings_history table (triggers on properties + properties_extension) + one-shot
backfill from property_details.listing_events for pre-trigger history.
Climate risk First Street
- Flood 1/10 Low FEMA zone X (unshaded) · 0% chance over 30 yrs
- Wildfire 1/10 Low
- Heat 5/10 Major 7 d/yr ≥86°F today · 20 d/yr by 30 yrs out
- Wind 1/10 Low
- Air quality 5/10 Major 7 unhealthy d/yr today · 7 by 30 yrs out
Nearby sold comps map
Loading sold comps map…
Walkable amenities ~0.75 mi
Loading nearby amenities…
Taxation est. · year 1
- Rental income
- $137,100
- − Mortgage interest
- −$72,764
- − Property taxes
- −$19,485
- − Insurance
- −$6,495
- − Repairs & maintenance
- −$10,968
- − Management
- −$10,968
- − Depreciation
- −$37,789
- Taxable loss
- −$21,369
- Est. tax savings @ 24.0%
- +$5,129
- After-tax cash flow
- $5,712/yr
For passive investors: Depreciation is non-cash, so a rental often shows a tax loss while cash-flowing — sheltering income. Rental losses are passive: they offset passive income freely, and up to $25,000/yr can offset ordinary (W-2) income if you actively participate and your MAGI is under $100k (phasing out to $0 by $150k); unused losses carry forward. On sale, claimed depreciation is recaptured at up to 25%, and gains may owe capital-gains tax (a 1031 exchange can defer both). Figures are a year-1 estimate at your 24.0% rate — not tax advice; consult a CPA.
Condition & rehab AI · 6 photos
This 4-unit property in Inglewood requires extensive repairs and updates to improve its condition and value. Immediate focus should be on the roof, exterior siding, and landscaping to enhance both resale and rental potential.
Repairs flagged
- Major roof — Significant wear and tear
- Major exterior siding — Worn and peeling
- Major interior walls/paint — No photos, but likely in poor condition
- Major windows — No photos, but likely in poor condition
- Major HVAC/mechanicals — No photos, but likely in poor condition
- Major landscaping — Overgrown and unkempt
Value-add opportunities
- Both repair roof — Fixing the roof would improve both resale and rental value
- Both repair exterior siding — Updating the exterior would enhance curb appeal and value
- Both paint interior walls and paint exterior — Fresh paint would improve the home's appearance and value
- Both repair windows — New windows would improve energy efficiency and curb appeal
- Both update HVAC — A new HVAC system would improve comfort and energy efficiency
- Both landscape — A well-maintained landscape would improve curb appeal and value
Renovation cost estimate screening
| Repair item | Severity | Est. cost |
|---|---|---|
| roof · Significant wear and tear | Major | $15,000–50,000 |
| exterior siding · Worn and peeling | Major | $15,000–50,000 |
| interior walls/paint · No photos, but likely in poor condition | Major | $15,000–50,000 |
| windows · No photos, but likely in poor condition | Major | $15,000–50,000 |
| HVAC/mechanicals · No photos, but likely in poor condition | Major | $15,000–50,000 |
| landscaping · Overgrown and unkempt | Major | $15,000–50,000 |
| Total estimated repair cost · 6 items | $90,000–300,000 |
Value-add ROI direction
- Both repair roof — Fixing the roof would improve both resale and rental value ↑
- Both repair exterior siding — Updating the exterior would enhance curb appeal and value ↑
- Both paint interior walls and paint exterior — Fresh paint would improve the home's appearance and value ↑
- Both repair windows — New windows would improve energy efficiency and curb appeal ↑
- Both update HVAC — A new HVAC system would improve comfort and energy efficiency ↑
- Both landscape — A well-maintained landscape would improve curb appeal and value ↑
ⓘ Cost ranges are severity-bucket heuristics (US national rule-of-thumb). Get contractor quotes + a written scope before underwriting a rehab budget.
Schools (NCES district)
- District
- Inglewood Unified
- NCES district ID
- 0618390
- Math proficiency
- 14% ▼ -5.00%
- Reading proficiency
- 27% ▼ -3.00%
- Median HH income
- $46,746
- Composite
- 17.97/100
- National rank
- #8987
- State rank
- #457 of 517 in CA
Livability — Inglewood
- Score
- 64/100
- State rank
- #431
- US rank
- #14599
Category grades
Schools grade is shown separately in the Schools card above.
Census & demographics
- Census place
- Inglewood, CA
- County
- Los Angeles County · 9,444,647 people
- City population
- 127,928
- Metro
- Los Angeles-Long Beach-Anaheim, CA
- Population (ZIP)
- 29,003
- Household income
- $73,777
- Rent vs Own
- Severe rent burden
- 2145.0
Population outlook (Los Angeles County) Hauer SSP2
- Today (2025)
- 10,940,515 people
- By 2030
- 11,256,481 · +2.9%
- By 2040
- 11,729,929 · +7.2%
- By 2050
- 11,948,407 · +9.2%
- By 2075
- 11,818,114 · +8.0%
- By 2100
- 10,842,928 · -0.9%
Race, ethnicity, and origin ACS 2023
- Neighborhood character
- Diverse neighborhood (Simpson 0.64)
- Race & ethnicity
- Hispanic / Latino 42% Black 42% Two or more races 15% White 9% Asian 2%
- Hispanic origin (detail)
- Mexican 29%
- Common ancestry
- British 2% Lithuanian 1%
- Foreign-born
- 26% · Canada
- Languages at home
- 57% English-only · Spanish 37% Other Indo-European 1%
Political lean MEDSL · Los Angeles
- 2024 margin
- Solid D (+32.9) · D 64.8% · R 31.9% · Other 3.3%
- 2008→2024 swing
- -7.4pp toward R · 2008: 40.4pp · 2024: 32.9pp
- All cycles
- 2024: D+32.9 2020: D+44.2 2016: D+48.0 2012: D+40.0 2008: D+40.4
Not yet ingested
- Civics
- —
Market trends
- HPI YoY
- ▼ -627.76%
- Current HPI
- 518.5404
- Rent YoY
- ▼ -1.07%
- Metro
- Los Angeles-Long Beach-Anaheim, CA
- State GDP YoY
- ▲ 3.21%
- F500 in state
- 116
Industry mix (Fortune 500 HQ in CA)
| Industry | F500 HQs | Revenue |
|---|---|---|
| Technology | 27 | $1,492B |
|
||
| Financial Services | 3 | $174B |
|
||
| Retail | 3 | $44B |
|
||
| Insurance | 3 | $26B |
|
||
| Media / Entertainment | 2 | $115B |
|
||
| Pharmaceuticals / Biotech | 2 | $62B |
|
||
Price history
-0.1% since first listed6 events — show timeline
- 2026-05-19 Price Changed $1,299,000 CRMLS
- 2026-04-24 Listed $1,350,000 CRMLS
- 2023-07-17 Sold (MLS) $1,200,000 CRMLS
- 2023-06-01 Pending — CRMLS
- 2023-02-19 Price Changed $1,250,000 CRMLS
- 2022-11-08 Listed $1,300,000 CRMLS
Cash-flow waterfall
monthlySold comps — $/sqft
last 12 mo · ≤1 miLoading sold comps…