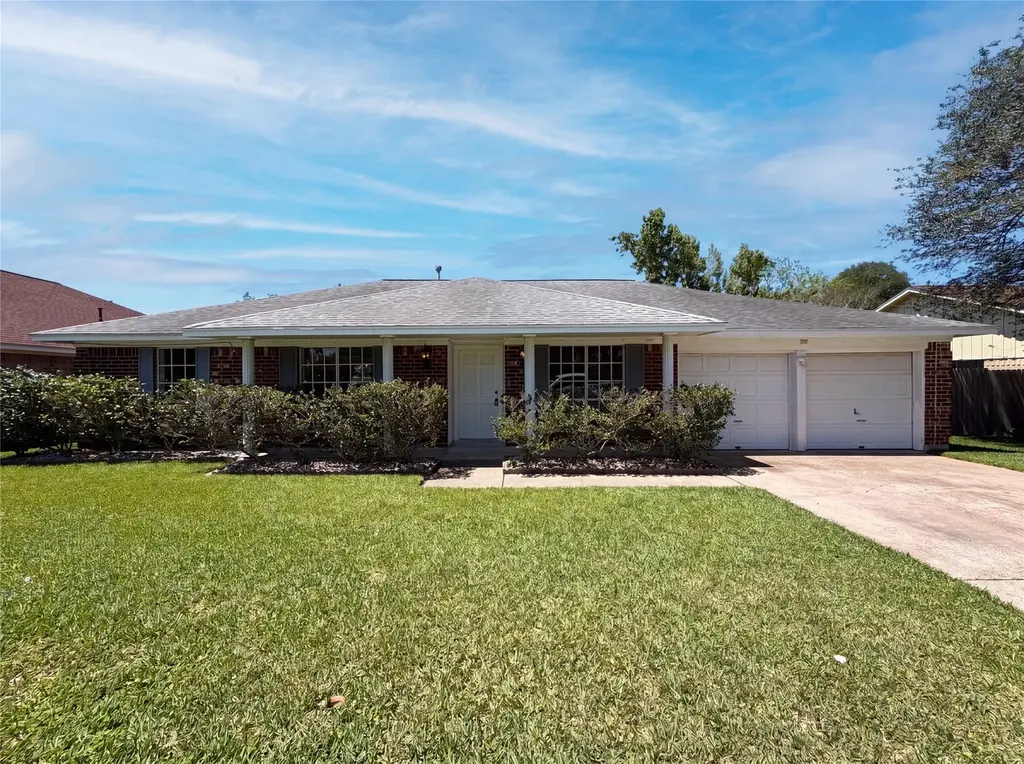
12614 A Bar Dr · Santa Fe, TX
Flood risk 6/10 · Moderate
- FEMA flood zone
- X (unshaded)
- Chance of flooding over 30 yrs
- 0.73%
- Est. flood insurance / yr
- $507 – $1,088
Fire risk 2/10 · Minimal
- Est. fire insurance / yr
- $1,222 – $2,270
Heat risk 10/10 · Severe
- Hot days now (above 110°F)
- 7 days/yr
- Hot days in 30 yrs
- 26 days/yr
Wind risk 9/10 · Severe
- Chance of severe wind over 30 yrs
- 99.0%
Air-quality risk 2/10 · Minimal
- Unhealthy air days now
- 1 days/yr
- Unhealthy air days in 30 yrs
- 1 days/yr
Risk factors via First Street. Map © Google.
Why this score? — see what drove the D+ grade
The composite is a weighted blend of 9 inputs, each scored 0–100. Each bar is that input's sub-score; the figure is the points it added to the 100-point composite (weight × sub-score).
- Cash flow +15.0/30.0
- ARV discount +8.6/15.0
- 1% rule +5.0/10.0
- DSCR +5.0/10.0
- Schools +3.5/10.0
- Livability +3.4/5.0
- Rent growth +2.5/5.0
- Condition / age +2.5/5.0
- Appreciation +0.0/10.0
$245,000
🖨 Deal sheet 📄 Offer letter ✓ Due diligence
Listing remarks
Imagine 12614 A Bar Dr, recently updated with fresh interior paint and partial flooring replacement throughout. The kitchen now features new appliances including all stainless steel units, complemented by an accent backsplash. Exterior enjoyment is enhanced by a patio and a fully fenced in backyard. This home perfectly blends modern updates with practical outdoor living. Included 100-Day Home Warranty with buyer activation
Key facts
- New appliances
- Patio
- Accent backsplash
Tags
Property features AI
Exterior
- Parking: Attached 2-car garage
- Security: Owned security system
- Utilities: Public water; Public sewer
- Home design: Residential property; Single-story entry (all main rooms listed on first floor)
- Construction: Brick construction; Built in 1980; Composition roof; Slab foundation
- Exterior features: Lot includes other features
Interior
- Kitchen: Dishwasher; Microwave
- Bedrooms: Primary bedroom on the first floor (approx. 14 x 13); Bedroom on the first floor (approx. 12 x 11); Bedroom on the first floor (approx. 10 x 11)
- Flooring: Carpet; Plank; Tile; Vinyl
- Bathrooms: 2 full bathrooms
- Heating & cooling: Central heating (gas); Central electric air conditioning
- Interior features: Security system (owned); No fireplaces
Neighborhood map
What this means for you Summary
Snapshot
- This is a 3-bed/2.0-bath single-family listed at $245k.
Deal economics
- At list price, monthly cash flow is $38k ($451k/yr) — positive.
- The deal already cash-flows at list — no discount required.
- Meets the 1% rule at list price ($50k rent vs $245k).
- Recommended offer: $238k (3.0% below list) — sets the bar for market timing.
- Cap rate 190.3% vs local median 4.5% in Santa Fe — top-decile yield for the area; either an underpriced asset or a hidden risk that comps aren't pricing in. Stress-test before assuming the spread holds.
Location & tenants
- Location reads 67/100 on livability (#550 in TX) — a middle-class / working-renter tenant base. Strengths: crime A+, cost of living A+, housing A+; Watch: amenities F, commute F, health & safety F.
- Santa Fe ISD (suburban): math 38% / reading 39% proficiency, ranked #385 of 826 in TX (top 47%) — families likely to look elsewhere, expect single-tenant / working-renter base with shorter leases.
- Zoned schools: William F Barnett El (math 59% / reading 46%, grade C-, #720 of 4,322 statewide, top 17%, 646 students, 59% FRL); Santa Fe H S (math 19% / reading 34%, grade F, #1,228 of 1,632 statewide, top 76%, 1,369 students, 47% FRL) — zoned schools average 53% FRL vs 35% district-wide (18 pts higher); higher-poverty schools than district average — tighter screening recommended.
- Market conditions: 233 active listings in the ZIP; 3 comparable units currently listed for rent nearby; rentals lingering (median 44d on market — plan ~5-8 weeks vacancy on turnover, expect pricing pressure); 67% of comp listings sitting > 30 days — soft ceiling on asking rent; 3,258 units permitted in Galveston County in 2024 (0 in 5+ unit buildings).
Forward outlook
- Local home prices are declining (-3.0%/yr); year-one equity from $2k of loan paydown is wiped out by about $7k of value loss. Plan a longer hold.
- Galveston County population projected at +43% by 2050 — long-run rental-demand tailwind backs the buy-and-hold thesis.
- At projected returns (-3.0% appreciation + 3.0% rent growth), your $69k cash investment doubles in ~1 year — after that, you're playing with house money.
Negotiation context
- It's been on market 44 days — a 3% lower offer ($238k) is reasonable based on typical stale-listing flexibility.
Risks & watch-outs
- Climate carrying-cost: major flood risk; severe wind risk, 99% chance of damaging wind over 30y; extreme-heat days projected 7→26/yr by 2055 (HVAC capex compounding) — expect insurance premiums to compound above CPI over the hold.
Questions for the listing agent
- It's been on market 44 days. Have you received any prior offers? Is the seller open to a 3% concession, seller financing, or rate buy-down credit?
- Is there a deadline driving the sale (1031 exchange, divorce, estate, relocation)? That informs how much negotiation room exists.
- The area grade is low — what's the realistic commute time and amenity access for the typical tenant pool here? Any planned neighborhood developments (good or bad) we should know about?
- What's the average days-on-market for RENTAL listings here right now (not sales)? A rising rental-DOM trend means longer vacancies and softer asking-rent achievability than the comps imply.
- What's the recent tenant-quality profile in this submarket — average credit score on applications, eviction rate, late-payment / NSF rate, and stable-employment percentage? A property-management company in the area should have these aggregated.
- How much new for-sale + rental construction is in the pipeline within 1–3 miles? Heavy new supply typically softens prices + rents 12–24 months out; constrained supply supports both.
Investment metrics
- 1% rule
- 20.33% ✓
- Cap rate
- 190.35%
- Cash-on-cash
- 657.33%
- DSCR
- 30.25
- GRM
- 0.4
CMA / ARV
- ARV (median comp)
- $250,981
- List price
- $245,000
- Delta
- -2.38%
- Verdict
- FAIR
- Comps
- 20 within 1.0 mi
Show comp detail 12 sales within ~0.75 mi
| Address | Dist | Beds/Ba | Sqft | Sold | Price | $/sf | Match |
|---|---|---|---|---|---|---|---|
| 4310 A Bar Dr | 0.05mi | 3/2.0 | 1,622 (+6%) | 3mo | $240,000 | $148 | 86 |
| 12423 A Bar Dr | 0.15mi | 3/2.0 | 1,443 (-6%) | 1mo | $269,000 | $186 | 82 |
| 12626 Langford St | 0.29mi | 3/2.0 | 1,536 (+0%) | 7mo | $250,000 | $163 | 80 |
| 4406 B Bar Dr | 0.17mi | 3/2.5 | 1,435 (-6%) | 1mo | $250,000 | $174 | 78 |
| 4028 Avenue O | 0.33mi | 4/2.0 (+1) | 1,476 (-4%) | 0mo | $225,000 | $152 | 74 |
| 4433 Avenue L | 0.52mi | 3/2.0 | 1,500 (-2%) | 10mo | $289,900 | $193 | 64 |
| 4132 Avenue Q 1/2 | 0.69mi | 3/2.0 | 1,500 (-2%) | 1mo | $359,999 | $240 | 63 |
| 4002 Avenue Q 1/2 | 0.70mi | 3/2.0 | 1,528 (-0%) | 14mo | $319,000 | $209 | 55 |
| 13118 Preston Dr | 0.54mi | 3/2.0 | 1,426 (-7%) | 10mo | $275,000 | $193 | 55 |
| 4311 Avenue J | 0.75mi | 3/2.0 | 1,562 (+2%) | 15mo | $297,000 | $190 | 50 |
| 13242 9th St | 0.67mi | 2/2.0 (-1) | 1,313 (-14%) | 5mo | $220,000 | $168 | 36 |
| 13241 8th St | 0.66mi | 4/1.5 (+1) | 1,318 (-14%) | 8mo | $110,000 | $83 | 32 |
Match score weights: distance 35% · size 25% · config 20% · recency 20%. Top-matched comps best support the ARV.
Projected returns pro-forma
-3.0% appreciation · 3.0% rent growth · sell at horizon
- IRR
- —
- Equity multiple
- 35.32×
- Total profit
- $2,354,429
- Equity at exit
- $36,530
- IRR
- —
- Equity multiple
- 75.86×
- Total profit
- $5,135,243
- Equity at exit
- $21,183
Cash invested: $68,600 (down + closing). Projections, not guarantees.
Landlord ↔ Tenant lean methodology
- Overall (STATE)
- 87 Strongly Landlord-Friendly
- State Texas
- 87 Strongly Landlord-Friendly · R+5
- County
- — inherits STATE
- City
- — inherits STATE
ZIP-level market 77510
- Home prices YoY
- -15.3%
- Active inventory
- 233
- Price-to-rent
- 0.4×
Monthly cashflow live
- Estimated rent
- $49,812 medium interval (Pro) →
- Mortgage (P&I)
- −$1,285
- Tax from tax record
- −$387 /mo · $4,641/yr
- Insurance
- −$102
- HOA
- −$0
- Vacancy / Maint / Mgmt
- −$10,460
- Net cashflow
- $37,577
Break-even live
UW: 25.0% down · 7.5% · 30yr · 1.5% tax · 5.0% vac · 8.0% maint · 8.0% mgmt
Financing live
Cash to close
- Down payment
- $61,250
- Closing costs
- $7,350
- Reserves months
- —
- Total cash needed
- —
Loan-product check · same deal, 3 products live
Conventional
25% down · 7.5% · 30yr
- Down + closing
- —
- Monthly P&I
- —
- Monthly cashflow
- —
- DSCR
- —
- Eligible?
- —
Personal DTI + credit; lowest rate.
DSCR
20% down · 8.5% · 30yr
- Down + closing
- —
- Monthly P&I
- —
- Monthly cashflow
- —
- DSCR
- —
- Eligible?
- —
No personal income docs; deal must DSCR.
Hard money
10% down · 12.0% · 12mo
- Down + closing
- —
- Monthly P&I
- —
- Monthly cashflow
- —
- DSCR
- —
- Eligible?
- —
Short-term bridge; refi at stabilization.
Rent comps 3 comps
| Address | Beds | Baths | Sqft | Rent | $/sqft | DOM | Units | Dist |
|---|---|---|---|---|---|---|---|---|
| 4120 Avenue O #10 Santa Fe, TX | 3.0 | 2.0 | 1280 | $74,621 | $58.30 | 44d | 1 | 0.26mi |
| 11844 13th St Santa Fe, TX | 3.0 | 2.0 | 1472 | $1,750 | $1.19 | 22d | 1 | 0.90mi |
| 13342 Pecan Trails Dr Santa Fe, TX | 4.0 | 3.0 | 2150 | $2,700 | $1.26 | 44d | 1 | 1.12mi |
Listing history 16 events
-
2026-06-18days on market $245,000 Active 44 DOM
-
2026-06-17days on market $245,000 Active 43 DOM
-
2026-06-16days on market $245,000 Active 42 DOM
-
2026-06-15days on market $245,000 Active 41 DOM
-
2026-06-13pricedays on market $245,000 Active 39 DOM
-
2026-06-09days on market $250,000 Active 35 DOM
-
2026-06-08days on market $250,000 Active 34 DOM
-
2026-06-07days on market $250,000 Active 33 DOM
-
2026-06-04days on market $250,000 Active 30 DOM
-
2026-06-03days on market $250,000 Active 29 DOM
-
2026-06-02days on market $250,000 Active 28 DOM
-
2026-06-01days on market $250,000 Active 27 DOM
-
2026-05-31days on market $250,000 Active 26 DOM
-
2026-05-14price $255,000 426-char remark
-
2026-05-05$260,000 Active 426-char remark
-
2026-04-24soldstatus
ⓘ Source: listings_history table (triggers on properties + properties_extension) + one-shot
backfill from property_details.listing_events for pre-trigger history.
Tax reassessment forecast TX · Resets to sale price
- Current annual tax
- $4,641 · $387/mo
- Projected year-2 tax
- $4,641 · $387/mo
- Expected delta
- $0/yr ($0/mo · 0.0%)
ⓘ Screening estimate from a state-policy table — verify with the county assessor before closing.
Climate risk First Street
- Flood 6/10 Major FEMA zone X (unshaded) · 73% chance over 30 yrs
- Wildfire 2/10 Low
- Heat 10/10 Extreme 7 d/yr ≥110°F today · 26 d/yr by 30 yrs out
- Wind 9/10 Extreme 99% chance of damaging wind over 30 yrs
- Air quality 2/10 Low 1 unhealthy d/yr today · 1 by 30 yrs out
Nearby sold comps map
Loading sold comps map…
Walkable amenities ~0.75 mi
Loading nearby amenities…
Taxation est. · year 1
- Rental income
- $597,738
- − Mortgage interest
- −$13,724
- − Property taxes
- −$4,641
- − Insurance
- −$1,225
- − Repairs & maintenance
- −$47,819
- − Management
- −$47,819
- − Depreciation
- −$7,127
- Taxable income
- $475,383
- Est. tax owed @ 24.0%
- −$114,092
- After-tax cash flow
- $336,838/yr
For passive investors: Depreciation is non-cash, so a rental often shows a tax loss while cash-flowing — sheltering income. Rental losses are passive: they offset passive income freely, and up to $25,000/yr can offset ordinary (W-2) income if you actively participate and your MAGI is under $100k (phasing out to $0 by $150k); unused losses carry forward. On sale, claimed depreciation is recaptured at up to 25%, and gains may owe capital-gains tax (a 1031 exchange can defer both). Figures are a year-1 estimate at your 24.0% rate — not tax advice; consult a CPA.
Schools (NCES district)
- District
- Santa Fe ISD
- NCES district ID
- 4839270
- Math proficiency
- 38% ▼ -10.00%
- Reading proficiency
- 39% ▼ -2.00%
- Median HH income
- $66,769
- Composite
- 34.86/100
- National rank
- #5091
- State rank
- #385 of 826 in TX
Livability — Santa Fe
- Score
- 67/100
- State rank
- #550
- US rank
- #10637
Category grades
Schools grade is shown separately in the Schools card above.
Census & demographics
- Census place
- Santa Fe, TX
- Population (ZIP)
- 13,938
Population outlook (Galveston County) Hauer SSP2
- Today (2025)
- 390,640 people
- By 2030
- 425,226 · +8.9%
- By 2040
- 493,765 · +26.4%
- By 2050
- 559,698 · +43.3%
- By 2075
- 719,260 · +84.1%
- By 2100
- 819,628 · +109.8%
Race, ethnicity, and origin ACS 2023
- Neighborhood character
- Predominantly White (72%)
- Race & ethnicity
- White 72% Hispanic / Latino 21% Two or more races 17% Asian 2%
- Hispanic origin (detail)
- Mexican 14% Puerto Rican 3% Cuban 1%
- Common ancestry
- Lithuanian 4% Italian 3% Slovak 1%
- Foreign-born
- 5% · Canada
- Languages at home
- 89% English-only · Spanish 10% Tagalog/Filipino 1%
Political lean MEDSL · Galveston
- 2024 margin
- Strong R (+27.4) · D 35.7% · R 63.1% · Other 1.2%
- 2008→2024 swing
- -7.9pp toward R · 2008: -19.5pp · 2024: -27.4pp
- All cycles
- 2024: R+27.4 2020: R+22.6 2016: R+22.6 2012: R+26.9 2008: R+19.5
Not yet ingested
- Civics
- —
Market trends
- HPI YoY
- ▼ -54.15%
- Current HPI
- 299.2228
- Rent YoY
- —
- Metro
- —
- State GDP YoY
- ▲ 3.95%
- F500 in state
- 110
Industry mix (Fortune 500 HQ in TX)
| Industry | F500 HQs | Revenue |
|---|---|---|
| Energy | 16 | $1,198B |
|
||
| Technology | 5 | $198B |
|
||
| Engineering / Construction | 4 | $72B |
|
||
| Energy Services | 3 | $60B |
|
||
| Utilities | 3 | $41B |
|
||
| Healthcare | 2 | $330B |
|
||
Price history
-5.8% since first listed5 events — show timeline
- 2026-06-11 Price Changed $245,000 HARMLS
- 2026-05-28 Price Changed $250,000 HARMLS
- 2026-05-14 Price Changed $255,000 HARMLS
- 2026-05-05 Listed $260,000 HARMLS
- 2026-04-24 Sold (Public Records) — Public Records
Property tax history
+3.8%/yrLatest (2025): $4,641 · +7.0% YoY. Source: county tax records.
Cash-flow waterfall
monthlySold comps — $/sqft
last 12 mo · ≤1 miLoading sold comps…