585 Trailwoods Dr · Brownsville, KY
Flood risk 1/10 · Minimal
- FEMA flood zone
- X (unshaded)
- Chance of flooding over 30 yrs
- 0.0%
- Est. flood insurance / yr
- $507 – $1,088
Fire risk 3/10 · Minor
- Est. fire insurance / yr
- $839 – $1,559
Heat risk 4/10 · Minor
- Hot days now (above 107°F)
- 7 days/yr
- Hot days in 30 yrs
- 18 days/yr
Wind risk 2/10 · Minimal
- Chance of severe wind over 30 yrs
- 3.0%
Air-quality risk 2/10 · Minimal
- Unhealthy air days now
- 1 days/yr
- Unhealthy air days in 30 yrs
- 2 days/yr
Risk factors via First Street. Map © Google.
Why this score? — see what drove the D grade
The composite is a weighted blend of 9 inputs, each scored 0–100. Each bar is that input's sub-score; the figure is the points it added to the 100-point composite (weight × sub-score).
- Cash flow +12.9/30.0
- ARV discount +7.5/15.0
- DSCR +3.9/10.0
- Livability +3.3/5.0
- Appreciation +3.1/10.0
- Schools +2.8/10.0
- Rent growth +2.5/5.0
- Condition / age +2.5/5.0
- 1% rule +2.4/10.0
$169,000
🖨 Deal sheet (PDF) 📄 Offer letter ✓ Due diligence
Listing remarks
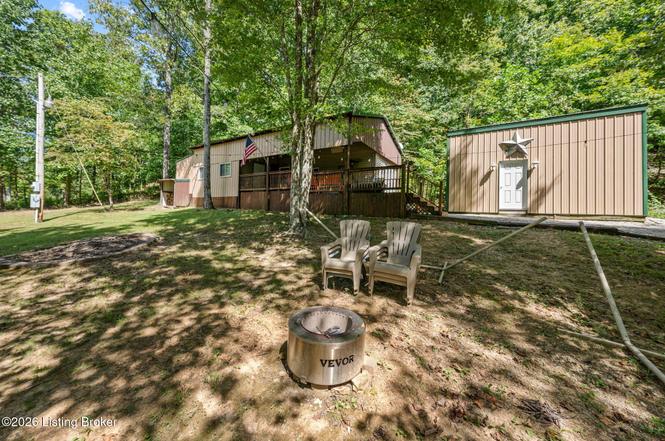
Cute and functional lake place in Ambassador Shores! This place is perfect for weekends with friends and family, or to use as a short-term rental for extra income. It's a 2 bedroom with an alcove for a third bed, with 2 full bathrooms, an open living and kitchen area, and a cool covered porch with lighting and tv hookup. Outside there is nearly 2 acres for space and privacy, as well as a 12x20 garage, and a dock down the street! The dock will transfer with COE approval.
Key facts
- Covered porch
- Short term rental
- Dock
Tags
Property features AI
Finance
- Other: Lot is approximately 1.9 acres, cleared and wooded; Property listed as residential — single family residence; Ranch architectural style; Rental allowed
- HOA & community: No association fee; Pets allowed subject to restrictions; Subdivision: Ambassador Shores
Exterior
- Parking: Detached garage (1 car); Driveway parking
- Utilities: Electricity connected
- Home design: Single-family ranch home; 1 story; Built in 2018
- Construction: Vinyl siding; Metal roof; Built in 2018
- Exterior features: Boat slip
Interior
- Kitchen: Kitchen (first floor)
- Bedrooms: 2 bedrooms (both on the first floor)
- Bathrooms: 2 full bathrooms
- Heating & cooling: Mini-split / ductless heating (electric); Wall/window cooling units
- Interior features: 5 total rooms; 2 closets; No basement; First-floor laundry
- Laundry & utility: Laundry on the first floor
Neighborhood map
What this means for you Summary
Snapshot
- This is a 2-bed/2.0-bath other listed at $169k.
Deal economics
- At list price, monthly cash flow is $-13 ($-155/yr) — negative.
- To cash-flow at today's rent, offer at most $167k (1.4% below list).
- To meet the 1% rule (rent ≥ 1% of price), the offer needs to be $125k (26.3% below list).
- Recommended offer: $125k (26.3% below list) — sets the bar for 1% rule.
- Cap rate 6.2% vs local median 3.2% in Brownsville — top-decile yield for the area; either an underpriced asset or a hidden risk that comps aren't pricing in. Stress-test before assuming the spread holds.
Location & tenants
- Location reads 66/100 on livability (#234 in KY) — a middle-class / working-renter tenant base. Strengths: crime A+, cost of living A+, housing A+; Watch: amenities F, commute F, employment F.
- Grayson County (rural): math 27% / reading 40% proficiency, ranked #84 of 165 in KY (top 51%) — families likely to look elsewhere, expect single-tenant / working-renter base with shorter leases.
- Zoned schools: Clarkson Elementary School (math 33% / reading 44%, grade F, #234 of 676 statewide, top 36%, 609 students, 65% FRL); Grayson County Middle School (math 23% / reading 38%, grade F, #143 of 217 statewide, top 67%, 839 students, 63% FRL); Grayson County High School (math 24% / reading 38%, grade F, #118 of 254 statewide, top 47%, 1,252 students, 61% FRL).
- Market conditions: 186 active listings in the ZIP; 23 units permitted in Grayson County in 2024 (12 in 5+ unit buildings).
Forward outlook
- Local home prices are declining (-3.0%/yr); year-one equity from $1k of loan paydown is wiped out by about $5k of value loss. Plan a longer hold.
Negotiation context
- It's been on market 107 days — a 9% lower offer ($154k) is reasonable based on typical stale-listing flexibility.
- 2 sale attempts with the ask held roughly flat each time — persistent listings suggest the price (not the market) is what's stuck; bring a comps-based counter.
Questions for the listing agent
- What do current leases actually rent for vs. the listed asking? Can we see a recent rent roll and the last 12 months of T-12 income?
- It's been on market 107 days. Have you received any prior offers? Is the seller open to a 26% concession, seller financing, or rate buy-down credit?
- Why hasn't it sold? Are there any deal-killer items the seller is aware of (foundation, flood, title, zoning, code violations)?
- Is there a deadline driving the sale (1031 exchange, divorce, estate, relocation)? That informs how much negotiation room exists.
- Schools are D-rated, which usually means shorter tenancies and higher turnover. Who's the typical renter profile here, and what's been the actual vacancy rate?
- The area grade is low — what's the realistic commute time and amenity access for the typical tenant pool here? Any planned neighborhood developments (good or bad) we should know about?
- What's the average days-on-market for RENTAL listings here right now (not sales)? A rising rental-DOM trend means longer vacancies and softer asking-rent achievability than the comps imply.
- What's the recent tenant-quality profile in this submarket — average credit score on applications, eviction rate, late-payment / NSF rate, and stable-employment percentage? A property-management company in the area should have these aggregated.
- How much new for-sale + rental construction is in the pipeline within 1–3 miles? Heavy new supply typically softens prices + rents 12–24 months out; constrained supply supports both.
Investment metrics
- 1% rule
- 0.74% ✗
- Cap rate
- 6.20%
- Cash-on-cash
- -0.33%
- DSCR
- 0.99
- GRM
- 11.3
CMA / ARV
No comps found within radius.
Projected returns pro-forma
-3.0% appreciation · 3.0% rent growth · sell at horizon
- IRR
- -16.9%
- Equity multiple
- 0.40×
- Total profit
- $-28,295
- Equity at exit
- $25,198
- IRR
- -8.9%
- Equity multiple
- 0.45×
- Total profit
- $-26,050
- Equity at exit
- $14,612
Cash invested: $47,320 (down + closing). Projections, not guarantees.
Landlord ↔ Tenant lean methodology
- Overall (STATE)
- 83 Strongly Landlord-Friendly
- State Kentucky
- 83 Strongly Landlord-Friendly · R+16
- County
- — inherits STATE
- City
- — inherits STATE
ZIP-level market 42754
- Home prices YoY
- -1.3%
- Active inventory
- 186
- Price-to-rent
- 11.3×
Monthly cashflow live
- Estimated rent
- $1,245 medium interval (Pro) →
- Mortgage (P&I)
- −$886
- Tax from tax record
- −$40 /mo · $478/yr
- Insurance
- −$70
- HOA
- −$0
- Vacancy / Maint / Mgmt
- −$261
- Net cashflow
- $-13
Break-even live
Sensitivity live
| Price | -10% $83 | -5% $35 | +0% $-13 | +5% $-61 | +10% $-109 |
|---|---|---|---|---|---|
| Rent | -10% $-111 | -5% $-62 | +0% $-13 | +5% $36 | +10% $85 |
| Rate | -1.0pp $72 | -0.5pp $30 | base $-13 | +0.5pp $-57 | +1.0pp $-101 |
UW: 25.0% down · 7.5% · 30yr · 1.5% tax · 5.0% vac · 8.0% maint · 8.0% mgmt
Financing live
Cash to close
- Down payment
- $42,250
- Closing costs
- $5,070
- Reserves months
- —
- Total cash needed
- —
Loan-product check · same deal, 3 products live
Conventional
25% down · 7.5% · 30yr
- Down + closing
- —
- Monthly P&I
- —
- Monthly cashflow
- —
- DSCR
- —
- Eligible?
- —
Personal DTI + credit; lowest rate.
DSCR
20% down · 8.5% · 30yr
- Down + closing
- —
- Monthly P&I
- —
- Monthly cashflow
- —
- DSCR
- —
- Eligible?
- —
No personal income docs; deal must DSCR.
Hard money
10% down · 12.0% · 12mo
- Down + closing
- —
- Monthly P&I
- —
- Monthly cashflow
- —
- DSCR
- —
- Eligible?
- —
Short-term bridge; refi at stabilization.
Listing history 23 events
-
2026-06-22days on market $169,000 Active 107 DOM
-
2026-06-21days on market $169,000 Active 106 DOM
-
2026-06-21days on market $169,000 Active 105 DOM
-
2026-06-18days on market $169,000 Active 103 DOM
-
2026-06-17days on market $169,000 Active 102 DOM
-
2026-06-16days on market $169,000 Active 101 DOM
-
2026-06-15days on market $169,000 Active 100 DOM
-
2026-06-13days on market $169,000 Active 98 DOM
-
2026-06-12days on market $169,000 Active 97 DOM
-
2026-06-09days on market $169,000 Active 94 DOM
-
2026-06-08days on market $169,000 Active 93 DOM
-
2026-06-07days on market $169,000 Active 92 DOM
-
2026-06-07days on market $169,000 Active 91 DOM
-
2026-06-04days on market $169,000 Active 88 DOM
-
2026-06-02days on market $169,000 Active 87 DOM
-
2026-06-01days on market $169,000 Active 86 DOM
-
2026-05-31days on market $169,000 Active 85 DOM
-
2026-05-31days on market $169,000 Active 84 DOM
-
2026-05-07price $169,000
-
2026-04-17price $172,500
-
2026-03-07$175,000 Active
-
2025-12-17historical
-
2025-08-30$179,500 Active
ⓘ Source: listings_history table (triggers on properties + properties_extension) + one-shot
backfill from property_details.listing_events for pre-trigger history.
Tax reassessment forecast KY · Resets to sale price
- Current annual tax
- $478 · $40/mo
- Projected year-2 tax
- $1,453 · $121/mo
- Expected delta
- +$975/yr (+$81/mo · 203.8%)
ⓘ Screening estimate from a state-policy table — verify with the county assessor before closing.
Climate risk First Street
- Flood 1/10 Low FEMA zone X (unshaded) · 0% chance over 30 yrs
- Wildfire 3/10 Moderate
- Heat 4/10 Moderate 7 d/yr ≥107°F today · 18 d/yr by 30 yrs out
- Wind 2/10 Low 3% chance of damaging wind over 30 yrs
- Air quality 2/10 Low 1 unhealthy d/yr today · 2 by 30 yrs out
Nearby sold comps map
Loading sold comps map…
Walkable amenities ~0.75 mi
Loading nearby amenities…
Taxation est. · year 1
- Rental income
- $14,941
- − Mortgage interest
- −$9,467
- − Property taxes
- −$478
- − Insurance
- −$845
- − Repairs & maintenance
- −$1,195
- − Management
- −$1,195
- − Depreciation
- −$4,916
- Taxable loss
- −$3,156
- Est. tax savings @ 24.0%
- +$757
- After-tax cash flow
- $602/yr
For passive investors: Depreciation is non-cash, so a rental often shows a tax loss while cash-flowing — sheltering income. Rental losses are passive: they offset passive income freely, and up to $25,000/yr can offset ordinary (W-2) income if you actively participate and your MAGI is under $100k (phasing out to $0 by $150k); unused losses carry forward. On sale, claimed depreciation is recaptured at up to 25%, and gains may owe capital-gains tax (a 1031 exchange can defer both). Figures are a year-1 estimate at your 24.0% rate — not tax advice; consult a CPA.
Schools (NCES district)
- District
- Grayson County
- NCES district ID
- 2102300
- Math proficiency
- 27% ▼ -23.00%
- Reading proficiency
- 40% ▼ -17.00%
- Median HH income
- $34,256
- Composite
- 27.55/100
- National rank
- #6944
- State rank
- #84 of 165 in KY
Livability — Brownsville
- Score
- 66/100
- State rank
- #234
- US rank
- #11426
Category grades
Schools grade is shown separately in the Schools card above.
Census & demographics
- Population (ZIP)
- 15,817
Population outlook (Grayson County) Hauer SSP2
- Today (2025)
- 26,840 people
- By 2030
- 27,032 · +0.7%
- By 2040
- 27,236 · +1.5%
- By 2050
- 27,076 · +0.9%
- By 2075
- 26,565 · -1.0%
- By 2100
- 24,007 · -10.6%
Race, ethnicity, and origin ACS 2023
- Neighborhood character
- Predominantly White (95%)
- Race & ethnicity
- White 95% Two or more races 3% Black 2%
- Common ancestry
- Slovak 4% Lithuanian 2% Romanian 1%
- Foreign-born
- 1%
- Languages at home
- 99% English-only · Spanish 1%
Political lean MEDSL · Grayson
- 2024 margin
- Solid R (+61.8) · D 18.5% · R 80.3% · Other 1.2%
- 2008→2024 swing
- -26.9pp toward R · 2008: -34.9pp · 2024: -61.8pp
- All cycles
- 2024: R+61.8 2020: R+58.8 2016: R+59.3 2012: R+39.5 2008: R+34.9
Not yet ingested
- Civics
- —
Market trends
- HPI YoY
- ▼ -3.82%
- Current HPI
- 283.0264
- Rent YoY
- —
- Metro
- —
- State GDP YoY
- ▲ 1.81%
- F500 in state
- 4
Industry mix (Fortune 500 HQ in KY)
| Industry | F500 HQs | Revenue |
|---|---|---|
| Healthcare | 1 | $118B |
|
||
| Food / Beverage | 1 | $7B |
|
||
Price history
-5.8% since first listed5 events — show timeline
- 2026-05-07 Price Changed $169,000 Metro Search MLS
- 2026-04-17 Price Changed $172,500 Metro Search MLS
- 2026-03-07 Listed $175,000 Metro Search MLS
- 2025-12-17 Listing Removed — Metro Search MLS
- 2025-08-30 Listed $179,500 Metro Search MLS
Property tax history
+23.0%/yrLatest (2024): $478 · -2.4% YoY. Source: county tax records.
Cash-flow waterfall
monthlySold comps — $/sqft
last 12 mo · ≤1 miLoading sold comps…