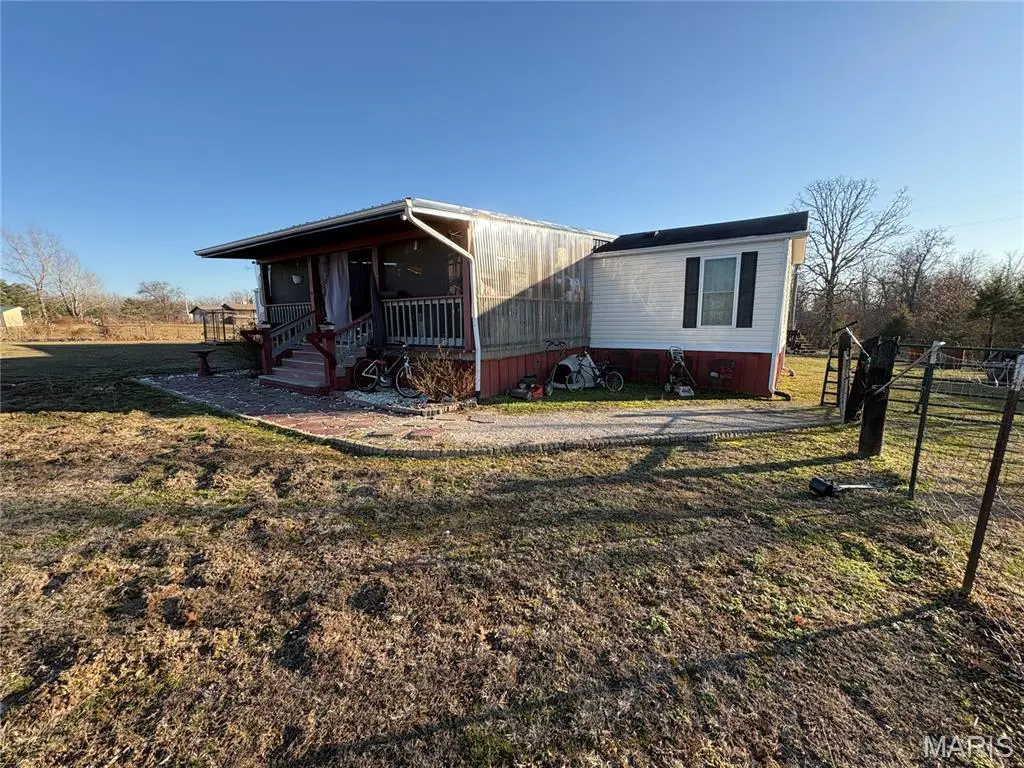
934 County Road 68 · Viburnum, MO
Flood risk 1/10 · Minimal
- FEMA flood zone
- X (unshaded)
- Chance of flooding over 30 yrs
- 0.0%
- Est. flood insurance / yr
- $473 – $860
Fire risk 3/10 · Minor
- Est. fire insurance / yr
- $1,054 – $1,958
Heat risk 4/10 · Minor
- Hot days now (above 105°F)
- 7 days/yr
- Hot days in 30 yrs
- 20 days/yr
Wind risk 2/10 · Minimal
- Chance of severe wind over 30 yrs
- 1.0%
Air-quality risk 2/10 · Minimal
- Unhealthy air days now
- 0 days/yr
- Unhealthy air days in 30 yrs
- 1 days/yr
Risk factors via First Street. Map © Google.
Why this score? — see what drove the C+ grade
The composite is a weighted blend of 9 inputs, each scored 0–100. Each bar is that input's sub-score; the figure is the points it added to the 100-point composite (weight × sub-score).
- Cash flow +23.2/30.0
- ARV discount +7.5/15.0
- DSCR +7.4/10.0
- Appreciation +7.2/10.0
- 1% rule +4.8/10.0
- Schools +3.7/10.0
- Livability +2.8/5.0
- Rent growth +2.5/5.0
- Condition / age +2.5/5.0
$104,995
🖨 Deal sheet 📄 Offer letter ✓ Due diligence
Listing remarks MLS
Listed @ $104,995. This may be the best way to start your dream of living in rural Missouri in the rolling foothills of the Mark Twain National Forest. The Mobile Home could be your starter home, weekend place or a rental. This 3 bed, 2 bath mobile home is 1216 square feet sitting on one acre of ground. Free of any regulation in a city or county with your own private well and septic. The property is fenced and on a paved county road. Just a 5-minute drive to the small town of Viburnum, Mo. for all your necessary goods and services. The area is rich in natural beauty with the Dillard Mill State Park just 15 minutes away, Council Bluff Lake is just 20 minutes down the road for great recreation and fishing. Elephant Rocks State Park along with Johnson Shutin's recreation area is only 40 minutes away. The crystal-clear waters of the Huzzah Creek is just a 10-minute drive, and the beauty Black River is a 15-minute trip. White Tail deer hunting is famous in the area, and the wild turkey season is always a favorite. The area has also become a common sighting of the astonishing Bald Eagle. If you have been waiting for the right place to hang your hat, you may have found the hook. Let's make this happen.
Key facts
- Paved county road
- Private well
- Fenced property
Tags
Neighborhood map
What this means for you Summary
Snapshot
- This is a 3-bed/1.0-bath manufactured listed at $105k.
Deal economics
- At list price, monthly cash flow is $189 ($2k/yr) — positive.
- The deal already cash-flows at list — no discount required.
- To meet the 1% rule (rent ≥ 1% of price), the offer needs to be $103k (2.1% below list).
- Recommended offer: $99k (6.0% below list) — sets the bar for market timing.
Location & tenants
- Location reads 55/100 on livability (#752 in MO) — a working-class tenant base; expect higher turnover. Strengths: cost of living A+, housing A+; Watch: schools D, employment D, crime F.
- Iron County C-4 (rural): math 36% / reading 46% proficiency, ranked #299 of 535 in MO (top 56%) — families likely to look elsewhere, expect single-tenant / working-renter base with shorter leases.
- Market conditions: 6 active listings in the ZIP; 6 units permitted in Iron County in 2024 (0 in 5+ unit buildings).
Forward outlook
- In year one you build about $5k of equity ($726 loan paydown + $5k appreciation (4.4% local appreciation)).
- Iron County population projected at -25% by 2050 — secular population decline; favor cash flow + early exit over multi-decade hold.
- At projected returns (4.4% appreciation + 3.0% rent growth), your $29k cash investment doubles in ~4 years — after that, you're playing with house money.
- By year 7, paydown + projected appreciation supports a ~$34k cash-out refi (75% LTV) — recoverable capital for the next deal without selling this one.
Negotiation context
- It's been on market 81 days — a 6% lower offer ($99k) is reasonable based on typical stale-listing flexibility.
- 2 sale attempts with the ask held roughly flat each time — persistent listings suggest the price (not the market) is what's stuck; bring a comps-based counter.
Questions for the listing agent
- It's been on market 81 days. Have you received any prior offers? Is the seller open to a 6% concession, seller financing, or rate buy-down credit?
- Why hasn't it sold? Are there any deal-killer items the seller is aware of (foundation, flood, title, zoning, code violations)?
- Is there a deadline driving the sale (1031 exchange, divorce, estate, relocation)? That informs how much negotiation room exists.
- Schools are D-rated, which usually means shorter tenancies and higher turnover. Who's the typical renter profile here, and what's been the actual vacancy rate?
- Crime grade is F in this area — have there been break-ins, vandalism, or insurance claims at this property in the last 3 years? What carrier currently insures it and at what premium?
- What's the average days-on-market for RENTAL listings here right now (not sales)? A rising rental-DOM trend means longer vacancies and softer asking-rent achievability than the comps imply.
- What's the recent tenant-quality profile in this submarket — average credit score on applications, eviction rate, late-payment / NSF rate, and stable-employment percentage? A property-management company in the area should have these aggregated.
- How much new for-sale + rental construction is in the pipeline within 1–3 miles? Heavy new supply typically softens prices + rents 12–24 months out; constrained supply supports both.
Investment metrics
- 1% rule
- 0.98% ✗
- Cap rate
- 8.46%
- Cash-on-cash
- 7.73%
- DSCR
- 1.34
- GRM
- 8.5
CMA / ARV
No comps found within radius.
Projected returns pro-forma
4.42% appreciation · 3.0% rent growth · sell at horizon
- IRR
- 18.2%
- Equity multiple
- 2.12×
- Total profit
- $32,798
- Equity at exit
- $55,864
- IRR
- 18.5%
- Equity multiple
- 4.07×
- Total profit
- $90,375
- Equity at exit
- $93,535
Cash invested: $29,399 (down + closing). Projections, not guarantees.
Landlord ↔ Tenant lean methodology
- Overall (STATE)
- 81 Strongly Landlord-Friendly
- State Missouri
- 81 Strongly Landlord-Friendly · R+10
- County
- — inherits STATE
- City
- — inherits STATE
ZIP-level market 65439
- Home prices YoY
- 2.7%
- Active inventory
- 6
- Price-to-rent
- 8.5×
Monthly cashflow live
- Estimated rent
- $1,028 medium interval (Pro) →
- Mortgage (P&I)
- −$551
- Tax from tax record
- −$28 /mo · $337/yr
- Insurance
- −$44
- HOA
- −$0
- Vacancy / Maint / Mgmt
- −$216
- Net cashflow
- $189
Break-even live
UW: 25.0% down · 7.5% · 30yr · 1.5% tax · 5.0% vac · 8.0% maint · 8.0% mgmt
Financing live
Cash to close
- Down payment
- $26,249
- Closing costs
- $3,150
- Reserves months
- —
- Total cash needed
- —
Loan-product check · same deal, 3 products live
Conventional
25% down · 7.5% · 30yr
- Down + closing
- —
- Monthly P&I
- —
- Monthly cashflow
- —
- DSCR
- —
- Eligible?
- —
Personal DTI + credit; lowest rate.
DSCR
20% down · 8.5% · 30yr
- Down + closing
- —
- Monthly P&I
- —
- Monthly cashflow
- —
- DSCR
- —
- Eligible?
- —
No personal income docs; deal must DSCR.
Hard money
10% down · 12.0% · 12mo
- Down + closing
- —
- Monthly P&I
- —
- Monthly cashflow
- —
- DSCR
- —
- Eligible?
- —
Short-term bridge; refi at stabilization.
Listing history 19 events
-
2026-06-18days on market $104,995 Active 81 DOM
-
2026-06-17days on market $104,995 Active 80 DOM
-
2026-06-16days on market $104,995 Active 79 DOM
-
2026-06-15days on market $104,995 Active 78 DOM
-
2026-06-13days on market $104,995 Active 76 DOM
-
2026-06-12days on market $104,995 Active 75 DOM
-
2026-06-09days on market $104,995 Active 72 DOM
-
2026-06-08days on market $104,995 Active 71 DOM
-
2026-06-07days on market $104,995 Active 70 DOM
-
2026-06-07days on market $104,995 Active 69 DOM
-
2026-06-04days on market $104,995 Active 66 DOM
-
2026-06-02days on market $104,995 Active 65 DOM
-
2026-06-01days on market $104,995 Active 64 DOM
-
2026-05-31days on market $104,995 Active 63 DOM
-
2026-03-29$104,995 Active 1215-char remark
Show marketing remark (1215 chars)
Listed @ $104,995. This may be the best way to start your dream of living in rural Missouri in the rolling foothills of the Mark Twain National Forest. The Mobile Home could be your starter home, weekend place or a rental. This 3 bed, 2 bath mobile home is 1216 square feet sitting on one acre of ground. Free of any regulation in a city or county with your own private well and septic. The property is fenced and on a paved county road. Just a 5-minute drive to the small town of Viburnum, Mo. for all your necessary goods and services. The area is rich in natural beauty with the Dillard Mill State Park just 15 minutes away, Council Bluff Lake is just 20 minutes down the road for great recreation and fishing. Elephant Rocks State Park along with Johnson Shutin's recreation area is only 40 minutes away. The crystal-clear waters of the Huzzah Creek is just a 10-minute drive, and the beauty Black River is a 15-minute trip. White Tail deer hunting is famous in the area, and the wild turkey season is always a favorite. The area has also become a common sighting of the astonishing Bald Eagle. If you have been waiting for the right place to hang your hat, you may have found the hook. Let's make this happen.
-
2025-07-18price $95,000
-
2025-06-06price $115,000
-
2025-03-14price $120,000
-
2025-02-19$125,000 Active
ⓘ Source: listings_history table (triggers on properties + properties_extension) + one-shot
backfill from property_details.listing_events for pre-trigger history.
Tax reassessment forecast MO · Resets to sale price
- Current annual tax
- $337 · $28/mo
- Projected year-2 tax
- $1,018 · $85/mo
- Expected delta
- +$682/yr (+$57/mo · 202.6%)
ⓘ Screening estimate from a state-policy table — verify with the county assessor before closing.
Climate risk First Street
- Flood 1/10 Low FEMA zone X (unshaded) · 0% chance over 30 yrs
- Wildfire 3/10 Moderate
- Heat 4/10 Moderate 7 d/yr ≥105°F today · 20 d/yr by 30 yrs out
- Wind 2/10 Low 100% chance of damaging wind over 30 yrs
- Air quality 2/10 Low 0 unhealthy d/yr today · 1 by 30 yrs out
Nearby sold comps map
Loading sold comps map…
Walkable amenities ~0.75 mi
Loading nearby amenities…
Taxation est. · year 1
- Rental income
- $12,331
- − Mortgage interest
- −$5,881
- − Property taxes
- −$337
- − Insurance
- −$525
- − Repairs & maintenance
- −$986
- − Management
- −$986
- − Depreciation
- −$3,054
- Taxable income
- $561
- Est. tax owed @ 24.0%
- −$135
- After-tax cash flow
- $2,138/yr
For passive investors: Depreciation is non-cash, so a rental often shows a tax loss while cash-flowing — sheltering income. Rental losses are passive: they offset passive income freely, and up to $25,000/yr can offset ordinary (W-2) income if you actively participate and your MAGI is under $100k (phasing out to $0 by $150k); unused losses carry forward. On sale, claimed depreciation is recaptured at up to 25%, and gains may owe capital-gains tax (a 1031 exchange can defer both). Figures are a year-1 estimate at your 24.0% rate — not tax advice; consult a CPA.
Schools (NCES district)
- District
- Iron County C-4
- NCES district ID
- 2915510
- Math proficiency
- 36% ▼ -4.00%
- Reading proficiency
- 46% ▲ 1.00%
- Median HH income
- $39,736
- Composite
- 36.71/100
- National rank
- #9210
- State rank
- #299 of 535 in MO
Livability — Viburnum
- Score
- 55/100
- State rank
- #752
- US rank
- #23441
Category grades
Schools grade is shown separately in the Schools card above.
Census & demographics
- Population (ZIP)
- 29
Population outlook (Iron County) Hauer SSP2
- Today (2025)
- 9,245 people
- By 2030
- 8,745 · -5.4%
- By 2040
- 7,808 · -15.5%
- By 2050
- 6,944 · -24.9%
- By 2075
- 5,320 · -42.5%
- By 2100
- 4,245 · -54.1%
Race, ethnicity, and origin ACS 2023
- Neighborhood character
- Diverse neighborhood (Simpson 0.61)
- Race & ethnicity
- White 62% Two or more races 38%
- Common ancestry
- German 21%
Political lean MEDSL · Iron
- 2024 margin
- Solid R (+62.4) · D 18.2% · R 80.7% · Other 1.1%
- 2008→2024 swing
- -65.2pp toward R · 2008: 2.8pp · 2024: -62.4pp
- All cycles
- 2024: R+62.4 2020: R+57.7 2016: R+52.6 2012: R+14.5 2008: D+2.8
Not yet ingested
- Civics
- —
Market trends
- HPI YoY
- ▲ 4.42%
- Current HPI
- 170.0047
- Rent YoY
- —
- Metro
- —
- State GDP YoY
- ▲ 1.84%
- F500 in state
- 20
Industry mix (Fortune 500 HQ in MO)
| Industry | F500 HQs | Revenue |
|---|---|---|
| Healthcare | 1 | $163B |
|
||
| Insurance | 1 | $21B |
|
||
| Industrial Technology | 1 | $17B |
|
||
| Retail | 1 | $16B |
|
||
| Industrial Distribution | 1 | $10B |
|
||
| Utilities | 1 | $9B |
|
||
Price history
-16.0% since first listed5 events — show timeline
- 2026-03-29 Listed $104,995 MARIS as Distributed by MLS Grid
- 2025-07-18 Price Changed $95,000 MARIS as Distributed by MLS Grid
- 2025-06-06 Price Changed $115,000 MARIS as Distributed by MLS Grid
- 2025-03-14 Price Changed $120,000 MARIS as Distributed by MLS Grid
- 2025-02-19 Listed $125,000 MARIS as Distributed by MLS Grid
Property tax history
+1.5%/yrLatest (2025): $337 · +12.1% YoY. Source: county tax records.
Cash-flow waterfall
monthlySold comps — $/sqft
last 12 mo · ≤1 miLoading sold comps…