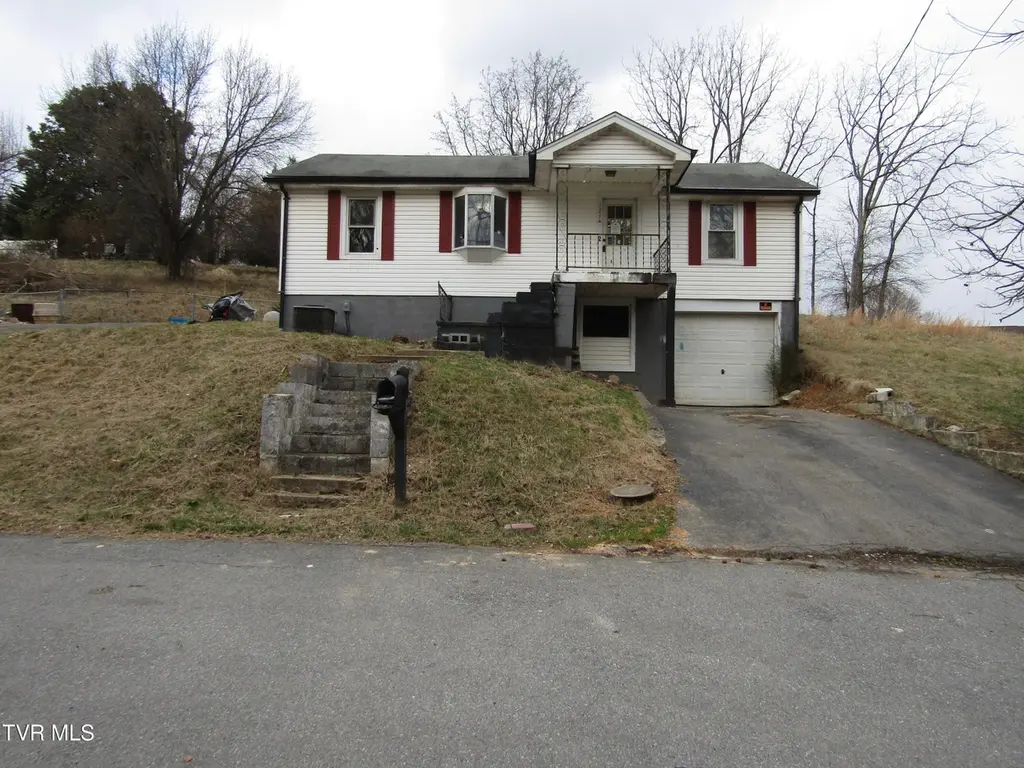
129 Fredrick St · Bloomingdale, TN
Flood risk 9/10 · Severe
- FEMA flood zone
- X (unshaded)
- Chance of flooding over 30 yrs
- 0.99%
- Est. flood insurance / yr
- $473 – $860
Fire risk 3/10 · Minor
- Est. fire insurance / yr
- $949 – $1,763
Heat risk 4/10 · Minor
- Hot days now (above 100°F)
- 7 days/yr
- Hot days in 30 yrs
- 21 days/yr
Wind risk 2/10 · Minimal
- Chance of severe wind over 30 yrs
- —
Air-quality risk 2/10 · Minimal
- Unhealthy air days now
- 0 days/yr
- Unhealthy air days in 30 yrs
- 1 days/yr
Risk factors via First Street. Map © Google.
Why this score? — see what drove the B grade
The composite is a weighted blend of 9 inputs, each scored 0–100. Each bar is that input's sub-score; the figure is the points it added to the 100-point composite (weight × sub-score).
- Cash flow +30.0/30.0
- ARV discount +15.0/15.0
- DSCR +10.0/10.0
- 1% rule +8.3/10.0
- Rent growth +4.5/5.0
- Livability +2.8/5.0
- Condition / age +2.5/5.0
- Schools +1.8/10.0
- Appreciation +0.0/10.0
$115,000
🖨 Deal sheet (PDF) 📄 Offer letter ✓ Due diligence
Listing remarks MLS
3 Bedroom 2 Bath home with laundry upstairs and a bonus room off the kitchen that would be a great office or family room. Property being sold AS IS CONDITION with no warranties written or implied. Buyer or Buyer's agent to verify all information contained herein. All information is from 3rd party or tax records and should not be assumed accurate.
Key facts
- Laundry upstairs
- 7,840 sq ft lot
- Built 1953
Tags
Neighborhood map
What this means for you Summary
Snapshot
- This is a 3-bed/1.0-bath single-family listed at $115k.
Deal economics
- At list price, monthly cash flow is $442 ($5k/yr) — positive.
- The deal already cash-flows at list — no discount required.
- Meets the 1% rule at list price ($2k rent vs $115k).
- Recommended offer: $105k (9.0% below list) — sets the bar for market timing.
- Cap rate 11.5% vs local median 4.9% in Bloomingdale — top-decile yield for the area; either an underpriced asset or a hidden risk that comps aren't pricing in. Stress-test before assuming the spread holds.
Location & tenants
- Location reads 56/100 on livability (#343 in TN) — a working-class tenant base; expect higher turnover. Strengths: cost of living A+, housing A+; Watch: employment D+, schools F, crime F.
- Sullivan County (suburban): math 17% / reading 24% proficiency, ranked #109 of 139 in TN (top 78%) — low school quality limits family demand, transient renter base, plan for 1-2y turnover.
- Market conditions: Rents rising fast (+8.0%/yr); 239 active listings in the ZIP; 453 units permitted in Sullivan County in 2024 (6 in 5+ unit buildings).
- This rent runs 37% of the median local income ($49k/yr) — at the standard rent-burdened threshold; future hikes will face affordability resistance.
Forward outlook
- Local home prices are declining (-3.0%/yr); year-one equity from $795 of loan paydown is wiped out by about $3k of value loss. Plan a longer hold.
- Sullivan County population projected to shrink 5% by 2050 — rents likely to lag national; underwrite the cash flow, not the appreciation.
- At projected returns (-3.0% appreciation + 8.0% rent growth), your $32k cash investment doubles in ~6 years — after that, you're playing with house money.
Negotiation context
- It's been on market 108 days — a 9% lower offer ($105k) is reasonable based on typical stale-listing flexibility.
- 5 sale attempts since 22y ago; this cycle's ask has dropped $54k (32%) from the opening price — seller is motivated, your offer sets the floor, not the list.
- Current owner paid $68k; list at $115k implies a 70% gain — meaningful room to come down on a strong offer.
Risks & watch-outs
- Watch-outs: flood insurance adds $56/mo; built in 1953 — expect roof / HVAC / electrical / plumbing capex.
- Climate carrying-cost: severe flood risk — expect insurance premiums to compound above CPI over the hold.
Questions for the listing agent
- It's been on market 108 days. Have you received any prior offers? Is the seller open to a 9% concession, seller financing, or rate buy-down credit?
- Built in 1953 — when were the roof, HVAC, electrical panel, plumbing, and water heater last replaced?
- What's the actual annual flood-insurance premium (NFIP or private), and is the property in a SFHA with mandatory coverage?
- Why hasn't it sold? Are there any deal-killer items the seller is aware of (foundation, flood, title, zoning, code violations)?
- Is there a deadline driving the sale (1031 exchange, divorce, estate, relocation)? That informs how much negotiation room exists.
- Schools are F-rated, which usually means shorter tenancies and higher turnover. Who's the typical renter profile here, and what's been the actual vacancy rate?
- Crime grade is F in this area — have there been break-ins, vandalism, or insurance claims at this property in the last 3 years? What carrier currently insures it and at what premium?
- What's the average days-on-market for RENTAL listings here right now (not sales)? A rising rental-DOM trend means longer vacancies and softer asking-rent achievability than the comps imply.
- What's the recent tenant-quality profile in this submarket — average credit score on applications, eviction rate, late-payment / NSF rate, and stable-employment percentage? A property-management company in the area should have these aggregated.
- How much new for-sale + rental construction is in the pipeline within 1–3 miles? Heavy new supply typically softens prices + rents 12–24 months out; constrained supply supports both.
Investment metrics
- 1% rule
- 1.33% ✓
- Cap rate
- 11.49%
- Cash-on-cash
- 18.55%
- DSCR
- 1.83
- GRM
- 6.3
CMA / ARV
- ARV (median comp)
- $154,438
- List price
- $115,000
- Delta
- -25.54%
- Verdict
- UNDERPRICED
- Comps
- 20 within 1.0 mi
Show comp detail 12 sales within ~0.75 mi
| Address | Dist | Beds/Ba | Sqft | Sold | Price | $/sf | Match |
|---|---|---|---|---|---|---|---|
| 117 Asbury St | 0.24mi | 3/2.0 | 1,056 (-2%) | 3mo | $145,000 | $137 | 78 |
| 3304 Lightwood St | 0.35mi | 4/1.0 (+1) | 1,080 (0%) | 1mo | $223,000 | $206 | 77 |
| 212 Asbury St | 0.25mi | 3/1.0 | 1,152 (+7%) | 5mo | $127,500 | $111 | 73 |
| 3341 Page St | 0.46mi | 3/1.5 | 1,112 (+3%) | 2mo | $200,000 | $180 | 70 |
| 417 Kingsley Ave | 0.47mi | 3/1.0 | 1,025 (-5%) | 2mo | $246,900 | $241 | 68 |
| 425 Kingsley Ave | 0.49mi | 3/1.0 | 1,025 (-5%) | 3mo | $155,000 | $151 | 66 |
| 421 Lucy Rd | 0.40mi | 3/1.0 | 1,206 (+12%) | 0mo | $185,477 | $154 | 62 |
| 126 Whitehills Rd | 0.52mi | 3/2.0 | 1,138 (+5%) | 3mo | $120,000 | $105 | 60 |
| 132 Packing House Rd | 0.58mi | 3/1.0 | 1,028 (-5%) | 8mo | $152,500 | $148 | 58 |
| 3117 Blackburn Ave | 0.42mi | 3/1.0 | 936 (-13%) | 4mo | $160,000 | $171 | 55 |
| 401 Lucy Rd | 0.33mi | 2/1.0 (-1) | 920 (-15%) | 4mo | $169,000 | $184 | 52 |
| 3112 Blackburn Ave | 0.44mi | 3/1.0 | 924 (-14%) | 5mo | $167,500 | $181 | 51 |
Match score weights: distance 35% · size 25% · config 20% · recency 20%. Top-matched comps best support the ARV.
Projected returns pro-forma
-3.0% appreciation · 7.95% rent growth · sell at horizon
- IRR
- 12.9%
- Equity multiple
- 1.54×
- Total profit
- $17,548
- Equity at exit
- $17,147
- IRR
- 25.3%
- Equity multiple
- 3.73×
- Total profit
- $87,991
- Equity at exit
- $9,943
Cash invested: $32,200 (down + closing). Projections, not guarantees.
Landlord ↔ Tenant lean methodology
- Overall (STATE)
- 87 Strongly Landlord-Friendly
- State Tennessee
- 87 Strongly Landlord-Friendly · R+13
- County
- — inherits STATE
- City
- — inherits STATE
ZIP-level market 37660
- Home prices YoY
- -24.2%
- Rents YoY
- 8.0%
- Active inventory
- 239
- Price-to-rent
- 6.3×
Monthly cashflow live
- Estimated rent
- $1,532 medium interval (Pro) →
- Mortgage (P&I)
- −$603
- Tax from tax record
- −$61 /mo · $734/yr
- Insurance
- −$48
- Flood insurance flood zone
- −$56 /mo · $666/yr
- HOA
- −$0
- Vacancy / Maint / Mgmt
- −$322
- Net cashflow
- $442
Break-even live
Sensitivity live
| Price | -10% $507 | -5% $475 | +0% $442 | +5% $410 | +10% $377 |
|---|---|---|---|---|---|
| Rent | -10% $321 | -5% $382 | +0% $442 | +5% $503 | +10% $563 |
| Rate | -1.0pp $500 | -0.5pp $471 | base $442 | +0.5pp $412 | +1.0pp $382 |
UW: 25.0% down · 7.5% · 30yr · 1.5% tax · 5.0% vac · 8.0% maint · 8.0% mgmt
Financing live
Cash to close
- Down payment
- $28,750
- Closing costs
- $3,450
- Reserves months
- —
- Total cash needed
- —
Loan-product check · same deal, 3 products live
Conventional
25% down · 7.5% · 30yr
- Down + closing
- —
- Monthly P&I
- —
- Monthly cashflow
- —
- DSCR
- —
- Eligible?
- —
Personal DTI + credit; lowest rate.
DSCR
20% down · 8.5% · 30yr
- Down + closing
- —
- Monthly P&I
- —
- Monthly cashflow
- —
- DSCR
- —
- Eligible?
- —
No personal income docs; deal must DSCR.
Hard money
10% down · 12.0% · 12mo
- Down + closing
- —
- Monthly P&I
- —
- Monthly cashflow
- —
- DSCR
- —
- Eligible?
- —
Short-term bridge; refi at stabilization.
Listing history 27 events
-
2026-06-17status $115,000 Pending 108 DOM
-
2026-06-16days on market $115,000 Active 108 DOM
-
2026-06-15days on market $115,000 Active 107 DOM
-
2026-06-14days on market $115,000 Active 105 DOM
-
2026-06-13remarks 452-char remark
-
2026-06-13days on market $115,000 Active 104 DOM
-
2026-06-10days on market $115,000 Active 102 DOM
-
2026-06-09days on market $115,000 Active 101 DOM
-
2026-06-08days on market $115,000 Active 100 DOM
-
2026-06-07pricedays on market $115,000 Active 99 DOM
-
2026-06-02days on market $135,000 Active 94 DOM
-
2026-06-01days on market $135,000 Active 93 DOM
-
2026-05-31days on market $135,000 Active 92 DOM
-
2026-05-30days on market $135,000 Active 91 DOM
-
2026-04-27price $145,000 348-char remark
Show marketing remark (348 chars)
3 Bedroom 2 Bath home with laundry upstairs and a bonus room off the kitchen that would be a great office or family room. Property being sold AS IS CONDITION with no warranties written or implied. Buyer or Buyer's agent to verify all information contained herein. All information is from 3rd party or tax records and should not be assumed accurate.
-
2026-03-20price $156,000 348-char remark
Show marketing remark (348 chars)
3 Bedroom 2 Bath home with laundry upstairs and a bonus room off the kitchen that would be a great office or family room. Property being sold AS IS CONDITION with no warranties written or implied. Buyer or Buyer's agent to verify all information contained herein. All information is from 3rd party or tax records and should not be assumed accurate.
-
2026-02-28$169,000 Active 348-char remark
Show marketing remark (348 chars)
3 Bedroom 2 Bath home with laundry upstairs and a bonus room off the kitchen that would be a great office or family room. Property being sold AS IS CONDITION with no warranties written or implied. Buyer or Buyer's agent to verify all information contained herein. All information is from 3rd party or tax records and should not be assumed accurate.
-
2015-06-01soldstatus $67,500
-
2015-05-28soldstatus $67,500 180-char remark
Show marketing remark (180 chars)
Pending Before Print - Totally remodeled House with new windows, flooring, heat pump, kitchen appliances, walls, kitchen, some electrical (by code, plumbing and so much more. .. ..
-
2015-03-30$72,500 180-char remark
Show marketing remark (180 chars)
Pending Before Print - Totally remodeled House with new windows, flooring, heat pump, kitchen appliances, walls, kitchen, some electrical (by code, plumbing and so much more. .. ..
-
2005-04-01soldstatus $63,500
-
2005-02-14soldstatus $63,500
-
2004-08-14$65,000
-
2004-08-14$65,000
-
2004-08-14$70,000
-
1987-12-01soldstatus $24,000
-
1979-02-19soldstatus $22,250
ⓘ Source: listings_history table (triggers on properties + properties_extension) + one-shot
backfill from property_details.listing_events for pre-trigger history.
Tax reassessment forecast TN · Resets to sale price
- Current annual tax
- $734 · $61/mo
- Projected year-2 tax
- $816 · $68/mo
- Expected delta
- +$82/yr (+$7/mo · 11.2%)
ⓘ Screening estimate from a state-policy table — verify with the county assessor before closing.
Climate risk First Street
- Flood 9/10 Extreme FEMA zone X (unshaded) · 99% chance over 30 yrs
- Wildfire 3/10 Moderate
- Heat 4/10 Moderate 7 d/yr ≥100°F today · 21 d/yr by 30 yrs out
- Wind 2/10 Low
- Air quality 2/10 Low 0 unhealthy d/yr today · 1 by 30 yrs out
Nearby sold comps map
Loading sold comps map…
Walkable amenities ~0.75 mi
Loading nearby amenities…
Taxation est. · year 1
- Rental income
- $18,379
- − Mortgage interest
- −$6,442
- − Property taxes
- −$734
- − Insurance
- −$1,242
- − Repairs & maintenance
- −$1,470
- − Management
- −$1,470
- − Depreciation
- −$3,345
- Taxable income
- $3,676
- Est. tax owed @ 24.0%
- −$882
- After-tax cash flow
- $4,425/yr
For passive investors: Depreciation is non-cash, so a rental often shows a tax loss while cash-flowing — sheltering income. Rental losses are passive: they offset passive income freely, and up to $25,000/yr can offset ordinary (W-2) income if you actively participate and your MAGI is under $100k (phasing out to $0 by $150k); unused losses carry forward. On sale, claimed depreciation is recaptured at up to 25%, and gains may owe capital-gains tax (a 1031 exchange can defer both). Figures are a year-1 estimate at your 24.0% rate — not tax advice; consult a CPA.
Schools (NCES district)
- District
- Sullivan County
- NCES district ID
- 4703990
- Math proficiency
- 17% ▼ -15.00%
- Reading proficiency
- 24% ▼ -10.00%
- Median HH income
- $43,263
- Composite
- 17.66/100
- National rank
- #9030
- State rank
- #109 of 139 in TN
Livability — Bloomingdale
- Score
- 56/100
- State rank
- #343
- US rank
- #22770
Category grades
Schools grade is shown separately in the Schools card above.
Census & demographics
- Census place
- Bloomingdale, TN
- County
- Sullivan County · 121,987 people
- Metro
- Kingsport-Bristol, TN-VA
- Population (ZIP)
- 40,996
- Household income
- $49,191
- Rent vs Own
- Severe rent burden
- 1384.0
Population outlook (Sullivan County) Hauer SSP2
- Today (2025)
- 157,030 people
- By 2030
- 156,415 · -0.4%
- By 2040
- 153,778 · -2.1%
- By 2050
- 149,018 · -5.1%
- By 2075
- 138,068 · -12.1%
- By 2100
- 119,927 · -23.6%
Race, ethnicity, and origin ACS 2023
- Neighborhood character
- Predominantly White (88%)
- Race & ethnicity
- White 88% Two or more races 4% Black 4% Hispanic / Latino 3%
- Common ancestry
- Serbian 3% Slovak 3% Italian 1%
- Foreign-born
- 2% · Canada
- Languages at home
- 98% English-only · Spanish 2%
Political lean MEDSL · Sullivan
- 2024 margin
- Solid R (+55.0) · D 22.0% · R 77.0% · Other 1.0%
- 2008→2024 swing
- -13.6pp toward R · 2008: -41.3pp · 2024: -55.0pp
- All cycles
- 2024: R+55.0 2020: R+51.9 2016: R+56.2 2012: R+47.2 2008: R+41.3
Not yet ingested
- Civics
- —
Market trends
- HPI YoY
- ▼ -80.93%
- Current HPI
- 252.9821
- Rent YoY
- ▲ 7.95%
- Metro
- Kingsport-Bristol, TN-VA
- State GDP YoY
- ▲ 2.78%
- F500 in state
- 22
Industry mix (Fortune 500 HQ in TN)
| Industry | F500 HQs | Revenue |
|---|---|---|
| Healthcare | 3 | $91B |
|
||
| Retail | 3 | $72B |
|
||
| Transportation / Logistics | 1 | $88B |
|
||
| Paper / Packaging | 1 | $19B |
|
||
| Insurance | 1 | $13B |
|
||
| Energy | 1 | $12B |
|
||
Price history
+551.7% since first listed13 events — show timeline
- 2026-04-27 Price Changed $145,000 TVRMLS
- 2026-03-20 Price Changed $156,000 TVRMLS
- 2026-02-28 Listed $169,000 TVRMLS
- 2015-06-01 Sold (Public Records) $67,500 Public Records
- 2015-05-28 Sold (MLS) $67,500 TVRMLS
- 2015-03-30 Listed $72,500 TVRMLS
- 2005-04-01 Sold (Public Records) $63,500 Public Records
- 2005-02-14 Sold (MLS) $63,500 Knoxville MLS
- 2004-08-14 Listed $70,000 Knoxville MLS
- 2004-08-14 Listed $65,000 Knoxville MLS
- 2004-08-14 Listed $65,000 Knoxville MLS
- 1987-12-01 Sold (Public Records) $24,000 Public Records
- 1979-02-19 Sold (Public Records) $22,250 Public Records
Property tax history
+6.8%/yrLatest (2025): $734 · +64.6% YoY. Source: county tax records.
Cash-flow waterfall
monthlySold comps — $/sqft
last 12 mo · ≤1 miLoading sold comps…