 Duplex
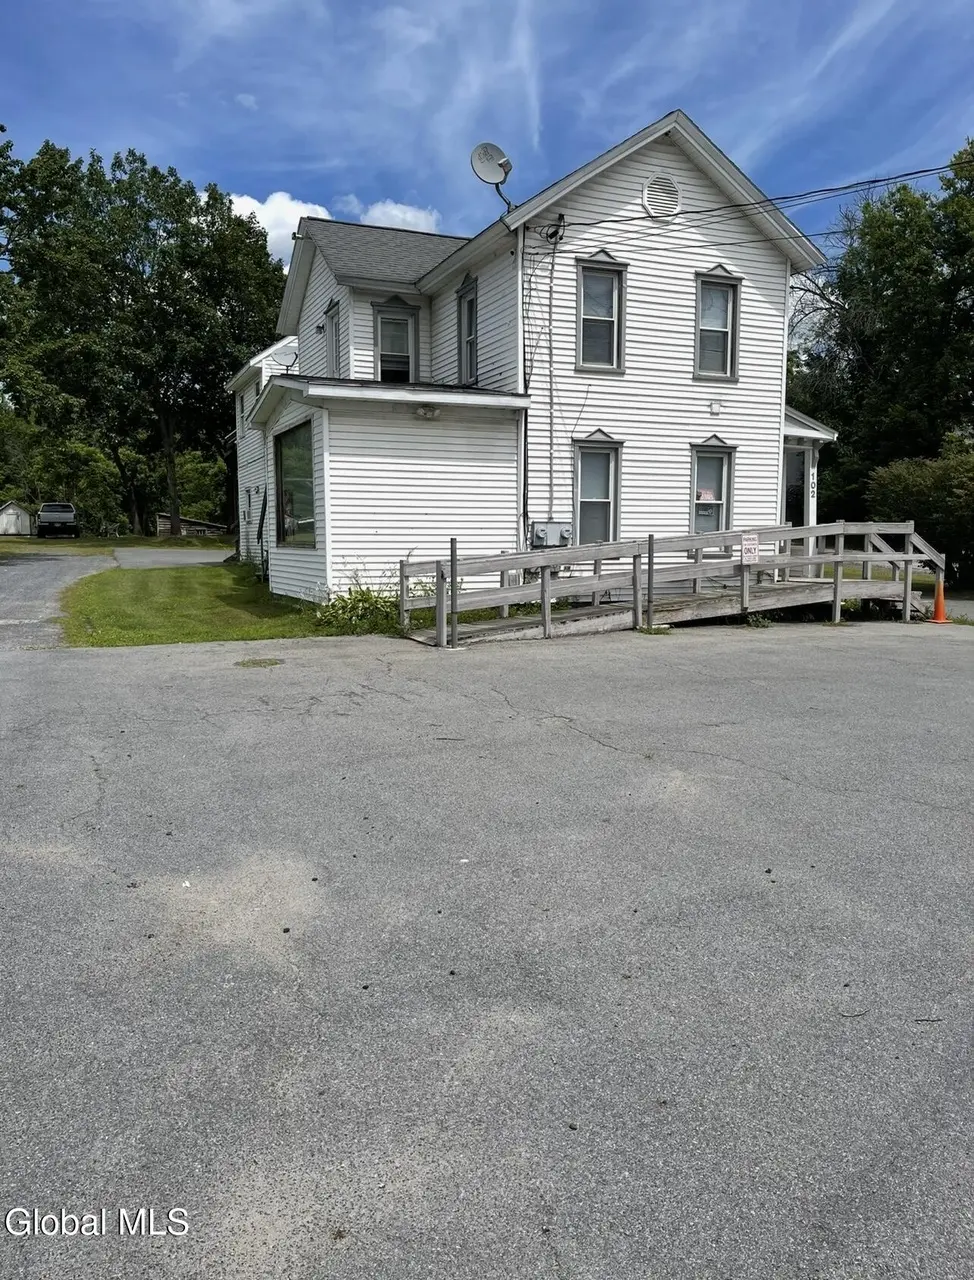
102 River St · Hudson Falls, NY
Flood risk 1/10 · Minimal
- FEMA flood zone
- —
- Chance of flooding over 30 yrs
- 0.0%
- Est. flood insurance / yr
- —
Fire risk 3/10 · Minor
- Est. fire insurance / yr
- $691 – $1,283
Heat risk 3/10 · Minor
- Hot days now (above 96°F)
- 7 days/yr
- Hot days in 30 yrs
- 15 days/yr
Wind risk 2/10 · Minimal
- Chance of severe wind over 30 yrs
- 3.0%
Air-quality risk 1/10 · Minimal
- Unhealthy air days now
- 0 days/yr
- Unhealthy air days in 30 yrs
- 0 days/yr
Risk factors via First Street. Map © Google.
Why this score? — see what drove the B- grade
The composite is a weighted blend of 9 inputs, each scored 0–100. Each bar is that input's sub-score; the figure is the points it added to the 100-point composite (weight × sub-score).
- Cash flow +19.0/30.0
- ARV discount +13.6/15.0
- Appreciation +10.0/10.0
- DSCR +6.0/10.0
- 1% rule +4.8/10.0
- Schools +3.7/10.0
- Livability +3.5/5.0
- Rent growth +2.5/5.0
- Condition / age +2.5/5.0
$299,000
🖨 Deal sheet (PDF) 📄 Offer letter ✓ Due diligence
Multi-family units
County records classify this as Multi-Family (2-4 Unit). Listing-text estimate: 2 units. confirmed
Listing remarks
turn key 2 family , currently has a beauty salon of 31 years separate entrance for salon, adequate parking , the owner is the listing agent, high visibility for a in home business , convenient location
Key facts
- Separate entrance
- Adequate parking
- Convenient location
Tags
Property features AI
Finance
- Financial info: Two total residential units
Exterior
- Parking: Paved parking for 10 vehicles
- Utilities: Public water; Public sewer; Natural gas available for heating
- Home design: Duplex; Two-story elements indicated by bath locations
- Construction: Vinyl siding
- Exterior features: Shingle roof; Road frontage
Interior
- Bedrooms: Two-unit property: Unit 1 has 1 bedroom; Unit 2 has 2 bedrooms
- Flooring: Carpet; Ceramic tile; Hardwood; Laminate
- Bathrooms: Total of 3 bathrooms: 2 full baths and 1 half bath; Full bath locations on 1st and 2nd levels; half bath on 1st level
- Heating & cooling: Natural gas heating
- Interior features: Carpet, ceramic tile, hardwood, and laminate flooring; Partial basement with crawl space and Bilco doors
Neighborhood map
What this means for you Summary
Snapshot
- This is a 2 × 3-bed/2.5-bath units multifamily listed at $299k.
Deal economics
- At list price, monthly cash flow is $313 ($4k/yr) — positive. Per door: $156/mo.
- The deal already cash-flows at list — no discount required.
- To meet the 1% rule (rent ≥ 1% of price), the offer needs to be $294k (1.5% below list).
- Recommended offer: $290k (3.0% below list) — sets the bar for market timing.
Location & tenants
- Location reads 69/100 on livability (#481 in NY) — a middle-class / working-renter tenant base. Strengths: housing A+, health & safety A+, cost of living A-; Watch: crime D, employment D, amenities F.
- Hudson Falls Central School District (suburban): math 39% / reading 47% proficiency, ranked #486 of 590 in NY (top 82%) — families likely to look elsewhere, expect single-tenant / working-renter base with shorter leases.
- Zoned schools: Hudson Falls High School (math 87% / reading 77%, grade A, #452 of 1,100 statewide, top 44%, 694 students, 38% FRL) — zoned schools at 38% FRL track the district average.
- Zoned-school proficiency averages 82% at this address vs 43% district-wide (+39 pts) — the actual schools serving this property are materially stronger than the Hudson Falls Central School District average implies; a family-tenant draw the district grade alone would hide.
- Market conditions: 55 active listings in the ZIP; 106 units permitted in Washington County in 2024 (0 in 5+ unit buildings).
Forward outlook
- In year one you build about $32k of equity ($2k loan paydown + $30k appreciation (10.0% local appreciation)).
- Washington County population projected at -20% by 2050 — secular population decline; favor cash flow + early exit over multi-decade hold.
- At projected returns (10.0% appreciation + 3.0% rent growth), your $84k cash investment doubles in ~3 years — after that, you're playing with house money.
- By year 2, paydown + projected appreciation supports a ~$51k cash-out refi (75% LTV) — recoverable capital for the next deal without selling this one.
Negotiation context
- It's been on market 40 days — a 3% lower offer ($290k) is reasonable based on typical stale-listing flexibility.
- 2 sale attempts with the ask held roughly flat each time — persistent listings suggest the price (not the market) is what's stuck; bring a comps-based counter.
- Current owner paid $46k; list at $299k implies a 550% gain — meaningful room to come down on a strong offer.
Risks & watch-outs
- Watch-outs: built in 1880 — expect roof / HVAC / electrical / plumbing capex.
Questions for the listing agent
- It's been on market 40 days. Have you received any prior offers? Is the seller open to a 3% concession, seller financing, or rate buy-down credit?
- Can we see the unit-by-unit rent roll, current vacancy, and any below-market leases? What's the average tenancy length?
- What capital expenditures (roof, boiler, parking lot, exteriors) have been made in the last 5 years, and what's planned in the next 2?
- Built in 1880 — when were the roof, HVAC, electrical panel, plumbing, and water heater last replaced?
- Is there a deadline driving the sale (1031 exchange, divorce, estate, relocation)? That informs how much negotiation room exists.
- Crime grade is D in this area — have there been break-ins, vandalism, or insurance claims at this property in the last 3 years? What carrier currently insures it and at what premium?
- What's the average days-on-market for RENTAL listings here right now (not sales)? A rising rental-DOM trend means longer vacancies and softer asking-rent achievability than the comps imply.
- What's the recent tenant-quality profile in this submarket — average credit score on applications, eviction rate, late-payment / NSF rate, and stable-employment percentage? A property-management company in the area should have these aggregated.
- How much new apartment / multifamily construction is in the pipeline within 1–3 miles? Heavy new supply (>2% of stock underway) typically softens rents 12–24 months out; light construction supports rent growth.
Investment metrics
- 1% rule
- 0.98% ✗
- Cap rate
- 7.55%
- Cash-on-cash
- 4.48%
- DSCR
- 1.20
- GRM
- 8.5
CMA / ARV
- ARV (median comp)
- $345,572
- List price
- $299,000
- Delta
- -13.48%
- Verdict
- UNDERPRICED
- Comps
- 20 within 1.0 mi
Show comp detail 2 sales within ~0.75 mi
| Address | Dist | Beds/Ba | Sqft | Sold | Price | $/sf | Match |
|---|---|---|---|---|---|---|---|
| 280 Main St | 0.63mi | 4/3.0 (+1) | 1,856 (-12%) | 2mo | $90,000 | $48 | 41 |
| 6 N Oak St | 0.66mi | 4/2.0 (+1) | 1,960 (-7%) | 20mo | $191,000 | $97 | 36 |
Match score weights: distance 35% · size 25% · config 20% · recency 20%. Top-matched comps best support the ARV.
Projected returns pro-forma
10.0% appreciation · 3.0% rent growth · sell at horizon
- IRR
- 27.5%
- Equity multiple
- 3.18×
- Total profit
- $182,779
- Equity at exit
- $269,363
- IRR
- 24.0%
- Equity multiple
- 7.24×
- Total profit
- $522,609
- Equity at exit
- $580,891
Cash invested: $83,720 (down + closing). Projections, not guarantees.
Landlord ↔ Tenant lean methodology
- Overall (STATE)
- 15 Strongly Tenant-Friendly
- State New York
- 15 Strongly Tenant-Friendly · D+10
- County
- — inherits STATE
- City
- — inherits STATE
ZIP-level market 12839
- Home prices YoY
- 8.5%
- Active inventory
- 55
- Price-to-rent
- 16.9×
Monthly cashflow live
- Estimated rent
- $2,944 medium interval (Pro) →
- Mortgage (P&I)
- −$1,568
- Tax from tax record
- −$320 /mo · $3,844/yr
- Insurance
- −$125
- HOA
- −$0
- Vacancy / Maint / Mgmt
- −$618
- Net cashflow
- $313
Break-even live
Sensitivity live
| Price | -10% $482 | -5% $397 | +0% $313 | +5% $228 | +10% $144 |
|---|---|---|---|---|---|
| Rent | -10% $80 | -5% $197 | +0% $313 | +5% $429 | +10% $545 |
| Rate | -1.0pp $463 | -0.5pp $389 | base $313 | +0.5pp $235 | +1.0pp $157 |
2-unit breakdown (identical units grouped — click to expand)
| Units | Beds | Baths | Est. rent |
|---|---|---|---|
| 2× units | 3 | 2.5 | $2,944 |
| #1 | 3 | 2.5 | $1,472 |
| #2 | 3 | 2.5 | $1,472 |
| Total (2 units) | $2,944 | ||
UW: 25.0% down · 7.5% · 30yr · 1.5% tax · 5.0% vac · 8.0% maint · 8.0% mgmt
Financing live
Cash to close
- Down payment
- $74,750
- Closing costs
- $8,970
- Reserves months
- —
- Total cash needed
- —
Loan-product check · same deal, 3 products live
Conventional
25% down · 7.5% · 30yr
- Down + closing
- —
- Monthly P&I
- —
- Monthly cashflow
- —
- DSCR
- —
- Eligible?
- —
Personal DTI + credit; lowest rate.
DSCR
20% down · 8.5% · 30yr
- Down + closing
- —
- Monthly P&I
- —
- Monthly cashflow
- —
- DSCR
- —
- Eligible?
- —
No personal income docs; deal must DSCR.
Hard money
10% down · 12.0% · 12mo
- Down + closing
- —
- Monthly P&I
- —
- Monthly cashflow
- —
- DSCR
- —
- Eligible?
- —
Short-term bridge; refi at stabilization.
Listing history 19 events
-
2026-06-18days on market $299,000 Active 40 DOM
-
2026-06-17days on market $299,000 Active 39 DOM
-
2026-06-16days on market $299,000 Active 38 DOM
-
2026-06-15days on market $299,000 Active 37 DOM
-
2026-06-14days on market $299,000 Active 35 DOM
-
2026-06-13days on market $299,000 Active 34 DOM
-
2026-06-10days on market $299,000 Active 32 DOM
-
2026-06-09days on market $299,000 Active 31 DOM
-
2026-06-08days on market $299,000 Active 30 DOM
-
2026-06-07days on market $299,000 Active 29 DOM
-
2026-06-03days on market $299,000 Active 25 DOM
-
2026-06-02days on market $299,000 Active 24 DOM
-
2026-06-01days on market $299,000 Active 23 DOM
-
2026-05-31days on market $299,000 Active 22 DOM
-
2026-05-31days on market $299,000 Active 21 DOM
-
2026-05-09$312,000 Active 199-char remark
-
2026-03-28historical
-
2025-12-22$325,000 Active
-
1993-03-19soldstatus $46,000
ⓘ Source: listings_history table (triggers on properties + properties_extension) + one-shot
backfill from property_details.listing_events for pre-trigger history.
Tax reassessment forecast NY · Partial reset (capped growth)
- Current annual tax
- $3,844 · $320/mo
- Projected year-2 tax
- $4,449 · $371/mo
- Expected delta
- +$604/yr (+$50/mo · 15.7%)
ⓘ Screening estimate from a state-policy table — verify with the county assessor before closing.
Climate risk First Street
- Flood 1/10 Low 0% chance over 30 yrs
- Wildfire 3/10 Moderate
- Heat 3/10 Moderate 7 d/yr ≥96°F today · 15 d/yr by 30 yrs out
- Wind 2/10 Low 3% chance of damaging wind over 30 yrs
- Air quality 1/10 Low 0 unhealthy d/yr today · 0 by 30 yrs out
Nearby sold comps map
Loading sold comps map…
Walkable amenities ~0.75 mi
Loading nearby amenities…
Taxation est. · year 1
- Rental income
- $35,328
- − Mortgage interest
- −$16,749
- − Property taxes
- −$3,844
- − Insurance
- −$1,495
- − Repairs & maintenance
- −$2,826
- − Management
- −$2,826
- − Depreciation
- −$8,698
- Taxable loss
- −$1,111
- Est. tax savings @ 24.0%
- +$267
- After-tax cash flow
- $4,020/yr
For passive investors: Depreciation is non-cash, so a rental often shows a tax loss while cash-flowing — sheltering income. Rental losses are passive: they offset passive income freely, and up to $25,000/yr can offset ordinary (W-2) income if you actively participate and your MAGI is under $100k (phasing out to $0 by $150k); unused losses carry forward. On sale, claimed depreciation is recaptured at up to 25%, and gains may owe capital-gains tax (a 1031 exchange can defer both). Figures are a year-1 estimate at your 24.0% rate — not tax advice; consult a CPA.
Schools (NCES district)
- District
- Hudson Falls Central School District
- NCES district ID
- 3614970
- Math proficiency
- 39% ▼ -8.00%
- Reading proficiency
- 47% ▲ 6.00%
- Median HH income
- $46,019
- Composite
- 36.57/100
- National rank
- #4635
- State rank
- #486 of 590 in NY
Livability — Hudson Falls
- Score
- 69/100
- State rank
- #481
- US rank
- #8482
Category grades
Schools grade is shown separately in the Schools card above.
Census & demographics
- Census place
- Hudson Falls, NY
- Population (ZIP)
- 13,618
Population outlook (Washington County) Hauer SSP2
- Today (2025)
- 59,576 people
- By 2030
- 57,618 · -3.3%
- By 2040
- 52,751 · -11.5%
- By 2050
- 47,514 · -20.2%
- By 2075
- 35,690 · -40.1%
- By 2100
- 24,807 · -58.4%
Race, ethnicity, and origin ACS 2023
- Neighborhood character
- Predominantly White (89%)
- Race & ethnicity
- White 89% Hispanic / Latino 4% Two or more races 4%
- Common ancestry
- Lithuanian 8% Slovak 5% Estonian 3%
- Foreign-born
- 5% · Canada, Guatemala
- Languages at home
- 92% English-only · Spanish 4% Other Indo-European 2% German/W. Germanic 2%
Political lean MEDSL · Washington
- 2024 margin
- Strong R (+21.2) · D 39.4% · R 60.6%
- 2008→2024 swing
- -22.0pp toward R · 2008: 0.8pp · 2024: -21.2pp
- All cycles
- 2024: R+21.2 2020: R+15.6 2016: R+20.2 2012: D+1.6 2008: D+0.8
Not yet ingested
- Civics
- —
Market trends
- HPI YoY
- ▲ 25.92%
- Current HPI
- 331.6315
- Rent YoY
- —
- Metro
- —
- State GDP YoY
- ▲ 2.60%
- F500 in state
- 92
Industry mix (Fortune 500 HQ in NY)
| Industry | F500 HQs | Revenue |
|---|---|---|
| Financial Services | 10 | $950B |
|
||
| Consumer Goods | 9 | $162B |
|
||
| Insurance | 4 | $225B |
|
||
| Telecommunications | 2 | $144B |
|
||
| Pharmaceuticals | 2 | $112B |
|
||
| Media / Entertainment | 2 | $69B |
|
||
Price history
+550.0% since first listed5 events — show timeline
- 2026-05-21 Price Changed $299,000 Global MLS
- 2026-05-09 Listed $312,000 Global MLS
- 2026-03-28 Listing Removed — Global MLS
- 2025-12-22 Listed $325,000 Global MLS
- 1993-03-19 Sold (Public Records) $46,000 Public Records
Property tax history
+3.7%/yrLatest (2025): $3,844 · +16.2% YoY. Source: county tax records.
Cash-flow waterfall
monthlySold comps — $/sqft
last 12 mo · ≤1 miLoading sold comps…