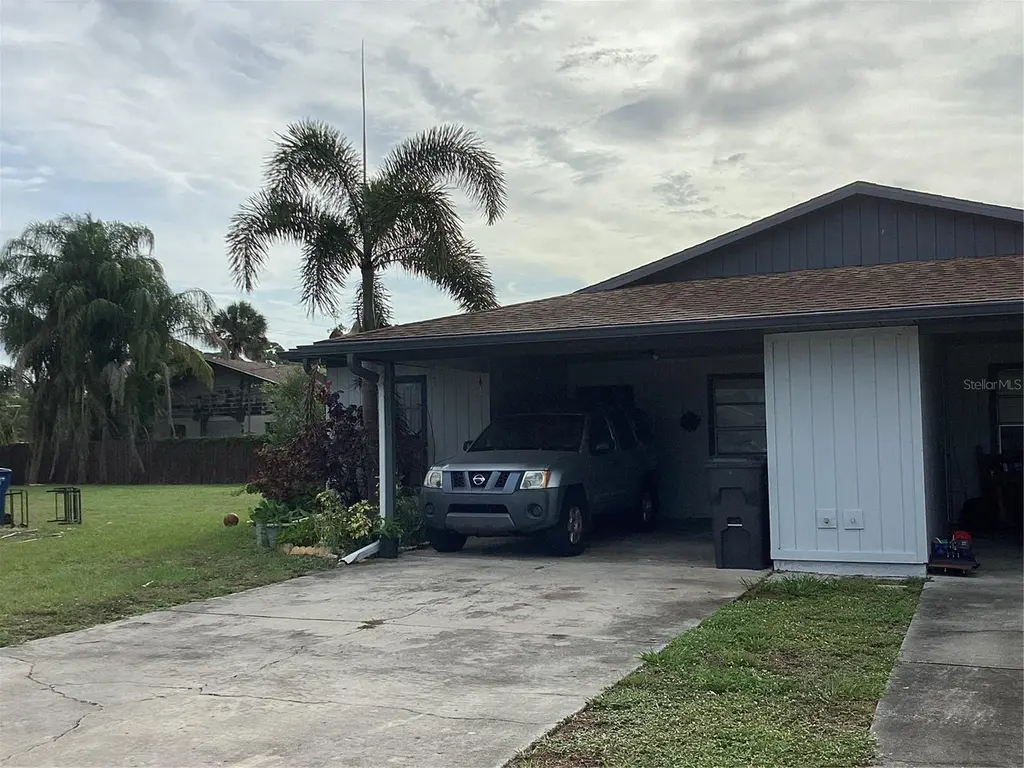
4007 78th St W · Bradenton, FL
Flood risk 5/10 · Moderate
- FEMA flood zone
- X (unshaded)
- Chance of flooding over 30 yrs
- 0.42%
- Est. flood insurance / yr
- $507 – $1,088
Fire risk 3/10 · Minor
- Est. fire insurance / yr
- $947 – $1,759
Heat risk 10/10 · Severe
- Hot days now (above 106°F)
- 7 days/yr
- Hot days in 30 yrs
- 30 days/yr
Wind risk 10/10 · Severe
- Chance of severe wind over 30 yrs
- 99.0%
Air-quality risk 3/10 · Minor
- Unhealthy air days now
- 2 days/yr
- Unhealthy air days in 30 yrs
- 2 days/yr
Risk factors via First Street. Map © Google.
Why this score? — see what drove the C grade
The composite is a weighted blend of 9 inputs, each scored 0–100. Each bar is that input's sub-score; the figure is the points it added to the 100-point composite (weight × sub-score).
- Cash flow +21.0/30.0
- ARV discount +10.8/15.0
- 1% rule +7.8/10.0
- DSCR +6.7/10.0
- Schools +4.4/10.0
- Livability +4.0/5.0
- Condition / age +2.5/5.0
- Rent growth +2.4/5.0
- Appreciation +0.0/10.0
$175,000
🖨 Deal sheet 📄 Offer letter ✓ Due diligence
Listing remarks MLS
You're going to love this place! Beautiful new kitchen with newer appliances, Ikea cabinetry, quartz counters and more, plus an indoor laundry. This charming 2/2 condo is located close to the beach, and near shopping, restaurants, and places of worship. The home features ceramic tile flooring throughout, nicely updated master bath, great closets with ample shelving for storage and a glass-enclosed, air-conditioned lanai, which could easily be used as a 3rd bedroom, office or playroom. The roof was new in 2017 and this is one of the few homes in the neighborhood with a carport. Light & bright in a quiet area of town, this condo offers economical living at a great price. Won't last long!
Key facts
- Near shopping
- Near restaurants
- Small community
Tags
Property features AI
Finance
- Other: Property type: Residential (Half Duplex); Zoning: RDD6
- Financial info: Total monthly fees: $370; Total annual fees: $4,440; Lease restrictions apply
- HOA & community: Has HOA; monthly fee of $370 (includes common area taxes and grounds maintenance); Association approval required; Buyer approval required for the community; Pets allowed with size limits
Exterior
- Parking: Carport with 1 space
- Utilities: Public water; Public sewer; Public utilities
- Home design: Residential half-duplex; One-story; Faces west
- Construction: Stucco construction; Shingle roof; Slab foundation; Built on a 0.22-acre lot
- Exterior features: Exterior lighting; Asphalt road access; Property located in county
Interior
- Kitchen: Microwave; Range; Refrigerator
- Bedrooms: 2 bedrooms
- Flooring: Ceramic tile
- Bathrooms: 2 full bathrooms
- Heating & cooling: Central heating; Central air conditioning
- Interior features: Open living room/dining room combo; Bonus room
- Laundry & utility: Laundry located in the kitchen
Neighborhood map
What this means for you Summary
Snapshot
- This is a 2-bed/2.0-bath townhouse listed at $175k.
Deal economics
- At list price, monthly cash flow is $246 ($3k/yr) — positive.
- The deal already cash-flows at list — no discount required.
- Meets the 1% rule at list price ($2k rent vs $175k).
- Cap rate 8.0% vs local median 3.6% in Bradenton — top-decile yield for the area; either an underpriced asset or a hidden risk that comps aren't pricing in. Stress-test before assuming the spread holds.
Location & tenants
- Location reads 81/100 on livability (#101 in FL, #1,528 nationally) — a professional / high-income tenant draw. Strengths: commute A+, cost of living A+, housing A+; Watch: employment D+, crime D, amenities F.
- Manatee (suburban): math 54% / reading 50% proficiency, ranked #26 of 73 in FL (top 36%) — acceptable for families but not a draw, mixed tenant base, ~2y average lease.
- Market conditions: Rents soft (-0.3%/yr); 510 active listings in the ZIP; 39 comparable units currently listed for rent nearby; rentals at typical pace (median 16d on market — plan ~3-4 weeks tenant-placement turnaround); solid renter incomes; 7,472 units permitted in Manatee County in 2024 (1,782 in 5+ unit buildings).
- This rent runs 33% of the median local income ($82k/yr) — at the standard rent-burdened threshold; future hikes will face affordability resistance.
Forward outlook
- Local home prices are declining (-3.0%/yr); year-one equity from $1k of loan paydown is wiped out by about $5k of value loss. Plan a longer hold.
- Manatee County population projected at +43% by 2050 — long-run rental-demand tailwind backs the buy-and-hold thesis.
Negotiation context
- Only 14 days on market — expect competitive offers; lowballing is unlikely to land.
- 3 sale attempts since 8y ago with the ask held roughly flat each time — persistent listings suggest the price (not the market) is what's stuck; bring a comps-based counter.
- Current owner paid $105k; list at $175k implies a 67% gain — meaningful room to come down on a strong offer.
Risks & watch-outs
- Climate carrying-cost: moderate flood risk; severe wind risk, 99% chance of damaging wind over 30y; extreme-heat days projected 7→30/yr by 2055 (HVAC capex compounding) — expect insurance premiums to compound above CPI over the hold.
Questions for the listing agent
- What does the HOA fee cover, when was the last increase, and are there any pending special assessments or reserve-fund shortfalls?
- Is there a deadline driving the sale (1031 exchange, divorce, estate, relocation)? That informs how much negotiation room exists.
- Crime grade is D in this area — have there been break-ins, vandalism, or insurance claims at this property in the last 3 years? What carrier currently insures it and at what premium?
- What's the average days-on-market for RENTAL listings here right now (not sales)? A rising rental-DOM trend means longer vacancies and softer asking-rent achievability than the comps imply.
- What's the recent tenant-quality profile in this submarket — average credit score on applications, eviction rate, late-payment / NSF rate, and stable-employment percentage? A property-management company in the area should have these aggregated.
- How much new for-sale + rental construction is in the pipeline within 1–3 miles? Heavy new supply typically softens prices + rents 12–24 months out; constrained supply supports both.
Investment metrics
- 1% rule
- 1.28% ✓
- Cap rate
- 7.98%
- Cash-on-cash
- 6.02%
- DSCR
- 1.27
- GRM
- 6.5
CMA / ARV
- ARV (on-the-fly)
- $188,650
- Comps found
- 12
Show comp detail 12 sales within ~0.75 mi
| Address | Dist | Beds/Ba | Sqft | Sold | Price | $/sf | Match |
|---|---|---|---|---|---|---|---|
| 7818 40th Avenue Dr W | 0.05mi | 2/2.0 | 1,032 (-4%) | 7mo | $154,000 | $149 | 85 |
| 3810 75th St W #112 | 0.23mi | 2/2.0 | 1,031 (-4%) | 2mo | $180,000 | $175 | 80 |
| 4168 Overture Cir | 0.28mi | 2/2.0 | 1,228 (+14%) | 4mo | $262,000 | $213 | 61 |
| 7208 29th Avenue Dr W #2264 | 0.63mi | 2/2.0 | 1,130 (+5%) | 2mo | $190,000 | $168 | 60 |
| 7301 29th Avenue Dr W #310 | 0.61mi | 2/2.0 | 1,007 (-7%) | 1mo | $197,000 | $196 | 60 |
| 7201 29th Avenue Dr W #306 | 0.63mi | 2/2.0 | 1,123 (+4%) | 6mo | $210,000 | $187 | 59 |
| 2814 72nd Street Ct W #2814 | 0.70mi | 2/2.0 | 1,130 (+5%) | 1mo | $153,000 | $135 | 58 |
| 4083 Overture Cir | 0.38mi | 2/2.0 | 1,228 (+14%) | 2mo | $225,000 | $183 | 58 |
| 4119 Overture Cir #364 | 0.35mi | 2/2.0 | 1,228 (+14%) | 4mo | $270,000 | $220 | 57 |
| 7201 29th Avenue Dr W #307 | 0.63mi | 2/2.0 | 1,207 (+12%) | 3mo | $200,000 | $166 | 48 |
| 2727 75th St W Unit 7A14 | 0.74mi | 2/1.5 | 925 (-14%) | 2mo | $149,000 | $161 | 38 |
| 2727 75th St W Unit 1AF | 0.74mi | 2/2.0 | 925 (-14%) | 6mo | $158,000 | $171 | 37 |
Match score weights: distance 35% · size 25% · config 20% · recency 20%. Top-matched comps best support the ARV.
Projected returns pro-forma
-3.0% appreciation · 0.0% rent growth · sell at horizon
- IRR
- -11.1%
- Equity multiple
- 0.61×
- Total profit
- $-19,064
- Equity at exit
- $26,093
- IRR
- -8.2%
- Equity multiple
- 0.57×
- Total profit
- $-20,962
- Equity at exit
- $15,131
Cash invested: $49,000 (down + closing). Projections, not guarantees.
Landlord ↔ Tenant lean methodology
- Overall (STATE)
- 87 Strongly Landlord-Friendly
- State Florida
- 87 Strongly Landlord-Friendly · R+3
- County
- — inherits STATE
- City
- — inherits STATE
ZIP-level market 34209
- Rents YoY
- -0.3%
- Active inventory
- 510
- Price-to-rent
- 6.5×
Monthly cashflow live
- Estimated rent
- $2,247 high interval (Pro) →
- Mortgage (P&I)
- −$918
- Tax from tax record
- −$169 /mo · $2,024/yr
- Insurance
- −$73
- HOA
- −$370
- Vacancy / Maint / Mgmt
- −$472
- Net cashflow
- $246
Break-even live
UW: 25.0% down · 7.5% · 30yr · 1.5% tax · 5.0% vac · 8.0% maint · 8.0% mgmt
Financing live
Cash to close
- Down payment
- $43,750
- Closing costs
- $5,250
- Reserves months
- —
- Total cash needed
- —
Loan-product check · same deal, 3 products live
Conventional
25% down · 7.5% · 30yr
- Down + closing
- —
- Monthly P&I
- —
- Monthly cashflow
- —
- DSCR
- —
- Eligible?
- —
Personal DTI + credit; lowest rate.
DSCR
20% down · 8.5% · 30yr
- Down + closing
- —
- Monthly P&I
- —
- Monthly cashflow
- —
- DSCR
- —
- Eligible?
- —
No personal income docs; deal must DSCR.
Hard money
10% down · 12.0% · 12mo
- Down + closing
- —
- Monthly P&I
- —
- Monthly cashflow
- —
- DSCR
- —
- Eligible?
- —
Short-term bridge; refi at stabilization.
Rent comps 39 comps
| Address | Beds | Baths | Sqft | Rent | $/sqft | DOM | Units | Dist |
|---|---|---|---|---|---|---|---|---|
| 4005 78th St W Bradenton, FL | 3.0 | 2.0 | 1000 | $1,895 | $1.90 | 3d | 1 | 0.01mi |
| 7333 Skybird Rd Bradenton, FL | 3.0 | 2.0 | 1277 | $3,500 | $2.74 | 23d | 1 | 0.22mi |
| 4325 80th St W Bradenton, FL | 3.0 | 1.5 | 1000 | $2,200 | $2.20 | 23d | 1 | 0.25mi |
| 4196 Overture Cir Unit 4196 Bradenton, FL | 3.0 | 2.0 | 1277 | $2,300 | $1.80 | 3d | 1 | 0.28mi |
| 4122 Overture Cir #533 Bradenton, FL | 3.0 | 2.0 | 1381 | $2,900 | $2.10 | 23d | 1 | 0.34mi |
| 4037 Overture Cir Unit 4037 Bradenton, FL | 3.0 | 2.0 | 1381 | $2,195 | $1.59 | 23d | 1 | 0.36mi |
| 4005 Overture Cir Unit 4005 Bradenton, FL | 3.0 | 2.0 | 1381 | $2,700 | $1.96 | 23d | 1 | 0.36mi |
| 7202 Hamilton Rd Unit 7202 Bradenton, FL | 3.0 | 2.0 | 1277 | $2,250 | $1.76 | 15d | 1 | 0.36mi |
| 4063 Overture Cir Bradenton, FL | 3.0 | 2.0 | 1277 | $2,400 | $1.88 | 23d | 1 | 0.37mi |
| 4501 71st St W Bradenton, FL | 1.0–2.0 | 1.0–2.0 | 850 | $1,680 | $1.98 | 1d | 28 | 0.52mi |
| 6711 45th Ave W Unit A Bradenton, FL | 2.0 | 2.0 | 1100 | $1,700 | $1.55 | 15d | 1 | 0.64mi |
| 2727 75th St W Bradenton, FL | 1.0–2.0 | 1.5 | 835 | $1,700 | $2.04 | 3d | 4 | 0.74mi |
| 6709 35th Ave W Unit 1346494P Bradenton, FL | 3.0 | 2.0 | 1227 | $4,527 | $3.69 | 15d | 1 | 0.74mi |
| 4161 66th Street Cir W Bradenton, FL | 2.0 | 2.0 | 1044 | $1,800 | $1.72 | 15d | 1 | 0.75mi |
| 4209 66th Street Cir W Bradenton, FL | 2.0 | 2.0 | 1044 | $2,900 | $2.78 | 23d | 1 | 0.75mi |
| 2724 72nd St W Unit 2010 Bradenton, FL | 2.0 | 2.0 | 942 | $1,950 | $2.07 | 2d | 1 | 0.77mi |
| 4512 86th Street Ct W Unit A Bradenton, FL | 2.0 | 1.0 | 755 | $1,500 | $1.99 | 23d | 1 | 0.79mi |
| 4112 66th Street Cir W Bradenton, FL | 2.0 | 2.0 | 1100 | $1,960 | $1.78 | 19d | 1 | 0.80mi |
| 4116 62nd St W Bradenton, FL | 2.0 | 2.0 | 840 | $1,650 | $1.96 | 3d | 1 | 0.92mi |
| 2914 64th St W Bradenton, FL | 2.0 | 2.0 | 1135 | $2,025 | $1.78 | 23d | 1 | 0.93mi |
| 4601 66th St W Bradenton, FL | 3.0 | 1.0–2.0 | 917 | $2,065 | $2.25 | 1d | 24 | 0.94mi |
| 2926 63rd St W Bradenton, FL | 2.0 | 2.0 | 946 | $2,100 | $2.22 | 3d | 1 | 1.02mi |
| 2107 Palma Sola Blvd #8 Bradenton, FL | 2.0 | 2.0 | 1056 | $1,850 | $1.75 | 15d | 1 | 1.03mi |
| 5907 36th Ave Cir W #5907 Bradenton, FL | 2.0 | 2.0 | 937 | $2,800 | $2.99 | 23d | 1 | 1.09mi |
| 4572 Red Maple Rd #901 Bradenton, FL | 2.0 | 2.0 | 1224 | $1,600 | $1.31 | 23d | 1 | 1.10mi |
| 4118 59th St W Bradenton, FL | 2.0 | 1.0 | 756 | $1,800 | $2.38 | 15d | 1 | 1.12mi |
| 6914 20th Ave W Bradenton, FL | 2.0 | 2.0 | 1383 | $2,795 | $2.02 | 15d | 1 | 1.19mi |
| 5909 30th Ave W Bradenton, FL | 1.0–2.0 | 1.0–2.0 | 788 | $1,670 | $2.12 | 1d | 6 | 1.21mi |
| 6304 Pointe West Blvd Unit A309 Bradenton, FL | 2.0 | 2.0 | 1042 | $1,795 | $1.72 | 10d | 1 | 1.29mi |
| 5933 28th Ave W Bradenton, FL | 1.0–2.0 | 1.0–2.0 | 945 | $2,013 | $2.13 | 1d | 6 | 1.29mi |
| 6415 21st Ave W Bradenton, FL | 1.0–2.0 | 1.0–2.0 | 1150 | $1,896 | $1.65 | 3d | 5 | 1.32mi |
| 4880 51st St W Bradenton, FL | 1.0–4.0 | 1.0–3.0 | 1019 | $1,527 | $1.50 | 3d | 11 | 1.36mi |
| 4813 Independence Dr Bradenton, FL | 2.0 | 2.0 | 1147 | $1,695 | $1.48 | 23d | 1 | 1.38mi |
| 9819 Hernando Ct Unit 29-A Bradenton, FL | 2.0 | 2.0 | 1078 | $2,500 | $2.32 | 23d | 1 | 1.39mi |
| 4112 Cape Vista Dr Bradenton, FL | 3.0 | 2.0 | 1450 | $3,495 | $2.41 | 23d | 1 | 1.40mi |
| 4850 51st St W Bradenton, FL | 1.0–2.0 | 1.0–2.0 | 800 | $1,750 | $2.19 | 3d | 2 | 1.40mi |
| 4850 51st St W Bradenton, FL | 1.0–2.0 | 1.0–2.0 | 800 | $1,750 | $2.19 | 14d | 3 | 1.40mi |
| 4782 Independence Dr #4782 Bradenton, FL | 2.0 | 2.0 | 1188 | $2,000 | $1.68 | 23d | 1 | 1.42mi |
| 4765 Independence Dr Bradenton, FL | 2.0 | 2.0 | 1350 | $4,300 | $3.19 | 23d | 1 | 1.43mi |
HOA detail
- Monthly dues
- $370 · $4,440/yr
Listing history 11 events
-
2026-06-18days on market $175,000 Active 14 DOM
-
2026-06-17days on market $175,000 Active 13 DOM
-
2026-06-16days on market $175,000 Active 12 DOM
-
2026-06-15days on market $175,000 Active 11 DOM
-
2026-06-13days on market $175,000 Active 9 DOM
-
2026-06-13days on market $175,000 Active 8 DOM
-
2026-06-10days on market $175,000 Active 6 DOM
-
2026-06-09days on market $175,000 Active 5 DOM
-
2026-06-08days on market $175,000 Active 4 DOM
-
2026-06-07remarks 553-char remark
-
2026-06-07$175,000 Active 3 DOM
ⓘ Source: listings_history table (triggers on properties + properties_extension) + one-shot
backfill from property_details.listing_events for pre-trigger history.
Tax reassessment forecast FL · Resets to sale price
- Current annual tax
- $2,024 · $169/mo
- Projected year-2 tax
- $2,024 · $169/mo
- Expected delta
- $0/yr ($0/mo · 0.0%)
ⓘ Screening estimate from a state-policy table — verify with the county assessor before closing.
Climate risk First Street
- Flood 5/10 Major FEMA zone X (unshaded) · 42% chance over 30 yrs
- Wildfire 3/10 Moderate
- Heat 10/10 Extreme 7 d/yr ≥106°F today · 30 d/yr by 30 yrs out
- Wind 10/10 Extreme 99% chance of damaging wind over 30 yrs
- Air quality 3/10 Moderate 2 unhealthy d/yr today · 2 by 30 yrs out
Nearby sold comps map
Loading sold comps map…
Walkable amenities ~0.75 mi
Loading nearby amenities…
Taxation est. · year 1
- Rental income
- $26,962
- − Mortgage interest
- −$9,803
- − Property taxes
- −$2,024
- − Insurance
- −$875
- − Repairs & maintenance
- −$2,157
- − Management
- −$2,157
- − HOA
- −$4,440
- − Depreciation
- −$5,091
- Taxable income
- $415
- Est. tax owed @ 24.0%
- −$100
- After-tax cash flow
- $2,849/yr
For passive investors: Depreciation is non-cash, so a rental often shows a tax loss while cash-flowing — sheltering income. Rental losses are passive: they offset passive income freely, and up to $25,000/yr can offset ordinary (W-2) income if you actively participate and your MAGI is under $100k (phasing out to $0 by $150k); unused losses carry forward. On sale, claimed depreciation is recaptured at up to 25%, and gains may owe capital-gains tax (a 1031 exchange can defer both). Figures are a year-1 estimate at your 24.0% rate — not tax advice; consult a CPA.
Schools (NCES district)
- District
- Manatee
- NCES district ID
- 1201230
- Math proficiency
- 54% ▼ -6.00%
- Reading proficiency
- 50% ▼ -2.00%
- Median HH income
- $49,607
- Composite
- 44.43/100
- National rank
- #2806
- State rank
- #26 of 73 in FL
Livability — Bradenton
- Score
- 81/100
- State rank
- #101
- US rank
- #1528
Category grades
Schools grade is shown separately in the Schools card above.
Census & demographics
- County
- Manatee County · 416,364 people
- City population
- 227,091
- Metro
- North Port-Sarasota-Bradenton, FL
- Population (ZIP)
- 33,224
- Household income
- $81,728
- Rent vs Own
- Severe rent burden
- 1126.0
Population outlook (Manatee County) Hauer SSP2
- Today (2025)
- 447,342 people
- By 2030
- 488,911 · +9.3%
- By 2040
- 567,934 · +27.0%
- By 2050
- 637,995 · +42.6%
- By 2075
- 781,970 · +74.8%
- By 2100
- 848,272 · +89.6%
Race, ethnicity, and origin ACS 2023
- Neighborhood character
- Predominantly White (84%)
- Race & ethnicity
- White 84% Hispanic / Latino 11% Two or more races 6% Black 2% Asian 1%
- Hispanic origin (detail)
- Puerto Rican 4% Cuban 3%
- Common ancestry
- Romanian 3% Slovak 3% Lithuanian 3%
- Foreign-born
- 9% · Canada, Jamaica, China
- Languages at home
- 90% English-only · Spanish 6% Russian/Polish/Slavic 1% Other Indo-European 1%
Political lean MEDSL · Manatee
- 2024 margin
- Strong R (+23.5) · D 37.9% · R 61.4%
- 2008→2024 swing
- -16.5pp toward R · 2008: -7.0pp · 2024: -23.5pp
- All cycles
- 2024: R+23.5 2020: R+16.1 2016: R+17.1 2012: R+12.5 2008: R+7.0
Not yet ingested
- Civics
- —
Market trends
- HPI YoY
- ▼ -360.34%
- Current HPI
- 320.0061
- Rent YoY
- ▼ -0.30%
- Metro
- North Port-Sarasota-Bradenton, FL
- State GDP YoY
- ▲ 3.28%
- F500 in state
- 36
Industry mix (Fortune 500 HQ in FL)
| Industry | F500 HQs | Revenue |
|---|---|---|
| Industrial Technology | 2 | $29B |
|
||
| Insurance | 2 | $17B |
|
||
| Retail | 1 | $60B |
|
||
| Technology Distribution | 1 | $58B |
|
||
| Homebuilding | 1 | $35B |
|
||
| Technology Manufacturing | 1 | $35B |
|
||
Price history
+253.5% since first listed8 events — show timeline
- 2026-06-04 Listed $175,000 Stellar MLS as Distributed by MLS Grid
- 2018-09-17 Sold (Public Records) $104,900 Public Records
- 2018-09-05 Sold (MLS) $104,900 Stellar MLS as Distributed by MLS Grid
- 2018-08-02 Pending — Stellar MLS as Distributed by MLS Grid
- 2018-07-27 Relisted — Stellar MLS as Distributed by MLS Grid
- 2018-07-26 Pending — Stellar MLS as Distributed by MLS Grid
- 2018-07-24 Listed $104,900 Stellar MLS as Distributed by MLS Grid
- 1998-11-16 Sold (Public Records) $49,500 Public Records
Property tax history
+21.9%/yrLatest (2025): $2,024 · +4.5% YoY. Source: county tax records.
Cash-flow waterfall
monthlySold comps — $/sqft
last 12 mo · ≤1 miLoading sold comps…