7115 Phillips St · Houston, TX
Flood risk 4/10 · Minor
- FEMA flood zone
- X (unshaded)
- Chance of flooding over 30 yrs
- 0.21%
- Est. flood insurance / yr
- $507 – $1,088
Fire risk 1/10 · Minimal
- Est. fire insurance / yr
- $1,222 – $2,270
Heat risk 8/10 · Major
- Hot days now (above 109°F)
- 6 days/yr
- Hot days in 30 yrs
- 20 days/yr
Wind risk 9/10 · Severe
- Chance of severe wind over 30 yrs
- 99.0%
Air-quality risk 3/10 · Minor
- Unhealthy air days now
- 3 days/yr
- Unhealthy air days in 30 yrs
- 4 days/yr
Risk factors via First Street. Map © Google.
Why this score? — see what drove the C- grade
The composite is a weighted blend of 9 inputs, each scored 0–100. Each bar is that input's sub-score; the figure is the points it added to the 100-point composite (weight × sub-score).
- Cash flow +21.6/30.0
- DSCR +6.9/10.0
- 1% rule +6.0/10.0
- ARV discount +5.7/15.0
- Livability +3.7/5.0
- Condition / age +2.5/5.0
- Rent growth +2.2/5.0
- Schools +1.5/10.0
- Appreciation +0.0/10.0
$124,999
🖨 Deal sheet 📄 Offer letter ✓ Due diligence
Listing remarks
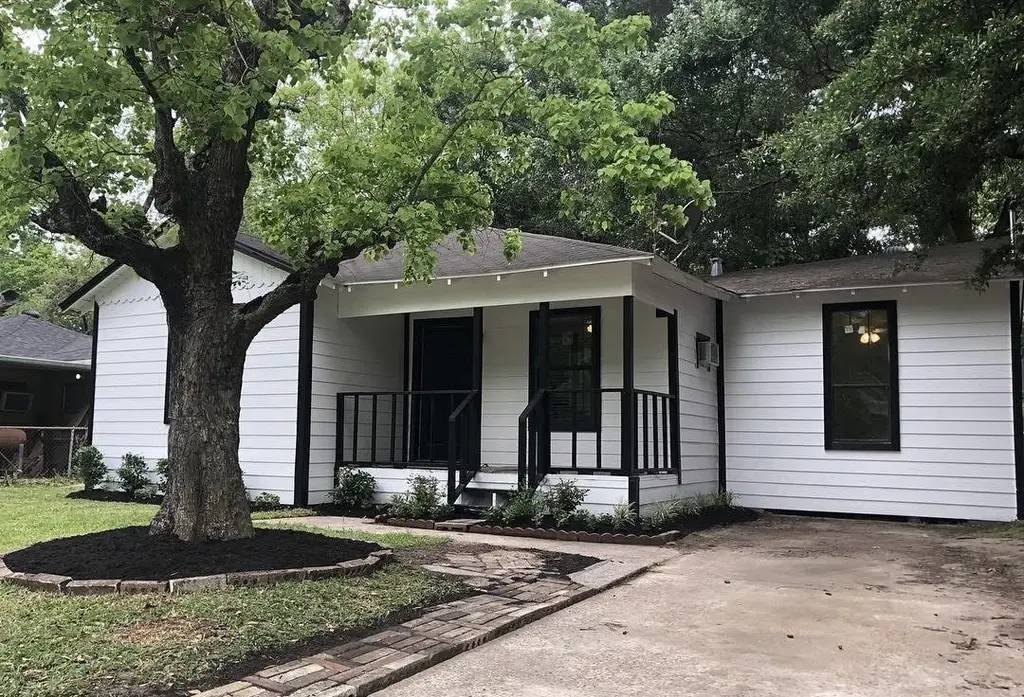
Charming single-story home located at 7115 Phillips Street in Houston's Fairbanks Oaks subdivision. Built in 1950, this property offers approximately 798 sq. ft. of living space on a 5,135 sq. ft. lot. The home features a functional layout, making it ideal as a starter home, rental property, or renovation opportunity. The spacious lot provides room for outdoor use, expansion, or additional parking. Situated in an established neighborhood in Northwest Houston, the property offers convenient access to major roads, shopping, and local amenities. Great opportunity for investors or buyers looking to add value in a growing area.
Key facts
- Convenient access
- Spacious lot
- Single-story home
Tags
Property features AI
Finance
- Financial info: Lease not considered
Exterior
- Parking: No parking
- Security: Security gate
- Utilities: Public water; Public sewer
- Home design: Residential property; Full ownership; Single-story entry (first floor rooms listed)
- Construction: Wood siding; Block foundation; Composition roof; Built in 1950
- Exterior features: Concrete road surface; Lot features: Other
Interior
- Kitchen: Microwave
- Bedrooms: Primary bedroom (first floor, 12x18); Bedroom (first floor, 12x13); Bedroom (first floor, 12x13)
- Flooring: Vinyl
- Bathrooms: 1 full bathroom
- Heating & cooling: Window unit heating; Window unit cooling
- Interior features: Kitchen/dining combo; Security gate
- Laundry & utility: Electric dryer hookup
Neighborhood map
What this means for you Summary
Snapshot
- This is a 2-bed/1.0-bath single-family listed at $125k.
Deal economics
- At list price, monthly cash flow is $189 ($2k/yr) — positive.
- The deal already cash-flows at list — no discount required.
- Meets the 1% rule at list price ($1k rent vs $125k).
- Recommended offer: $121k (3.0% below list) — sets the bar for market timing.
- Cap rate 8.1% vs local median 3.2% in Houston — top-decile yield for the area; either an underpriced asset or a hidden risk that comps aren't pricing in. Stress-test before assuming the spread holds.
Location & tenants
- Location reads 74/100 on livability (#184 in TX, #4,771 nationally) — a middle-class / working-renter tenant base. Strengths: amenities A+, cost of living A+, housing A+; Watch: crime F.
- Aldine ISD (suburban): math 16% / reading 21% proficiency, ranked #790 of 826 in TX (top 96%) — low school quality limits family demand, transient renter base, plan for 1-2y turnover; 79% free/reduced lunch — lower-income household profile, screen leases tightly.
- Zoned schools: Anderson Academy (math 18% / reading 16%, grade F, #3,836 of 4,322 statewide, top 91%, 677 students, 94% FRL); Drew Academy (math 14% / reading 28%, grade F, #1,387 of 1,662 statewide, top 85%, 382 students, 91% FRL); Carver H S For Applied Tech/Engineering/Arts (math 25% / reading 32%, grade F, #1,157 of 1,632 statewide, top 72%, 755 students, 86% FRL).
- Market conditions: Rents soft (-1.0%/yr); 468 active listings in the ZIP; 9 comparable units currently listed for rent nearby; rentals at typical pace (median 24d on market — plan ~3-4 weeks tenant-placement turnaround); 44% of comp listings sitting > 30 days — soft ceiling on asking rent; 29,883 units permitted in Harris County in 2024 (8,621 in 5+ unit buildings).
- This rent runs 30% of the median local income ($54k/yr) — at the standard rent-burdened threshold; future hikes will face affordability resistance.
Forward outlook
- Local home prices are declining (-3.0%/yr); year-one equity from $864 of loan paydown is wiped out by about $4k of value loss. Plan a longer hold.
- Harris County population projected at +47% by 2050 — long-run rental-demand tailwind backs the buy-and-hold thesis.
Negotiation context
- It's been on market 54 days — a 3% lower offer ($121k) is reasonable based on typical stale-listing flexibility.
- 5 sale attempts since 10y ago; this cycle's ask has dropped $10k (7%) from the opening price — seller is motivated, your offer sets the floor, not the list.
Risks & watch-outs
- Watch-outs: built in 1950 — expect roof / HVAC / electrical / plumbing capex.
- Climate carrying-cost: severe wind risk, 99% chance of damaging wind over 30y; extreme-heat days projected 6→20/yr by 2055 (HVAC capex compounding) — expect insurance premiums to compound above CPI over the hold.
Questions for the listing agent
- It's been on market 54 days. Have you received any prior offers? Is the seller open to a 3% concession, seller financing, or rate buy-down credit?
- Built in 1950 — when were the roof, HVAC, electrical panel, plumbing, and water heater last replaced?
- Is there a deadline driving the sale (1031 exchange, divorce, estate, relocation)? That informs how much negotiation room exists.
- Schools are D-rated, which usually means shorter tenancies and higher turnover. Who's the typical renter profile here, and what's been the actual vacancy rate?
- Crime grade is F in this area — have there been break-ins, vandalism, or insurance claims at this property in the last 3 years? What carrier currently insures it and at what premium?
- What's the average days-on-market for RENTAL listings here right now (not sales)? A rising rental-DOM trend means longer vacancies and softer asking-rent achievability than the comps imply.
- What's the recent tenant-quality profile in this submarket — average credit score on applications, eviction rate, late-payment / NSF rate, and stable-employment percentage? A property-management company in the area should have these aggregated.
- How much new for-sale + rental construction is in the pipeline within 1–3 miles? Heavy new supply typically softens prices + rents 12–24 months out; constrained supply supports both.
Investment metrics
- 1% rule
- 1.10% ✓
- Cap rate
- 8.11%
- Cash-on-cash
- 6.48%
- DSCR
- 1.29
- GRM
- 7.6
CMA / ARV
- ARV (median comp)
- $120,300
- List price
- $124,999
- Delta
- 3.91%
- Verdict
- FAIR
- Comps
- 20 within 1.0 mi
Show comp detail 3 sales within ~0.75 mi
| Address | Dist | Beds/Ba | Sqft | Sold | Price | $/sf | Match |
|---|---|---|---|---|---|---|---|
| 7331 Phillips St | 0.09mi | 2/1.0 | 848 (+6%) | 0mo | $97,000 | $114 | 85 |
| 2409 Areba St | 0.58mi | 3/1.0 (+1) | 906 (+14%) | 13mo | $135,000 | $149 | 35 |
| 2249 Wilburforce St | 0.65mi | 2/1.0 | 888 (+11%) | 22mo | $110,000 | $124 | 33 |
Match score weights: distance 35% · size 25% · config 20% · recency 20%. Top-matched comps best support the ARV.
Projected returns pro-forma
-3.0% appreciation · 0.0% rent growth · sell at horizon
- IRR
- -9.9%
- Equity multiple
- 0.65×
- Total profit
- $-12,213
- Equity at exit
- $18,638
- IRR
- -5.4%
- Equity multiple
- 0.70×
- Total profit
- $-10,560
- Equity at exit
- $10,808
Cash invested: $35,000 (down + closing). Projections, not guarantees.
Landlord ↔ Tenant lean methodology
- Overall (STATE)
- 87 Strongly Landlord-Friendly
- State Texas
- 87 Strongly Landlord-Friendly · R+5
- County
- — inherits STATE
- City
- — inherits STATE
ZIP-level market 77088
- Home prices YoY
- -23.2%
- Rents YoY
- -1.0%
- Active inventory
- 468
- Price-to-rent
- 7.6×
Monthly cashflow live
- Estimated rent
- $1,377 high interval (Pro) →
- Mortgage (P&I)
- −$656
- Tax from tax record
- −$191 /mo · $2,294/yr
- Insurance
- −$52
- HOA
- −$0
- Vacancy / Maint / Mgmt
- −$289
- Net cashflow
- $189
Break-even live
UW: 25.0% down · 7.5% · 30yr · 1.5% tax · 5.0% vac · 8.0% maint · 8.0% mgmt
Financing live
Cash to close
- Down payment
- $31,250
- Closing costs
- $3,750
- Reserves months
- —
- Total cash needed
- —
Loan-product check · same deal, 3 products live
Conventional
25% down · 7.5% · 30yr
- Down + closing
- —
- Monthly P&I
- —
- Monthly cashflow
- —
- DSCR
- —
- Eligible?
- —
Personal DTI + credit; lowest rate.
DSCR
20% down · 8.5% · 30yr
- Down + closing
- —
- Monthly P&I
- —
- Monthly cashflow
- —
- DSCR
- —
- Eligible?
- —
No personal income docs; deal must DSCR.
Hard money
10% down · 12.0% · 12mo
- Down + closing
- —
- Monthly P&I
- —
- Monthly cashflow
- —
- DSCR
- —
- Eligible?
- —
Short-term bridge; refi at stabilization.
Rent comps 9 comps
| Address | Beds | Baths | Sqft | Rent | $/sqft | DOM | Units | Dist |
|---|---|---|---|---|---|---|---|---|
| 1825 W Little York Rd Houston, TX | 2.0 | 1.0 | 787 | $880 | $1.12 | 43d | 1 | 0.17mi |
| 2432 W Little York Rd Houston, TX | 1.0 | 1.0 | 600 | $995 | $1.66 | 43d | 1 | 0.63mi |
| 2602 Dalview St Unit B Houston, TX | 2.0 | 1.0 | 800 | $1,400 | $1.75 | 43d | 1 | 0.89mi |
| 1464 Ferguson Way Houston, TX | 2.0 | 3.0 | 850 | $1,850 | $2.18 | 43d | 1 | 0.93mi |
| 1010 Junell St Unit A Houston, TX | 3.0 | 2.0 | 1040 | $1,550 | $1.49 | 24d | 1 | 0.98mi |
| 7200 T C Jester Blvd Houston, TX | 1.0–3.0 | 1.0–2.0 | 970 | $1,188 | $1.22 | 21d | 9 | 1.16mi |
| 7200 T C Jester Blvd Houston, TX | 1.0–3.0 | 1.0–2.0 | 1102 | $1,275 | $1.16 | 2d | 8 | 1.16mi |
| 929 Marjorie St Unit 1060806P Houston, TX | 3.0 | 2.0 | 1076 | $3,091 | $2.87 | 7d | 1 | 1.21mi |
| 1200 W Tidwell Rd Houston, TX | 2.0–3.0 | 1.0–2.0 | 938 | $1,050 | $1.12 | 2d | 12 | 1.29mi |
Listing history 41 events
-
2026-06-18days on market $124,999 Active 54 DOM
-
2026-06-17days on market $124,999 Active 53 DOM
-
2026-06-16days on market $124,999 Active 52 DOM
-
2026-06-15days on market $124,999 Active 51 DOM
-
2026-06-13days on market $124,999 Active 49 DOM
-
2026-06-13days on market $124,999 Active 48 DOM
-
2026-06-09days on market $124,999 Active 45 DOM
-
2026-06-08days on market $124,999 Active 44 DOM
-
2026-06-07days on market $124,999 Active 43 DOM
-
2026-06-04days on market $124,999 Active 40 DOM
-
2026-06-03days on market $124,999 Active 39 DOM
-
2026-06-02days on market $124,999 Active 38 DOM
-
2026-06-01days on market $124,999 Active 37 DOM
-
2026-05-31days on market $124,999 Active 36 DOM
-
2026-05-05price $124,999 632-char remark
-
2026-04-17$135,000 Active 632-char remark
-
2019-03-18historical
-
2019-02-23price $92,000
-
2018-12-17price $98,000
-
2018-12-17status Active
-
2018-12-11status Pending, Continue to Show
-
2018-12-10status Pending
-
2018-11-29status Option Pending
-
2018-10-29price $103,900
-
2018-10-05price $105,000
-
2018-10-05price $101,000
-
2018-10-05price $105,900
-
2018-09-11price $107,900
-
2018-08-16price $109,900
-
2018-07-13status Active
-
2018-07-06status Pending
-
2018-06-27status Option Pending
-
2018-06-01price $114,900
-
2018-04-18$118,000 Active
-
2018-04-17soldstatus
-
2017-02-03historical
-
2016-08-09price $95,000
-
2016-08-08$75,000 Active
-
2015-10-30soldstatus
-
2007-05-07soldstatus
-
2000-09-07soldstatus
ⓘ Source: listings_history table (triggers on properties + properties_extension) + one-shot
backfill from property_details.listing_events for pre-trigger history.
Tax reassessment forecast TX · Resets to sale price
- Current annual tax
- $2,294 · $191/mo
- Projected year-2 tax
- $2,294 · $191/mo
- Expected delta
- $0/yr ($0/mo · 0.0%)
ⓘ Screening estimate from a state-policy table — verify with the county assessor before closing.
Climate risk First Street
- Flood 4/10 Moderate FEMA zone X (unshaded) · 21% chance over 30 yrs
- Wildfire 1/10 Low
- Heat 8/10 Severe 6 d/yr ≥109°F today · 20 d/yr by 30 yrs out
- Wind 9/10 Extreme 99% chance of damaging wind over 30 yrs
- Air quality 3/10 Moderate 3 unhealthy d/yr today · 4 by 30 yrs out
Nearby sold comps map
Loading sold comps map…
Walkable amenities ~0.75 mi
Loading nearby amenities…
Taxation est. · year 1
- Rental income
- $16,522
- − Mortgage interest
- −$7,002
- − Property taxes
- −$2,294
- − Insurance
- −$625
- − Repairs & maintenance
- −$1,322
- − Management
- −$1,322
- − Depreciation
- −$3,636
- Taxable income
- $322
- Est. tax owed @ 24.0%
- −$77
- After-tax cash flow
- $2,190/yr
For passive investors: Depreciation is non-cash, so a rental often shows a tax loss while cash-flowing — sheltering income. Rental losses are passive: they offset passive income freely, and up to $25,000/yr can offset ordinary (W-2) income if you actively participate and your MAGI is under $100k (phasing out to $0 by $150k); unused losses carry forward. On sale, claimed depreciation is recaptured at up to 25%, and gains may owe capital-gains tax (a 1031 exchange can defer both). Figures are a year-1 estimate at your 24.0% rate — not tax advice; consult a CPA.
Schools (NCES district)
- District
- Aldine ISD
- NCES district ID
- 4807710
- Math proficiency
- 16% ▼ -23.00%
- Reading proficiency
- 21% ▼ -11.00%
- Median HH income
- $37,081
- Composite
- 15.42/100
- National rank
- #9317
- State rank
- #790 of 826 in TX
Livability — Houston
- Score
- 74/100
- State rank
- #184
- US rank
- #4771
Category grades
Schools grade is shown separately in the Schools card above.
Census & demographics
- Census place
- Houston, TX
- County
- Harris County · 4,702,590 people
- City population
- 3,226,434
- Metro
- Houston-The Woodlands-Sugar Land, TX
- Population (ZIP)
- 57,047
- Household income
- $54,411
- Rent vs Own
- Severe rent burden
- 2294.0
Population outlook (Harris County) Hauer SSP2
- Today (2025)
- 5,571,493 people
- By 2030
- 6,089,821 · +9.3%
- By 2040
- 7,142,806 · +28.2%
- By 2050
- 8,185,864 · +46.9%
- By 2075
- 10,574,329 · +89.8%
- By 2100
- 12,109,958 · +117.4%
Race, ethnicity, and origin ACS 2023
- Neighborhood character
- Diverse neighborhood (Simpson 0.59)
- Race & ethnicity
- Hispanic / Latino 52% Black 37% Two or more races 18% White 6% Asian 4%
- Hispanic origin (detail)
- Mexican 36%
- Common ancestry
- Lithuanian 1%
- Foreign-born
- 25% · Canada, Vietnam, China
- Languages at home
- 49% English-only · Spanish 47% Vietnamese 3%
Political lean MEDSL · Harris
- 2024 margin
- Lean D (+5.5) · D 52.0% · R 46.4% · Other 1.6%
- 2008→2024 swing
- +3.9pp toward D · 2008: 1.6pp · 2024: 5.5pp
- All cycles
- 2024: D+5.5 2020: D+13.3 2016: D+12.4 2012: D+0.1 2008: D+1.6
Not yet ingested
- Civics
- —
Market trends
- HPI YoY
- ▼ -98.37%
- Current HPI
- 325.0499
- Rent YoY
- ▼ -1.01%
- Metro
- Houston-The Woodlands-Sugar Land, TX
- State GDP YoY
- ▲ 3.95%
- F500 in state
- 110
Industry mix (Fortune 500 HQ in TX)
| Industry | F500 HQs | Revenue |
|---|---|---|
| Energy | 16 | $1,198B |
|
||
| Technology | 5 | $198B |
|
||
| Engineering / Construction | 4 | $72B |
|
||
| Energy Services | 3 | $60B |
|
||
| Utilities | 3 | $41B |
|
||
| Healthcare | 2 | $330B |
|
||
Price history
+66.7% since first listed27 events — show timeline
- 2026-05-05 Price Changed $124,999 HARMLS
- 2026-04-17 Listed $135,000 HARMLS
- 2019-03-18 Listing Removed — HARMLS
- 2019-02-23 Price Changed $92,000 HARMLS
- 2018-12-17 Price Changed $98,000 HARMLS
- 2018-12-17 Relisted — HARMLS
- 2018-12-11 Pending — HARMLS
- 2018-12-10 Pending — HARMLS
- 2018-11-29 Pending — HARMLS
- 2018-10-29 Price Changed $103,900 HARMLS
- 2018-10-05 Price Changed $105,000 HARMLS
- 2018-10-05 Price Changed $101,000 HARMLS
- 2018-10-05 Price Changed $105,900 HARMLS
- 2018-09-11 Price Changed $107,900 HARMLS
- 2018-08-16 Price Changed $109,900 HARMLS
- 2018-07-13 Relisted — HARMLS
- 2018-07-06 Pending — HARMLS
- 2018-06-27 Pending — HARMLS
- 2018-06-01 Price Changed $114,900 HARMLS
- 2018-04-18 Listed $118,000 HARMLS
- 2018-04-17 Sold (Public Records) — Public Records
- 2017-02-03 Listing Removed — HARMLS
- 2016-08-09 Price Changed $95,000 HARMLS
- 2016-08-08 Listed $75,000 HARMLS
- 2015-10-30 Sold (Public Records) — Public Records
- 2007-05-07 Sold (Public Records) — Public Records
- 2000-09-07 Sold (Public Records) — Public Records
Property tax history
+4.5%/yrLatest (2025): $2,294 · +4.6% YoY. Source: county tax records.
Cash-flow waterfall
monthlySold comps — $/sqft
last 12 mo · ≤1 miLoading sold comps…