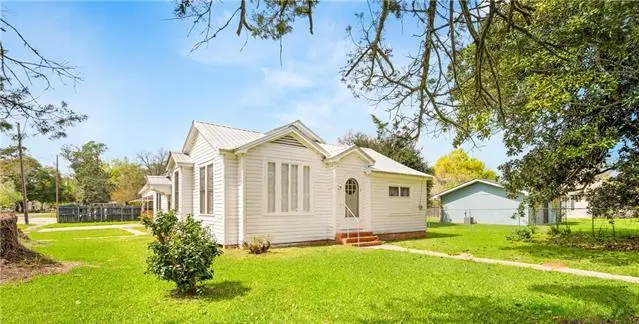
202 N Mabel St · Bunkie, LA
Flood risk 1/10 · Minimal
- FEMA flood zone
- X
- Chance of flooding over 30 yrs
- 0.0%
- Est. flood insurance / yr
- $507 – $1,088
Fire risk 1/10 · Minimal
- Est. fire insurance / yr
- $1,269 – $2,357
Heat risk 8/10 · Major
- Hot days now (above 111°F)
- 7 days/yr
- Hot days in 30 yrs
- 19 days/yr
Wind risk 8/10 · Major
- Chance of severe wind over 30 yrs
- 99.0%
Air-quality risk 1/10 · Minimal
- Unhealthy air days now
- 0 days/yr
- Unhealthy air days in 30 yrs
- 0 days/yr
Risk factors via First Street. Map © Google.
Why this score? — see what drove the C- grade
The composite is a weighted blend of 9 inputs, each scored 0–100. Each bar is that input's sub-score; the figure is the points it added to the 100-point composite (weight × sub-score).
- Cash flow +19.4/30.0
- ARV discount +7.5/15.0
- DSCR +6.1/10.0
- Appreciation +6.0/10.0
- 1% rule +4.3/10.0
- Livability +3.0/5.0
- Rent growth +2.5/5.0
- Condition / age +2.5/5.0
- Schools +2.1/10.0
$135,000
🖨 Deal sheet 📄 Offer letter ✓ Due diligence
Listing remarks
Imagine a home where everyone finally has their own space. Nestled in the heart of Bunkie, this charming 4-bedroom residence combines small-town tranquility with a layout designed for modern living. From quiet morning coffees in the eat-in kitchen to movie nights in the cozy den, this is more than just a house--it's the backdrop for your family's next great chapter. Don't miss your chance to view this versatile, move-in-ready space in the heart of Bunkie--where comfort meets value and your front door is waiting! Schedule your private showing today.
Key facts
- 9,147 sq ft lot
- Parking
- Built 1979
Neighborhood map
What this means for you Summary
Snapshot
- This is a 4-bed/2.0-bath single-family listed at $135k.
Deal economics
- At list price, monthly cash flow is $152 ($2k/yr) — positive.
- The deal already cash-flows at list — no discount required.
- To meet the 1% rule (rent ≥ 1% of price), the offer needs to be $125k (7.2% below list).
- Recommended offer: $125k (7.2% below list) — sets the bar for 1% rule.
Location & tenants
- Location reads 59/100 on livability (#267 in LA) — a working-class tenant base; expect higher turnover. Strengths: cost of living A+, housing B+; Watch: schools C-, health & safety C-, amenities F.
- Avoyelles Parish (rural): math 22% / reading 30% proficiency, ranked #56 of 98 in LA (top 57%) — low school quality limits family demand, transient renter base, plan for 1-2y turnover; 75% free/reduced lunch — lower-income household profile, screen leases tightly.
- Market conditions: 23 active listings in the ZIP; 15 units permitted in Avoyelles Parish in 2024 (0 in 5+ unit buildings).
Forward outlook
- In year one you build about $4k of equity ($933 loan paydown + $3k appreciation (1.9% local appreciation)).
- Avoyelles County population projected at -18% by 2050 — secular population decline; favor cash flow + early exit over multi-decade hold.
- At projected returns (1.9% appreciation + 3.0% rent growth), your $38k cash investment doubles in ~6 years — after that, you're playing with house money.
- By year 9, paydown + projected appreciation supports a ~$31k cash-out refi (75% LTV) — recoverable capital for the next deal without selling this one.
Negotiation context
- Only 7 days on market — expect competitive offers; lowballing is unlikely to land.
- 4 sale attempts since 5y ago with the ask held roughly flat each time — persistent listings suggest the price (not the market) is what's stuck; bring a comps-based counter.
- Current owner paid $87k; list at $135k implies a 55% gain — meaningful room to come down on a strong offer.
Risks & watch-outs
- Climate carrying-cost: severe wind risk, 99% chance of damaging wind over 30y; extreme-heat days projected 7→19/yr by 2055 (HVAC capex compounding) — expect insurance premiums to compound above CPI over the hold.
Questions for the listing agent
- Built in 1979 — when were the roof, HVAC, electrical panel, plumbing, and water heater last replaced?
- Is there a deadline driving the sale (1031 exchange, divorce, estate, relocation)? That informs how much negotiation room exists.
- What's the average days-on-market for RENTAL listings here right now (not sales)? A rising rental-DOM trend means longer vacancies and softer asking-rent achievability than the comps imply.
- What's the recent tenant-quality profile in this submarket — average credit score on applications, eviction rate, late-payment / NSF rate, and stable-employment percentage? A property-management company in the area should have these aggregated.
- How much new for-sale + rental construction is in the pipeline within 1–3 miles? Heavy new supply typically softens prices + rents 12–24 months out; constrained supply supports both.
Investment metrics
- 1% rule
- 0.93% ✗
- Cap rate
- 7.64%
- Cash-on-cash
- 4.81%
- DSCR
- 1.21
- GRM
- 9.0
CMA / ARV
- ARV (on-the-fly)
- $28,620
- Comps found
- 1
Show comp detail 1 sale within ~0.75 mi
| Address | Dist | Beds/Ba | Sqft | Sold | Price | $/sf | Match |
|---|---|---|---|---|---|---|---|
| 106 E Commercial St | 0.63mi | 4/1.5 | 1,700 (+7%) | 2mo | $30,000 | $18 | 56 |
Match score weights: distance 35% · size 25% · config 20% · recency 20%. Top-matched comps best support the ARV.
Projected returns pro-forma
1.94% appreciation · 3.0% rent growth · sell at horizon
- IRR
- 9.1%
- Equity multiple
- 1.49×
- Total profit
- $18,434
- Equity at exit
- $52,787
- IRR
- 12.2%
- Equity multiple
- 2.63×
- Total profit
- $61,739
- Equity at exit
- $75,663
Cash invested: $37,800 (down + closing). Projections, not guarantees.
Landlord ↔ Tenant lean methodology
- Overall (STATE)
- 90 Strongly Landlord-Friendly
- State Louisiana
- 90 Strongly Landlord-Friendly · R+12
- County
- — inherits STATE
- City
- — inherits STATE
ZIP-level market 71322
- Home prices YoY
- 2.4%
- Active inventory
- 23
- Price-to-rent
- 9.0×
Monthly cashflow live
- Estimated rent
- $1,253 medium interval (Pro) →
- Mortgage (P&I)
- −$708
- Tax from tax record
- −$74 /mo · $891/yr
- Insurance
- −$56
- HOA
- −$0
- Vacancy / Maint / Mgmt
- −$263
- Net cashflow
- $152
Break-even live
UW: 25.0% down · 7.5% · 30yr · 1.5% tax · 5.0% vac · 8.0% maint · 8.0% mgmt
Financing live
Cash to close
- Down payment
- $33,750
- Closing costs
- $4,050
- Reserves months
- —
- Total cash needed
- —
Loan-product check · same deal, 3 products live
Conventional
25% down · 7.5% · 30yr
- Down + closing
- —
- Monthly P&I
- —
- Monthly cashflow
- —
- DSCR
- —
- Eligible?
- —
Personal DTI + credit; lowest rate.
DSCR
20% down · 8.5% · 30yr
- Down + closing
- —
- Monthly P&I
- —
- Monthly cashflow
- —
- DSCR
- —
- Eligible?
- —
No personal income docs; deal must DSCR.
Hard money
10% down · 12.0% · 12mo
- Down + closing
- —
- Monthly P&I
- —
- Monthly cashflow
- —
- DSCR
- —
- Eligible?
- —
Short-term bridge; refi at stabilization.
Listing history 8 events
-
2026-03-25status Pending
-
2026-03-17$135,000 Active
-
2025-08-23$135,000 Active
-
2022-03-18$97,500
-
2021-12-27$50,000
-
2013-07-09soldstatus $87,000
-
2006-03-22soldstatus
-
2006-03-22soldstatus
ⓘ Source: listings_history table (triggers on properties + properties_extension) + one-shot
backfill from property_details.listing_events for pre-trigger history.
Tax reassessment forecast LA · Resets to sale price
- Current annual tax
- $891 · $74/mo
- Projected year-2 tax
- $891 · $74/mo
- Expected delta
- $0/yr ($0/mo · 0.0%)
ⓘ Screening estimate from a state-policy table — verify with the county assessor before closing.
Climate risk First Street
- Flood 1/10 Low FEMA zone X · 0% chance over 30 yrs
- Wildfire 1/10 Low
- Heat 8/10 Severe 7 d/yr ≥111°F today · 19 d/yr by 30 yrs out
- Wind 8/10 Severe 99% chance of damaging wind over 30 yrs
- Air quality 1/10 Low 0 unhealthy d/yr today · 0 by 30 yrs out
Nearby sold comps map
Loading sold comps map…
Walkable amenities ~0.75 mi
Loading nearby amenities…
Taxation est. · year 1
- Rental income
- $15,038
- − Mortgage interest
- −$7,562
- − Property taxes
- −$891
- − Insurance
- −$675
- − Repairs & maintenance
- −$1,203
- − Management
- −$1,203
- − Depreciation
- −$3,927
- Taxable loss
- −$424
- Est. tax savings @ 24.0%
- +$102
- After-tax cash flow
- $1,920/yr
For passive investors: Depreciation is non-cash, so a rental often shows a tax loss while cash-flowing — sheltering income. Rental losses are passive: they offset passive income freely, and up to $25,000/yr can offset ordinary (W-2) income if you actively participate and your MAGI is under $100k (phasing out to $0 by $150k); unused losses carry forward. On sale, claimed depreciation is recaptured at up to 25%, and gains may owe capital-gains tax (a 1031 exchange can defer both). Figures are a year-1 estimate at your 24.0% rate — not tax advice; consult a CPA.
Schools (NCES district)
- District
- Avoyelles Parish
- NCES district ID
- 2200150
- Math proficiency
- 22% ▼ -32.00%
- Reading proficiency
- 30% ▼ -29.00%
- Median HH income
- $33,891
- Composite
- 21.32/100
- National rank
- #8378
- State rank
- #56 of 98 in LA
Livability — Bunkie
- Score
- 59/100
- State rank
- #267
- US rank
- #19665
Category grades
Schools grade is shown separately in the Schools card above.
Census & demographics
- Census place
- Bunkie, LA
- Population (ZIP)
- 5,257
Population outlook (Avoyelles County) Hauer SSP2
- Today (2025)
- 39,084 people
- By 2030
- 37,784 · -3.3%
- By 2040
- 35,049 · -10.3%
- By 2050
- 32,225 · -17.5%
- By 2075
- 25,695 · -34.3%
- By 2100
- 18,985 · -51.4%
Race, ethnicity, and origin ACS 2023
- Neighborhood character
- Diverse neighborhood (Simpson 0.55)
- Race & ethnicity
- Black 51% White 43% Two or more races 4% Hispanic / Latino 2%
- Common ancestry
- Lithuanian 10% Slovak 2% Italian 1%
- Foreign-born
- 1% · Canada
- Languages at home
- 95% English-only · Spanish 3% French/Haitian/Cajun 2%
Political lean MEDSL · Avoyelles
- 2024 margin
- Solid R (+43.1) · D 27.8% · R 71.0% · Other 1.2%
- 2008→2024 swing
- -20.1pp toward R · 2008: -23.1pp · 2024: -43.1pp
- All cycles
- 2024: R+43.1 2020: R+40.8 2016: R+37.0 2012: R+27.0 2008: R+23.1
Not yet ingested
- Civics
- —
Market trends
- HPI YoY
- ▲ 1.94%
- Current HPI
- 82.0658
- Rent YoY
- —
- Metro
- —
- State GDP YoY
- ▲ 3.29%
- F500 in state
- 10
Industry mix (Fortune 500 HQ in LA)
| Industry | F500 HQs | Revenue |
|---|---|---|
| Telecommunications | 2 | $23B |
|
||
| Utilities | 1 | $12B |
|
||
| Wholesale / Distribution | 1 | $5B |
|
||
| Advertising | 1 | $2B |
|
||
Price history
+55.2% since first listed8 events — show timeline
- 2026-03-25 Pending — AcadianaMLS
- 2026-03-17 Listed $135,000 AcadianaMLS
- 2025-08-23 Listed $135,000 AcadianaMLS
- 2022-03-18 Listed $97,500 AcadianaMLS
- 2021-12-27 Listed $50,000 AcadianaMLS
- 2013-07-09 Sold (Public Records) $87,000 Public Records
- 2006-03-22 Sold (Public Records) — Public Records
- 2006-03-22 Sold (Public Records) — Public Records
Property tax history
+1.5%/yrLatest (2025): $891 · +0.0% YoY. Source: county tax records.
Cash-flow waterfall
monthlySold comps — $/sqft
last 12 mo · ≤1 miLoading sold comps…