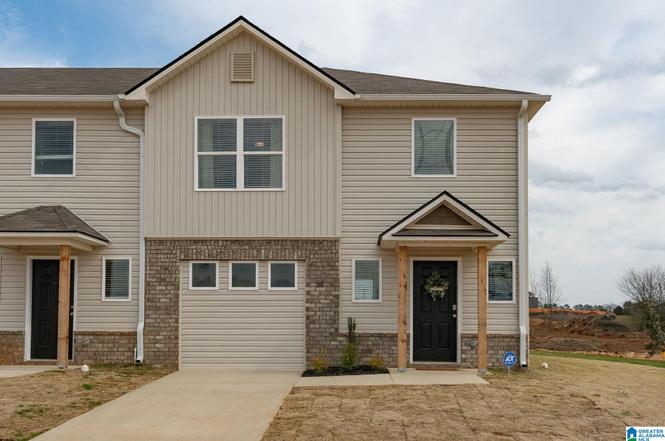
129 River Rock St · Lincoln, AL
Flood risk No data
- FEMA flood zone
- —
- Chance of flooding over 30 yrs
- —
- Est. flood insurance / yr
- —
Fire risk No data
- Est. fire insurance / yr
- —
Heat risk No data
- Hot days now (above threshold)
- —
- Hot days in 30 yrs
- —
Wind risk No data
- Chance of severe wind over 30 yrs
- —
Air-quality risk No data
- Unhealthy air days now
- —
- Unhealthy air days in 30 yrs
- —
Risk factors via First Street. Map © Google.
Why this score? — see what drove the D grade
The composite is a weighted blend of 9 inputs, each scored 0–100. Each bar is that input's sub-score; the figure is the points it added to the 100-point composite (weight × sub-score).
- Cash flow +10.5/30.0
- ARV discount +7.3/15.0
- Appreciation +6.5/10.0
- Condition / age +4.0/5.0
- 1% rule +3.1/10.0
- Livability +3.1/5.0
- DSCR +3.0/10.0
- Rent growth +2.5/5.0
- Schools +2.5/10.0
$169,900
🖨 Deal sheet (PDF) 📄 Offer letter ✓ Due diligence
Listing remarks
Welcome to Driftwood Townhomes – where convenience meets comfort at an incredible value. Just minutes from Logan Martin Lake and the public access at Lincoln’s Landing, this community offers an ideal blend of accessibility and lifestyle. Whether you're looking for a low-maintenance home, a smart investment, or your first step into homeownership, Driftwood delivers. Designed with everyday living in mind, this townhome provides functional space that flows seamlessly—making daily routines simple and entertaining easy. With thoughtfully planned layouts and modern touches throughout, you’ll find everything you need without paying for what you don’t. Don’t miss
Key facts
- Garage
- Built 2026
- Listed 47 days
Neighborhood map
What this means for you Summary
Snapshot
- This is a 3-bed/2.5-bath townhouse listed at $170k. Condition is rated good.
Deal economics
- At list price, monthly cash flow is $-86 ($-1k/yr) — negative.
- To cash-flow at today's rent, offer at most $157k (7.4% below list).
- To meet the 1% rule (rent ≥ 1% of price), the offer needs to be $138k (19.0% below list).
- Recommended offer: $138k (19.0% below list) — sets the bar for 1% rule.
- Cap rate 5.7% vs local median 4.2% in Lincoln — top-decile yield for the area; either an underpriced asset or a hidden risk that comps aren't pricing in. Stress-test before assuming the spread holds.
Location & tenants
- Location reads 62/100 on livability (#230 in AL) — a middle-class / working-renter tenant base. Strengths: cost of living A+, housing A+; Watch: crime D, amenities F, commute F.
- Talladega County (rural): math 15% / reading 44% proficiency, ranked #75 of 129 in AL (top 58%) — low school quality limits family demand, transient renter base, plan for 1-2y turnover; 64% free/reduced lunch — lower-income household profile, screen leases tightly.
- Zoned schools: Lincoln Elementary School (math 20% / reading 48%, grade F, #311 of 627 statewide, top 50%, 853 students, 62% FRL); Lincoln High School (math 12% / reading 27%, grade F, #169 of 305 statewide, top 59%, 585 students, 68% FRL) — zoned schools at 65% FRL track the district average.
- Market conditions: 230 active listings in the ZIP; 3 comparable units currently listed for rent nearby; rentals lingering (median 46d on market — plan ~5-8 weeks vacancy on turnover, expect pricing pressure); 67% of comp listings sitting > 30 days — soft ceiling on asking rent; 189 units permitted in Talladega County in 2024 (6 in 5+ unit buildings).
Forward outlook
- In year one you build about $6k of equity ($1k loan paydown + $5k appreciation (3.0% local appreciation)).
- Talladega County population projected at -14% by 2050 — secular population decline; favor cash flow + early exit over multi-decade hold.
- By year 6, paydown + projected appreciation supports a ~$33k cash-out refi (75% LTV) — recoverable capital for the next deal without selling this one.
Negotiation context
- It's been on market 47 days — a 3% lower offer ($165k) is reasonable based on typical stale-listing flexibility.
Questions for the listing agent
- What do current leases actually rent for vs. the listed asking? Can we see a recent rent roll and the last 12 months of T-12 income?
- It's been on market 47 days. Have you received any prior offers? Is the seller open to a 19% concession, seller financing, or rate buy-down credit?
- Is there a deadline driving the sale (1031 exchange, divorce, estate, relocation)? That informs how much negotiation room exists.
- Schools are D-rated, which usually means shorter tenancies and higher turnover. Who's the typical renter profile here, and what's been the actual vacancy rate?
- Crime grade is D in this area — have there been break-ins, vandalism, or insurance claims at this property in the last 3 years? What carrier currently insures it and at what premium?
- The area grade is low — what's the realistic commute time and amenity access for the typical tenant pool here? Any planned neighborhood developments (good or bad) we should know about?
- What's the average days-on-market for RENTAL listings here right now (not sales)? A rising rental-DOM trend means longer vacancies and softer asking-rent achievability than the comps imply.
- What's the recent tenant-quality profile in this submarket — average credit score on applications, eviction rate, late-payment / NSF rate, and stable-employment percentage? A property-management company in the area should have these aggregated.
- How much new for-sale + rental construction is in the pipeline within 1–3 miles? Heavy new supply typically softens prices + rents 12–24 months out; constrained supply supports both.
Investment metrics
- 1% rule
- 0.81% ✗
- Cap rate
- 5.68%
- Cash-on-cash
- -2.18%
- DSCR
- 0.90
- GRM
- 10.3
CMA / ARV
- ARV (on-the-fly)
- $169,176
- Comps found
- 12
Show comp detail 12 sales within ~0.75 mi
| Address | Dist | Beds/Ba | Sqft | Sold | Price | $/sf | Match |
|---|---|---|---|---|---|---|---|
| 73 River Rock St | 0.01mi | 3/2.5 | 1,484 (0%) | 2mo | $169,900 | $114 | 97 |
| 107 River Rock St | 0.02mi | 3/2.5 | 1,484 (0%) | 3mo | $169,000 | $114 | 97 |
| 87 River Rock St | 0.06mi | 3/2.5 | 1,484 (0%) | 2mo | $159,826 | $108 | 96 |
| 35 River Rock St | 0.04mi | 3/2.5 | 1,484 (0%) | 3mo | $163,000 | $110 | 96 |
| 49 River Rock St | 0.04mi | 3/2.5 | 1,484 (0%) | 4mo | $174,226 | $117 | 95 |
| 53 River Rock St | 0.04mi | 3/2.5 | 1,484 (0%) | 5mo | $162,000 | $109 | 94 |
| 43 River Rock St | 0.03mi | 3/2.5 | 1,484 (0%) | 5mo | $168,900 | $114 | 94 |
| 59 River Rock St | 0.04mi | 3/2.5 | 1,484 (0%) | 5mo | $187,590 | $126 | 94 |
| 39 River Rock St | 0.04mi | 3/2.5 | 1,484 (0%) | 5mo | $168,900 | $114 | 94 |
| 135 Driftwood Ln | 0.08mi | 3/2.5 | 1,484 (0%) | 4mo | $169,900 | $114 | 92 |
| 95 River Grass Dr | 0.12mi | 3/2.5 | 1,484 (0%) | 5mo | $183,830 | $124 | 90 |
| 23 River Grass Dr | 0.17mi | 3/2.5 | 1,484 (0%) | 6mo | $177,100 | $119 | 87 |
Match score weights: distance 35% · size 25% · config 20% · recency 20%. Top-matched comps best support the ARV.
Projected returns pro-forma
2.96% appreciation · 3.0% rent growth · sell at horizon
- IRR
- 5.4%
- Equity multiple
- 1.31×
- Total profit
- $14,622
- Equity at exit
- $76,008
- IRR
- 8.4%
- Equity multiple
- 2.27×
- Total profit
- $60,272
- Equity at exit
- $116,839
Cash invested: $47,572 (down + closing). Projections, not guarantees.
Landlord ↔ Tenant lean methodology
- Overall (STATE)
- 90 Strongly Landlord-Friendly
- State Alabama
- 90 Strongly Landlord-Friendly · R+15
- County
- — inherits STATE
- City
- — inherits STATE
ZIP-level market 35096
- Home prices YoY
- 1.2%
- Active inventory
- 230
- Price-to-rent
- 10.3×
Monthly cashflow live
- Estimated rent
- $1,377 medium interval (Pro) →
- Mortgage (P&I)
- −$891
- Tax est. 1.5%
- −$212 /mo · $2,548/yr
- Insurance
- −$71
- HOA
- −$0
- Vacancy / Maint / Mgmt
- −$289
- Net cashflow
- $-86
Break-even live
Sensitivity live
| Price | -10% $31 | -5% $-28 | +0% $-86 | +5% $-145 | +10% $-204 |
|---|---|---|---|---|---|
| Rent | -10% $-195 | -5% $-141 | +0% $-86 | +5% $-32 | +10% $22 |
| Rate | -1.0pp $-1 | -0.5pp $-43 | base $-86 | +0.5pp $-130 | +1.0pp $-175 |
UW: 25.0% down · 7.5% · 30yr · 1.5% tax · 5.0% vac · 8.0% maint · 8.0% mgmt
Financing live
Cash to close
- Down payment
- $42,475
- Closing costs
- $5,097
- Reserves months
- —
- Total cash needed
- —
Loan-product check · same deal, 3 products live
Conventional
25% down · 7.5% · 30yr
- Down + closing
- —
- Monthly P&I
- —
- Monthly cashflow
- —
- DSCR
- —
- Eligible?
- —
Personal DTI + credit; lowest rate.
DSCR
20% down · 8.5% · 30yr
- Down + closing
- —
- Monthly P&I
- —
- Monthly cashflow
- —
- DSCR
- —
- Eligible?
- —
No personal income docs; deal must DSCR.
Hard money
10% down · 12.0% · 12mo
- Down + closing
- —
- Monthly P&I
- —
- Monthly cashflow
- —
- DSCR
- —
- Eligible?
- —
Short-term bridge; refi at stabilization.
Rent comps 3 comps
| Address | Beds | Baths | Sqft | Rent | $/sqft | DOM | Units | Dist |
|---|---|---|---|---|---|---|---|---|
| 106 River Grass Dr Lincoln, AL | 3.0 | 2.5 | 1484 | $1,425 | $0.96 | 18d | 1 | 0.14mi |
| 104 Marine Dr Lincoln, AL | 3.0 | 2.5 | 1484 | $1,300 | $0.88 | 45d | 1 | 0.18mi |
| 98 Marine Dr Lincoln, AL | 3.0 | 2.5 | 1484 | $1,395 | $0.94 | 45d | 1 | 0.19mi |
Listing history 2 events
-
2026-04-02status Pending
-
2026-02-13$169,900 Active
ⓘ Source: listings_history table (triggers on properties + properties_extension) + one-shot
backfill from property_details.listing_events for pre-trigger history.
Nearby sold comps map
Loading sold comps map…
Walkable amenities ~0.75 mi
Loading nearby amenities…
Taxation est. · year 1
- Rental income
- $16,523
- − Mortgage interest
- −$9,517
- − Property taxes
- −$2,548
- − Insurance
- −$850
- − Repairs & maintenance
- −$1,322
- − Management
- −$1,322
- − Depreciation
- −$4,943
- Taxable loss
- −$3,979
- Est. tax savings @ 24.0%
- +$955
- After-tax cash flow
- $-82/yr
For passive investors: Depreciation is non-cash, so a rental often shows a tax loss while cash-flowing — sheltering income. Rental losses are passive: they offset passive income freely, and up to $25,000/yr can offset ordinary (W-2) income if you actively participate and your MAGI is under $100k (phasing out to $0 by $150k); unused losses carry forward. On sale, claimed depreciation is recaptured at up to 25%, and gains may owe capital-gains tax (a 1031 exchange can defer both). Figures are a year-1 estimate at your 24.0% rate — not tax advice; consult a CPA.
Condition & rehab AI · 13 photos
This townhouse is in good condition with modern finishes and a well-maintained exterior. A fresh coat of paint on the exterior trim would enhance its curb appeal and value.
Value-add opportunities
- Resale Paint exterior trim — Enhances curb appeal
- Rental Clean gutters — Keeps property in good condition
Renovation cost estimate screening
Value-add ROI direction
- Resale Paint exterior trim — Enhances curb appeal ↑
- Rental Clean gutters — Keeps property in good condition ↑
ⓘ Cost ranges are severity-bucket heuristics (US national rule-of-thumb). Get contractor quotes + a written scope before underwriting a rehab budget.
Schools (NCES district)
- District
- Talladega County
- NCES district ID
- 0103180
- Math proficiency
- 15% ▼ -24.00%
- Reading proficiency
- 44% ▲ 3.00%
- Median HH income
- $37,715
- Composite
- 24.5/100
- National rank
- #7650
- State rank
- #75 of 129 in AL
Livability — Lincoln
- Score
- 62/100
- State rank
- #230
- US rank
- #17221
Category grades
Schools grade is shown separately in the Schools card above.
Census & demographics
- Census place
- Lincoln, AL
- City population
- 9,201
- Population (ZIP)
- 9,201
Population outlook (Talladega County) Hauer SSP2
- Today (2025)
- 78,905 people
- By 2030
- 77,160 · -2.2%
- By 2040
- 72,937 · -7.6%
- By 2050
- 68,279 · -13.5%
- By 2075
- 57,884 · -26.6%
- By 2100
- 47,220 · -40.2%
Race, ethnicity, and origin ACS 2023
- Neighborhood character
- Predominantly White (72%)
- Race & ethnicity
- White 72% Black 19% Two or more races 7% Hispanic / Latino 2%
- Common ancestry
- Lithuanian 2% Italian 1% Serbian 1%
- Foreign-born
- 1% · Canada, Vietnam
- Languages at home
- 98% English-only · Vietnamese 1% Spanish 1%
Political lean MEDSL · Talladega
- 2024 margin
- Solid R (+33.8) · D 32.9% · R 66.6%
- 2008→2024 swing
- -15.3pp toward R · 2008: -18.5pp · 2024: -33.8pp
- All cycles
- 2024: R+33.8 2020: R+25.5 2016: R+25.6 2012: R+16.0 2008: R+18.5
Not yet ingested
- Civics
- —
Market trends
- HPI YoY
- ▲ 2.96%
- Current HPI
- 255.9195
- Rent YoY
- —
- Metro
- —
- State GDP YoY
- ▲ 2.94%
- F500 in state
- 4
Industry mix (Fortune 500 HQ in AL)
| Industry | F500 HQs | Revenue |
|---|---|---|
| Financial Services | 1 | $8B |
|
||
| Healthcare | 1 | $5B |
|
||
Price history
2 events — show timeline
- 2026-04-02 Pending — Greater Alabama MLS
- 2026-02-13 Listed $169,900 Greater Alabama MLS
Cash-flow waterfall
monthlySold comps — $/sqft
last 12 mo · ≤1 miLoading sold comps…