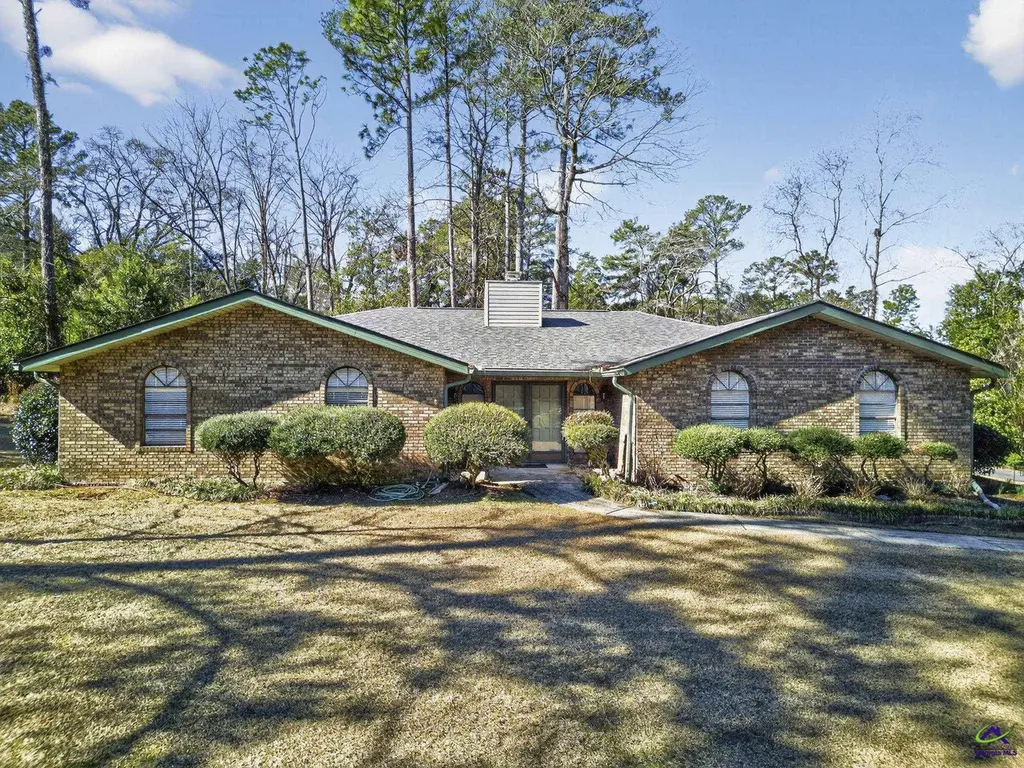
103 Pheasant Cv · Warner Robins, GA
Flood risk 1/10 · Minimal
- FEMA flood zone
- X (unshaded)
- Chance of flooding over 30 yrs
- 0.0%
- Est. flood insurance / yr
- $507 – $1,088
Fire risk 3/10 · Minor
- Est. fire insurance / yr
- $963 – $1,789
Heat risk 7/10 · Major
- Hot days now (above 108°F)
- 7 days/yr
- Hot days in 30 yrs
- 18 days/yr
Wind risk 6/10 · Moderate
- Chance of severe wind over 30 yrs
- 76.0%
Air-quality risk 3/10 · Minor
- Unhealthy air days now
- 2 days/yr
- Unhealthy air days in 30 yrs
- 4 days/yr
Risk factors via First Street. Map © Google.
Why this score? — see what drove the D+ grade
The composite is a weighted blend of 9 inputs, each scored 0–100. Each bar is that input's sub-score; the figure is the points it added to the 100-point composite (weight × sub-score).
- ARV discount +14.1/15.0
- Cash flow +13.4/30.0
- DSCR +4.1/10.0
- Schools +3.9/10.0
- Livability +3.2/5.0
- 1% rule +3.0/10.0
- Rent growth +2.9/5.0
- Condition / age +2.5/5.0
- Appreciation +0.0/10.0
$249,900
🖨 Deal sheet 📄 Offer letter ✓ Due diligence
Listing remarks
Welcome to 103 Pheasant Cove — where space, privacy, and potential come together in one of Warner Robins’ established neighborhoods- Beaver Glen! This well-maintained, one-level home sits on a generous 0.58-acre lot and offers over 2,300 square feet of comfortable living space. Inside, you’ll find a functional layout with multiple living areas, a cozy fireplace, and plenty of room to spread out. Move-in ready and full of character, this home gives buyers the opportunity to update at their own pace while enjoying a solid, well-cared-for property from day one. Tucked away on a quiet cul-de-sac yet conveniently located near shopping, dining, and Robins Air Force Base, this h
Key facts
- Near dining
- 0.58-acre lot
- Quiet cul-de-sac
Tags
Property features AI
Finance
- HOA & community: Homeowners association with an annual fee of $400 (about $33.33/month); Community clubhouse; Community pool
Exterior
- Parking: Attached garage with garage door opener; 2-car garage
- Utilities: Public water; Public sewer and septic tank
- Home design: Single-family detached residence; Residential property
- Construction: Brick construction; Slab foundation
- Exterior features: Patio; Tennis court(s); Lot approximately 0.58 acres
Interior
- Kitchen: Dishwasher; Electric range; Garbage disposal
- Flooring: Carpet; Tile
- Bathrooms: Two full bathrooms and one half bathroom
- Heating & cooling: Central heating (electric); Central air conditioning; Ceiling fans
- Interior features: Fireplace (wood burning); Tennis court access; Patio
Neighborhood map
What this means for you Summary
Snapshot
- This is a 3-bed/2.5-bath single-family listed at $250k.
Deal economics
- At list price, monthly cash flow is $7 ($80/yr) — positive.
- The deal already cash-flows at list — no discount required.
- To meet the 1% rule (rent ≥ 1% of price), the offer needs to be $201k (19.7% below list).
- Recommended offer: $201k (19.7% below list) — sets the bar for 1% rule.
- Cap rate 6.3% vs local median 4.9% in Warner Robins — meaningfully above typical; check what's discounted (condition, days-on-market, listing class) to confirm the premium yield is real.
Location & tenants
- Location reads 65/100 on livability (#227 in GA) — a middle-class / working-renter tenant base. Strengths: cost of living A+, housing A+, health & safety A+; Watch: employment D+, crime F, amenities F.
- Houston County (urban): math 43% / reading 46% proficiency, ranked #23 of 174 in GA (top 13%) — families likely to look elsewhere, expect single-tenant / working-renter base with shorter leases.
- Zoned schools: Russell Elementary School (math 51% / reading 41%, grade D-, #316 of 1,228 statewide, top 26%, 645 students, 84% FRL); Huntington Middle School (math 23% / reading 32%, grade F, #268 of 470 statewide, top 57%, 827 students, 84% FRL); Warner Robins High School (math 7% / reading 21%, grade F, #322 of 424 statewide, top 76%, 1,816 students, 84% FRL) — zoned schools average 84% FRL vs 46% district-wide (38 pts higher); higher-poverty schools than district average — tighter screening recommended.
- Zoned-school proficiency averages 29% at this address vs 44% district-wide (-15 pts) — the specific schools serving this property underperform the Houston County average; the district grade overstates school quality for this exact location.
- Market conditions: Rents rising (+1.7%/yr); 286 active listings in the ZIP; 8 comparable units currently listed for rent nearby; rentals lingering (median 44d on market — plan ~5-8 weeks vacancy on turnover, expect pricing pressure); 50% of comp listings sitting > 30 days — soft ceiling on asking rent; solid renter incomes; 1,545 units permitted in Houston County in 2024 (336 in 5+ unit buildings).
Forward outlook
- Local home prices are declining (-3.0%/yr); year-one equity from $2k of loan paydown is wiped out by about $7k of value loss. Plan a longer hold.
- Houston County population projected at +22% by 2050 — long-run rental-demand tailwind backs the buy-and-hold thesis.
Negotiation context
- Only 10 days on market — expect competitive offers; lowballing is unlikely to land.
Risks & watch-outs
- Climate carrying-cost: major wind risk, 76% chance of damaging wind over 30y; extreme-heat days projected 7→18/yr by 2055 (HVAC capex compounding) — expect insurance premiums to compound above CPI over the hold.
Questions for the listing agent
- Built in 1976 — when were the roof, HVAC, electrical panel, plumbing, and water heater last replaced?
- What does the HOA fee cover, when was the last increase, and are there any pending special assessments or reserve-fund shortfalls?
- Is there a deadline driving the sale (1031 exchange, divorce, estate, relocation)? That informs how much negotiation room exists.
- Schools are D-rated, which usually means shorter tenancies and higher turnover. Who's the typical renter profile here, and what's been the actual vacancy rate?
- Crime grade is F in this area — have there been break-ins, vandalism, or insurance claims at this property in the last 3 years? What carrier currently insures it and at what premium?
- The area grade is low — what's the realistic commute time and amenity access for the typical tenant pool here? Any planned neighborhood developments (good or bad) we should know about?
- What's the average days-on-market for RENTAL listings here right now (not sales)? A rising rental-DOM trend means longer vacancies and softer asking-rent achievability than the comps imply.
- What's the recent tenant-quality profile in this submarket — average credit score on applications, eviction rate, late-payment / NSF rate, and stable-employment percentage? A property-management company in the area should have these aggregated.
- How much new for-sale + rental construction is in the pipeline within 1–3 miles? Heavy new supply typically softens prices + rents 12–24 months out; constrained supply supports both.
Investment metrics
- 1% rule
- 0.80% ✗
- Cap rate
- 6.32%
- Cash-on-cash
- 0.11%
- DSCR
- 1.01
- GRM
- 10.4
CMA / ARV
- ARV (on-the-fly)
- $292,556
- Comps found
- 12
Show comp detail 12 sales within ~0.75 mi
| Address | Dist | Beds/Ba | Sqft | Sold | Price | $/sf | Match |
|---|---|---|---|---|---|---|---|
| 103 Pheasant Cv | 0.00mi | 3/2.5 | 2,398 (0%) | 1mo | $255,000 | $106 | 99 |
| 422 Lake Front Dr | 0.17mi | 4/2.5 (+1) | 2,341 (-2%) | 3mo | $268,000 | $114 | 80 |
| 422 Lake Front Dr | 0.17mi | 4/2.5 (+1) | 2,341 (-2%) | 3mo | $268,000 | $114 | 80 |
| 226 Shenandoah Trl | 0.42mi | 4/2.5 (+1) | 2,423 (+1%) | 2mo | $313,000 | $129 | 72 |
| 101 Harbor Dr | 0.30mi | 4/3.0 (+1) | 2,317 (-3%) | 4mo | $250,000 | $108 | 70 |
| 105 South Oaks Ln | 0.39mi | 4/2.5 (+1) | 2,364 (-1%) | 8mo | $279,900 | $118 | 68 |
| 120 Shenandoah Trl | 0.41mi | 3/2.5 | 2,217 (-8%) | 3mo | $269,900 | $122 | 66 |
| 201 Feagin Mill Rd | 0.43mi | 3/2.0 | 2,217 (-8%) | 2mo | $155,000 | $70 | 64 |
| 106 Fox Glen Dr | 0.29mi | 4/2.5 (+1) | 2,614 (+9%) | 11mo | $318,000 | $122 | 57 |
| 266 Southland Station Dr | 0.47mi | 4/2.5 (+1) | 2,077 (-13%) | 5mo | $278,000 | $134 | 47 |
| 111 Raintree Dr | 0.62mi | 3/2.0 | 2,123 (-12%) | 4mo | $276,900 | $130 | 46 |
| 102 Gatlin Ct | 0.74mi | 3/2.0 | 2,104 (-12%) | 6mo | $275,000 | $131 | 38 |
Match score weights: distance 35% · size 25% · config 20% · recency 20%. Top-matched comps best support the ARV.
Projected returns pro-forma
-3.0% appreciation · 1.67% rent growth · sell at horizon
- IRR
- -17.5%
- Equity multiple
- 0.39×
- Total profit
- $-42,783
- Equity at exit
- $37,261
- IRR
- -12.1%
- Equity multiple
- 0.32×
- Total profit
- $-47,547
- Equity at exit
- $21,607
Cash invested: $69,972 (down + closing). Projections, not guarantees.
Landlord ↔ Tenant lean methodology
- Overall (STATE)
- 90 Strongly Landlord-Friendly
- State Georgia
- 90 Strongly Landlord-Friendly · R+3
- County
- — inherits STATE
- City
- — inherits STATE
ZIP-level market 31088
- Rents YoY
- 1.7%
- Active inventory
- 286
- Price-to-rent
- 10.4×
Monthly cashflow live
- Estimated rent
- $2,007 high interval (Pro) →
- Mortgage (P&I)
- −$1,311
- Tax from tax record
- −$131 /mo · $1,574/yr
- Insurance
- −$104
- HOA
- −$33
- Vacancy / Maint / Mgmt
- −$421
- Net cashflow
- $7
Break-even live
Sensitivity live
| Price | -10% $148 | -5% $77 | +0% $7 | +5% $-64 | +10% $-135 |
|---|---|---|---|---|---|
| Rent | -10% $-152 | -5% $-73 | +0% $7 | +5% $86 | +10% $165 |
| Rate | -1.0pp $132 | -0.5pp $70 | base $7 | +0.5pp $-58 | +1.0pp $-124 |
UW: 25.0% down · 7.5% · 30yr · 1.5% tax · 5.0% vac · 8.0% maint · 8.0% mgmt
Financing live
Cash to close
- Down payment
- $62,475
- Closing costs
- $7,497
- Reserves months
- —
- Total cash needed
- —
Loan-product check · same deal, 3 products live
Conventional
25% down · 7.5% · 30yr
- Down + closing
- —
- Monthly P&I
- —
- Monthly cashflow
- —
- DSCR
- —
- Eligible?
- —
Personal DTI + credit; lowest rate.
DSCR
20% down · 8.5% · 30yr
- Down + closing
- —
- Monthly P&I
- —
- Monthly cashflow
- —
- DSCR
- —
- Eligible?
- —
No personal income docs; deal must DSCR.
Hard money
10% down · 12.0% · 12mo
- Down + closing
- —
- Monthly P&I
- —
- Monthly cashflow
- —
- DSCR
- —
- Eligible?
- —
Short-term bridge; refi at stabilization.
Rent comps 8 comps
| Address | Beds | Baths | Sqft | Rent | $/sqft | DOM | Units | Dist |
|---|---|---|---|---|---|---|---|---|
| 101 Raintree Dr Warner Robins, GA | 3.0 | 2.0 | 2062 | $2,250 | $1.09 | 21d | 1 | 0.70mi |
| 106 Leisure Pointe Cv Warner Robins, GA | 4.0 | 2.5 | 1682 | $1,950 | $1.16 | 13d | 1 | 0.80mi |
| 106 Leisure Pointe Cv Warner Robins, GA | 4.0 | 2.5 | 1682 | $2,000 | $1.19 | 44d | 1 | 0.80mi |
| 109 Leisure Pointe Cv Warner Robins, GA | 4.0 | 2.5 | 1682 | $1,925 | $1.14 | 44d | 1 | 0.83mi |
| 121 Highland Dr Warner Robins, GA | 3.0 | 2.0 | 1712 | $1,795 | $1.05 | 21d | 1 | 0.90mi |
| 121 Highland Dr Warner Robins, GA | 3.0 | 2.0 | 1712 | $1,795 | $1.05 | 44d | 1 | 0.90mi |
| 113 Gray Fox Xing Bonaire, GA | 4.0 | 2.0 | 1717 | $2,200 | $1.28 | 21d | 1 | 1.17mi |
| 100 Sun Chase Bonaire, GA | 4.0 | 2.5 | 2234 | $2,500 | $1.12 | 44d | 1 | 1.45mi |
HOA detail
- Monthly dues
- $33 · $396/yr
Listing history 2 events
-
2026-04-20status Pending
-
2026-04-09$249,900 Active
ⓘ Source: listings_history table (triggers on properties + properties_extension) + one-shot
backfill from property_details.listing_events for pre-trigger history.
Tax reassessment forecast GA · Resets to sale price
- Current annual tax
- $1,574 · $131/mo
- Projected year-2 tax
- $2,299 · $192/mo
- Expected delta
- +$725/yr (+$60/mo · 46.0%)
ⓘ Screening estimate from a state-policy table — verify with the county assessor before closing.
Climate risk First Street
- Flood 1/10 Low FEMA zone X (unshaded) · 0% chance over 30 yrs
- Wildfire 3/10 Moderate
- Heat 7/10 Severe 7 d/yr ≥108°F today · 18 d/yr by 30 yrs out
- Wind 6/10 Major 76% chance of damaging wind over 30 yrs
- Air quality 3/10 Moderate 2 unhealthy d/yr today · 4 by 30 yrs out
Nearby sold comps map
Loading sold comps map…
Walkable amenities ~0.75 mi
Loading nearby amenities…
Taxation est. · year 1
- Rental income
- $24,083
- − Mortgage interest
- −$13,998
- − Property taxes
- −$1,574
- − Insurance
- −$1,250
- − Repairs & maintenance
- −$1,927
- − Management
- −$1,927
- − HOA
- −$396
- − Depreciation
- −$7,270
- Taxable loss
- −$4,258
- Est. tax savings @ 24.0%
- +$1,022
- After-tax cash flow
- $1,102/yr
For passive investors: Depreciation is non-cash, so a rental often shows a tax loss while cash-flowing — sheltering income. Rental losses are passive: they offset passive income freely, and up to $25,000/yr can offset ordinary (W-2) income if you actively participate and your MAGI is under $100k (phasing out to $0 by $150k); unused losses carry forward. On sale, claimed depreciation is recaptured at up to 25%, and gains may owe capital-gains tax (a 1031 exchange can defer both). Figures are a year-1 estimate at your 24.0% rate — not tax advice; consult a CPA.
Schools (NCES district)
- District
- Houston County
- NCES district ID
- 1302880
- Math proficiency
- 43% ▼ -7.00%
- Reading proficiency
- 46% ▼ -2.00%
- Median HH income
- $54,823
- Composite
- 38.68/100
- National rank
- #4144
- State rank
- #23 of 174 in GA
Livability — Warner Robins
- Score
- 65/100
- State rank
- #227
- US rank
- #13290
Category grades
Schools grade is shown separately in the Schools card above.
Census & demographics
- Census place
- Warner Robins, GA
- County
- Houston County · 157,321 people
- City population
- 92,102
- Metro
- Warner Robins, GA
- Population (ZIP)
- 58,585
- Household income
- $83,082
- Rent vs Own
- Severe rent burden
- 1668.0
Population outlook (Houston County) Hauer SSP2
- Today (2025)
- 169,502 people
- By 2030
- 178,486 · +5.3%
- By 2040
- 194,642 · +14.8%
- By 2050
- 207,119 · +22.2%
- By 2075
- 231,480 · +36.6%
- By 2100
- 235,034 · +38.7%
Race, ethnicity, and origin ACS 2023
- Neighborhood character
- Diverse neighborhood (Simpson 0.63)
- Race & ethnicity
- White 51% Black 32% Two or more races 9% Hispanic / Latino 7% Asian 4%
- Hispanic origin (detail)
- Mexican 4%
- Common ancestry
- Romanian 2% Slovak 2% Lithuanian 2%
- Foreign-born
- 9% · Canada, Vietnam, Jamaica
- Languages at home
- 90% English-only · Spanish 5% Other Asian/Pacific 2% Vietnamese 2%
Political lean MEDSL · Houston
- 2024 margin
- R (+11.3) · D 44.0% · R 55.3%
- 2008→2024 swing
- +8.9pp toward D · 2008: -20.2pp · 2024: -11.3pp
- All cycles
- 2024: R+11.3 2020: R+12.4 2016: R+21.6 2012: R+20.7 2008: R+20.2
Not yet ingested
- Civics
- —
Market trends
- HPI YoY
- ▼ -135.75%
- Current HPI
- 219.8261
- Rent YoY
- ▲ 1.67%
- Metro
- Warner Robins, GA
- State GDP YoY
- ▲ 2.66%
- F500 in state
- 28
Industry mix (Fortune 500 HQ in GA)
| Industry | F500 HQs | Revenue |
|---|---|---|
| Paper / Packaging | 2 | $29B |
|
||
| Retail | 1 | $160B |
|
||
| Transportation / Logistics | 1 | $91B |
|
||
| Airlines | 1 | $62B |
|
||
| Consumer Goods | 1 | $47B |
|
||
| Utilities | 1 | $25B |
|
||
Price history
2 events — show timeline
- 2026-04-20 Pending — CGMLS
- 2026-04-09 Listed $249,900 CGMLS
Property tax history
+5.4%/yrLatest (2025): $1,574 · +5.2% YoY. Source: county tax records.
Cash-flow waterfall
monthlySold comps — $/sqft
last 12 mo · ≤1 miLoading sold comps…