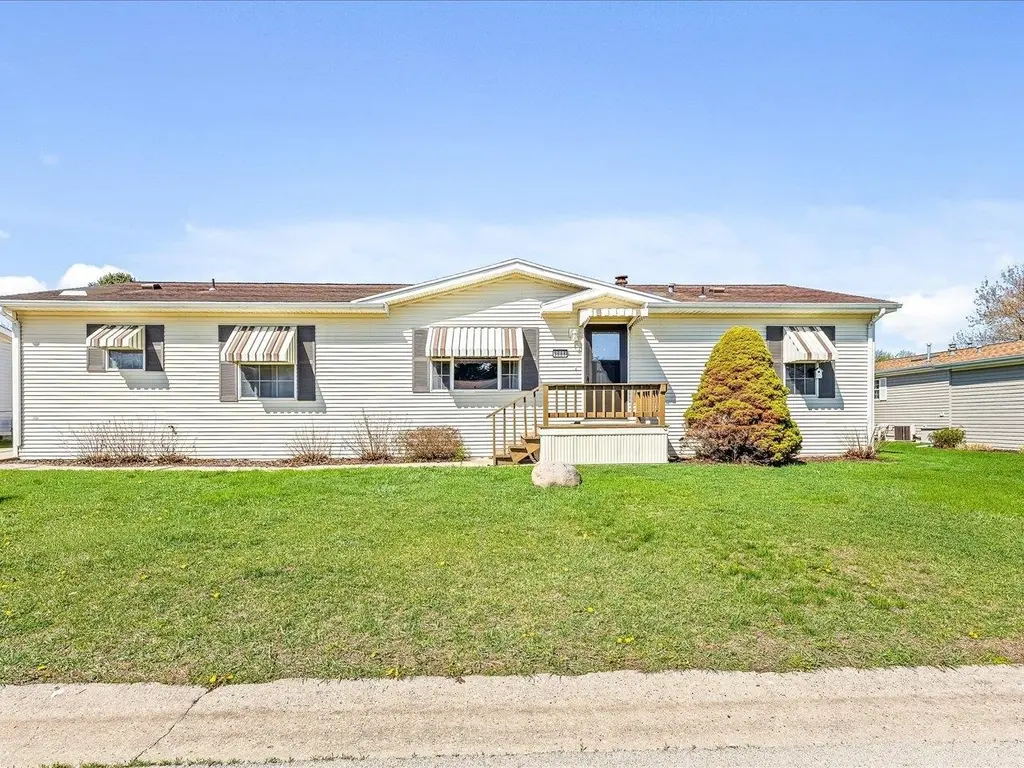
8686 Dutch Elm Ct · Roscoe, IL
Flood risk 1/10 · Minimal
- FEMA flood zone
- X (unshaded)
- Chance of flooding over 30 yrs
- 0.0%
- Est. flood insurance / yr
- $507 – $1,088
Fire risk 1/10 · Minimal
- Est. fire insurance / yr
- $804 – $1,492
Heat risk 3/10 · Minor
- Hot days now (above 101°F)
- 7 days/yr
- Hot days in 30 yrs
- 15 days/yr
Wind risk 2/10 · Minimal
- Chance of severe wind over 30 yrs
- —
Air-quality risk 3/10 · Minor
- Unhealthy air days now
- 2 days/yr
- Unhealthy air days in 30 yrs
- 3 days/yr
Risk factors via First Street. Map © Google.
Why this score? — see what drove the B grade
The composite is a weighted blend of 9 inputs, each scored 0–100. Each bar is that input's sub-score; the figure is the points it added to the 100-point composite (weight × sub-score).
- Cash flow +30.0/30.0
- 1% rule +10.0/10.0
- DSCR +10.0/10.0
- ARV discount +9.3/15.0
- Livability +4.1/5.0
- Condition / age +2.8/5.0
- Rent growth +2.5/5.0
- Schools +1.8/10.0
- Appreciation +0.0/10.0
$85,500
🖨 Deal sheet 📄 Offer letter ✓ Due diligence
Listing remarks
Motivated Seller! Enjoy comfort and convenience in this charming home located in a welcoming 55+ community. Offering 3 bedrooms and 2 full bathrooms, plus a flexible den or office space, this home provides room to relax and entertain. Outside is a covered deck, perfect for enjoying peaceful mornings or hosting friends. The 2.5 car garage offers excellent storage and workspace. A wonderful place to call home! Buyer must be park approved and at least one owner must be 55 or over. Current Lot Rent $830.75 per month. Owner is responsible for water, trash and sewer paid through the park.
Key facts
- Covered deck
- 2 garage spots
- Built 1996
Tags
Property features AI
Finance
- Other: Annual tax information available
Exterior
- Parking: Detached garage; Approximately 2.5 garage spaces
- Utilities: Public water service; Public sewer service
- Home design: Mobile home (residential); House subtype
- Exterior features: Shingle roof; Public water; Public sewer
Interior
- Kitchen: Gas cooktop; Dishwasher; Disposal; Microwave; Refrigerator
- Bathrooms: Two full bathrooms (both on the main level)
- Heating & cooling: Forced air heating; Central air conditioning
- Interior features: Walk-in closet(s); Therapeutic whirlpool
- Laundry & utility: Washer; Dryer; Gas water heater
Neighborhood map
What this means for you Summary
Snapshot
- This is a 3-bed/2.0-bath manufactured listed at $86k. Condition is rated average.
Deal economics
- At list price, monthly cash flow is $773 ($9k/yr) — positive.
- The deal already cash-flows at list — no discount required.
- Meets the 1% rule at list price ($2k rent vs $86k).
- Recommended offer: $83k (3.0% below list) — sets the bar for market timing.
- Cap rate 17.1% vs local median 2.8% in Roscoe — top-decile yield for the area; either an underpriced asset or a hidden risk that comps aren't pricing in. Stress-test before assuming the spread holds.
Location & tenants
- Location reads 82/100 on livability (#61 in IL, #1,071 nationally) — a professional / high-income tenant draw. Strengths: crime A+, employment A+, cost of living A+; Watch: amenities F, commute F.
- Harlem UD 122 (suburban): math 17% / reading 23% proficiency, ranked #418 of 620 in IL (top 67%) — low school quality limits family demand, transient renter base, plan for 1-2y turnover.
- Zoned schools: Ralston Elem School (math 27% / reading 32%, grade F, #658 of 2,056 statewide, top 35%, 284 students, 0% FRL); Harlem High School (math 18% / reading 23%, grade F, #350 of 693 statewide, top 51%, 1,875 students, 0% FRL) — zoned schools average 0% FRL vs 45% district-wide (45 pts lower); this property's tenant base skews higher-income than the district average.
- Market conditions: 115 active listings in the ZIP; 2 comparable units currently listed for rent nearby; 285 units permitted in Winnebago County in 2024 (0 in 5+ unit buildings).
Forward outlook
- Local home prices are declining (-3.0%/yr); year-one equity from $591 of loan paydown is wiped out by about $3k of value loss. Plan a longer hold.
- Winnebago County population projected at -20% by 2050 — secular population decline; favor cash flow + early exit over multi-decade hold.
- At projected returns (-3.0% appreciation + 3.0% rent growth), your $24k cash investment doubles in ~4 years — after that, you're playing with house money.
Negotiation context
- It's been on market 41 days — a 3% lower offer ($83k) is reasonable based on typical stale-listing flexibility.
- 11 sale attempts since 5y ago with the ask held roughly flat each time — persistent listings suggest the price (not the market) is what's stuck; bring a comps-based counter.
Questions for the listing agent
- It's been on market 41 days. Have you received any prior offers? Is the seller open to a 3% concession, seller financing, or rate buy-down credit?
- Is there a deadline driving the sale (1031 exchange, divorce, estate, relocation)? That informs how much negotiation room exists.
- Schools are B-rated — typically a magnet for longer-tenancy family renters. What's the average tenant stay here, and is there a school-zone premium baked into asking?
- What's the average days-on-market for RENTAL listings here right now (not sales)? A rising rental-DOM trend means longer vacancies and softer asking-rent achievability than the comps imply.
- What's the recent tenant-quality profile in this submarket — average credit score on applications, eviction rate, late-payment / NSF rate, and stable-employment percentage? A property-management company in the area should have these aggregated.
- How much new for-sale + rental construction is in the pipeline within 1–3 miles? Heavy new supply typically softens prices + rents 12–24 months out; constrained supply supports both.
Investment metrics
- 1% rule
- 2.02% ✓
- Cap rate
- 17.15%
- Cash-on-cash
- 38.76%
- DSCR
- 2.72
- GRM
- 4.1
CMA / ARV
- ARV (on-the-fly)
- $89,040
- Comps found
- 12
Show comp detail 12 sales within ~0.75 mi
| Address | Dist | Beds/Ba | Sqft | Sold | Price | $/sf | Match |
|---|---|---|---|---|---|---|---|
| 5456 White Pine Ln | 0.06mi | 3/2.0 | 1,680 (0%) | 7mo | $63,000 | $38 | 91 |
| 8535 Springwood Ct | 0.16mi | 3/2.0 | 1,600 (-5%) | 3mo | $90,000 | $56 | 82 |
| 5477 White Pine Ln | 0.03mi | 3/2.0 | 1,568 (-7%) | 10mo | $87,500 | $56 | 79 |
| 5371 Heartwood Ln | 0.22mi | 3/2.0 | 1,792 (+7%) | 2mo | $95,000 | $53 | 77 |
| 5476 Ebonywood Ln | 0.10mi | 3/2.0 | 1,456 (-13%) | 1mo | $66,500 | $46 | 72 |
| 8415 Tamarack Dr | 0.28mi | 3/2.0 | 1,792 (+7%) | 10mo | $84,900 | $47 | 68 |
| 8581 Springwood Ct | 0.12mi | 3/2.0 | 1,456 (-13%) | 6mo | $77,400 | $53 | 67 |
| 5411 Autumnash Ln | 0.23mi | 3/2.0 | 1,456 (-13%) | 4mo | $87,000 | $60 | 64 |
| 5492 Heartwood Ln | 0.14mi | 3/2.0 | 1,456 (-13%) | 9mo | $50,000 | $34 | 63 |
| 5615 Cypress Ln | 0.27mi | 3/2.5 | 1,848 (+10%) | 8mo | $105,000 | $57 | 62 |
| 8410 Hickory Tree Dr | 0.36mi | 3/2.0 | 1,848 (+10%) | 10mo | $95,000 | $51 | 58 |
| 5332 Cypress Ln | 0.28mi | 3/2.5 | 1,926 (+15%) | 8mo | $100,000 | $52 | 53 |
Match score weights: distance 35% · size 25% · config 20% · recency 20%. Top-matched comps best support the ARV.
Projected returns pro-forma
-3.0% appreciation · 3.0% rent growth · sell at horizon
- IRR
- 34.9%
- Equity multiple
- 2.48×
- Total profit
- $35,418
- Equity at exit
- $12,748
- IRR
- 41.7%
- Equity multiple
- 4.94×
- Total profit
- $94,361
- Equity at exit
- $7,392
Cash invested: $23,940 (down + closing). Projections, not guarantees.
Landlord ↔ Tenant lean methodology
- Overall (STATE)
- 43 Moderately Tenant-Leaning
- State Illinois
- 43 Moderately Tenant-Leaning · D+7
- County
- — inherits STATE
- City
- — inherits STATE
ZIP-level market 61073
- Home prices YoY
- -34.5%
- Active inventory
- 115
- Price-to-rent
- 4.1×
Monthly cashflow live
- Estimated rent
- $1,727 medium interval (Pro) →
- Mortgage (P&I)
- −$448
- Tax est. 1.5%
- −$107 /mo · $1,282/yr
- Insurance
- −$36
- HOA
- −$0
- Vacancy / Maint / Mgmt
- −$363
- Net cashflow
- $773
Break-even live
UW: 25.0% down · 7.5% · 30yr · 1.5% tax · 5.0% vac · 8.0% maint · 8.0% mgmt
Financing live
Cash to close
- Down payment
- $21,375
- Closing costs
- $2,565
- Reserves months
- —
- Total cash needed
- —
Loan-product check · same deal, 3 products live
Conventional
25% down · 7.5% · 30yr
- Down + closing
- —
- Monthly P&I
- —
- Monthly cashflow
- —
- DSCR
- —
- Eligible?
- —
Personal DTI + credit; lowest rate.
DSCR
20% down · 8.5% · 30yr
- Down + closing
- —
- Monthly P&I
- —
- Monthly cashflow
- —
- DSCR
- —
- Eligible?
- —
No personal income docs; deal must DSCR.
Hard money
10% down · 12.0% · 12mo
- Down + closing
- —
- Monthly P&I
- —
- Monthly cashflow
- —
- DSCR
- —
- Eligible?
- —
Short-term bridge; refi at stabilization.
Rent comps 2 comps
| Address | Beds | Baths | Sqft | Rent | $/sqft | DOM | Units | Dist |
|---|---|---|---|---|---|---|---|---|
| 5515 Tall Pines Pkwy Unit 1 Roscoe, IL | 2.0 | 1.0 | 1100 | $1,450 | $1.32 | 13d | 1 | 0.85mi |
| 6410 Harvest Ln Machesney Park, IL | 2.0–3.0 | 2.0 | 1535 | $2,000 | $1.30 | 13d | 2 | 1.17mi |
Listing history 36 events
-
2026-06-01statusdays on market $85,500 Pending 41 DOM
-
2026-05-31days on market $85,500 Active 40 DOM
-
2026-05-30days on market $85,500 Active 39 DOM
-
2026-04-21$85,500 Active
-
2026-04-09historical
-
2026-03-31price $95,500
-
2025-07-25soldstatus $90,000 Closed
-
2025-07-25soldstatus $90,000 Closed
-
2025-07-07status Pending
-
2025-07-07status Pending
-
2025-06-24status Active
-
2025-06-24status Active
-
2025-06-09status Pending
-
2025-06-09status Pending
-
2025-06-02$94,900 Active
-
2025-06-02$94,900 Active
-
2023-06-01soldstatus $82,500 Closed
-
2023-04-18status Pending
-
2023-04-14price $80,000
-
2023-04-03$85,000 Active
-
2022-07-19soldstatus $76,900 Closed
-
2022-07-19soldstatus $76,900
-
2022-06-07status Pending
-
2022-06-01price $76,900
-
2022-05-27status Active
-
2022-05-15status Pending
-
2022-05-02price $79,900
-
2022-04-08$85,000 Active
-
2022-04-08$76,900
-
2021-07-23soldstatus $71,000 Closed
-
2021-07-23soldstatus $71,000
-
2021-07-14status Pending
-
2021-06-28status Pending
-
2021-06-22price $71,000
-
2021-06-11$79,900 New
-
2021-06-11$71,000
ⓘ Source: listings_history table (triggers on properties + properties_extension) + one-shot
backfill from property_details.listing_events for pre-trigger history.
Climate risk First Street
- Flood 1/10 Low FEMA zone X (unshaded) · 0% chance over 30 yrs
- Wildfire 1/10 Low
- Heat 3/10 Moderate 7 d/yr ≥101°F today · 15 d/yr by 30 yrs out
- Wind 2/10 Low
- Air quality 3/10 Moderate 2 unhealthy d/yr today · 3 by 30 yrs out
Nearby sold comps map
Loading sold comps map…
Walkable amenities ~0.75 mi
Loading nearby amenities…
Taxation est. · year 1
- Rental income
- $20,720
- − Mortgage interest
- −$4,789
- − Property taxes
- −$1,282
- − Insurance
- −$428
- − Repairs & maintenance
- −$1,658
- − Management
- −$1,658
- − Depreciation
- −$2,487
- Taxable income
- $8,419
- Est. tax owed @ 24.0%
- −$2,020
- After-tax cash flow
- $7,258/yr
For passive investors: Depreciation is non-cash, so a rental often shows a tax loss while cash-flowing — sheltering income. Rental losses are passive: they offset passive income freely, and up to $25,000/yr can offset ordinary (W-2) income if you actively participate and your MAGI is under $100k (phasing out to $0 by $150k); unused losses carry forward. On sale, claimed depreciation is recaptured at up to 25%, and gains may owe capital-gains tax (a 1031 exchange can defer both). Figures are a year-1 estimate at your 24.0% rate — not tax advice; consult a CPA.
Condition & rehab AI · 12 photos
This home is in average condition with cosmetic updates needed to enhance its curb appeal and interior aesthetics.
Repairs flagged
- Minor exterior siding — Light wear
- Minor interior paint — Faded
Value-add opportunities
- Both paint interior walls — Enhances curb appeal and interior aesthetics
- Both replace carpet — Improves comfort and reduces maintenance
- Both update kitchen cabinetry — Modernizes the space and adds value
Renovation cost estimate screening
| Repair item | Severity | Est. cost |
|---|---|---|
| exterior siding · Light wear | Minor | $500–3,000 |
| interior paint · Faded | Minor | $500–3,000 |
| Total estimated repair cost · 2 items | $1,000–6,000 |
Value-add ROI direction
- Both paint interior walls — Enhances curb appeal and interior aesthetics ↑
- Both replace carpet — Improves comfort and reduces maintenance ↑
- Both update kitchen cabinetry — Modernizes the space and adds value ↑
ⓘ Cost ranges are severity-bucket heuristics (US national rule-of-thumb). Get contractor quotes + a written scope before underwriting a rehab budget.
Schools (NCES district)
- District
- Harlem UD 122
- NCES district ID
- 1718240
- Math proficiency
- 17% ▼ -8.00%
- Reading proficiency
- 23% ▼ -7.00%
- Median HH income
- $51,228
- Composite
- 18.01/100
- National rank
- #8982
- State rank
- #418 of 620 in IL
Livability — Roscoe
- Score
- 82/100
- State rank
- #61
- US rank
- #1071
Category grades
Schools grade is shown separately in the Schools card above.
Census & demographics
- Census place
- Roscoe, IL
- City population
- 20,008
- Population (ZIP)
- 20,008
Population outlook (Winnebago County) Hauer SSP2
- Today (2025)
- 271,080 people
- By 2030
- 260,684 · -3.8%
- By 2040
- 238,405 · -12.1%
- By 2050
- 216,129 · -20.3%
- By 2075
- 172,882 · -36.2%
- By 2100
- 135,336 · -50.1%
Race, ethnicity, and origin ACS 2023
- Neighborhood character
- Predominantly White (86%)
- Race & ethnicity
- White 86% Hispanic / Latino 7% Two or more races 6% Black 3% Asian 2%
- Hispanic origin (detail)
- Mexican 5%
- Common ancestry
- Romanian 6% Portuguese 3% Lithuanian 2%
- Foreign-born
- 4% · Canada, China
- Languages at home
- 94% English-only · Spanish 4% Other Indo-European 1% Russian/Polish/Slavic 1%
Political lean MEDSL · Winnebago
- 2024 margin
- Toss-up / Even · D 49.5% · R 49.0% · Other 1.5%
- 2008→2024 swing
- -12.2pp toward R · 2008: 12.8pp · 2024: 0.6pp
- All cycles
- 2024: D+0.6 2020: D+2.5 2016: R+1.2 2012: D+5.7 2008: D+12.8
Not yet ingested
- Civics
- —
Market trends
- HPI YoY
- ▼ -131.22%
- Current HPI
- 248.8712
- Rent YoY
- —
- Metro
- —
- State GDP YoY
- ▲ 1.59%
- F500 in state
- 60
Industry mix (Fortune 500 HQ in IL)
| Industry | F500 HQs | Revenue |
|---|---|---|
| Insurance | 4 | $201B |
|
||
| Consumer Goods | 4 | $87B |
|
||
| Industrial Machinery | 3 | $64B |
|
||
| Healthcare | 2 | $55B |
|
||
| Retail / Pharmacy | 1 | $148B |
|
||
| Agriculture / Food | 1 | $86B |
|
||
Price history
+20.4% since first listed33 events — show timeline
- 2026-04-21 Listed $85,500 NWIAR
- 2026-04-09 Listing Removed — MRED as Distributed by MLS Grid
- 2026-03-31 Price Changed $95,500 NWIAR
- 2025-07-25 Sold (MLS) $90,000 NWIAR
- 2025-07-25 Sold (MLS) $90,000 MRED as Distributed by MLS Grid
- 2025-07-07 Pending — NWIAR
- 2025-07-07 Pending — MRED as Distributed by MLS Grid
- 2025-06-24 Relisted — MRED as Distributed by MLS Grid
- 2025-06-24 Relisted — NWIAR
- 2025-06-09 Pending — NWIAR
- 2025-06-09 Pending — MRED as Distributed by MLS Grid
- 2025-06-02 Listed $94,900 NWIAR
- 2025-06-02 Listed $94,900 MRED as Distributed by MLS Grid
- 2023-06-01 Sold (MLS) $82,500 NWIAR
- 2023-04-18 Pending — NWIAR
- 2023-04-14 Price Changed $80,000 NWIAR
- 2023-04-03 Listed $85,000 NWIAR
- 2022-07-19 Sold (MLS) $76,900 NWIAR
- 2022-07-19 Sold (MLS) $76,900 MRED as Distributed by MLS Grid
- 2022-06-07 Pending — MRED as Distributed by MLS Grid
- 2022-06-01 Price Changed $76,900 MRED as Distributed by MLS Grid
- 2022-05-27 Relisted — MRED as Distributed by MLS Grid
- 2022-05-15 Pending — MRED as Distributed by MLS Grid
- 2022-05-02 Price Changed $79,900 MRED as Distributed by MLS Grid
- 2022-04-08 Listed $76,900 NWIAR
- 2022-04-08 Listed $85,000 MRED as Distributed by MLS Grid
- 2021-07-23 Sold (MLS) $71,000 NWIAR
- 2021-07-23 Sold (MLS) $71,000 MRED as Distributed by MLS Grid
- 2021-07-14 Pending — MRED as Distributed by MLS Grid
- 2021-06-28 Pending — MRED as Distributed by MLS Grid
- 2021-06-22 Price Changed $71,000 MRED as Distributed by MLS Grid
- 2021-06-11 Listed $79,900 MRED as Distributed by MLS Grid
- 2021-06-11 Listed $71,000 NWIAR
Cash-flow waterfall
monthlySold comps — $/sqft
last 12 mo · ≤1 miLoading sold comps…