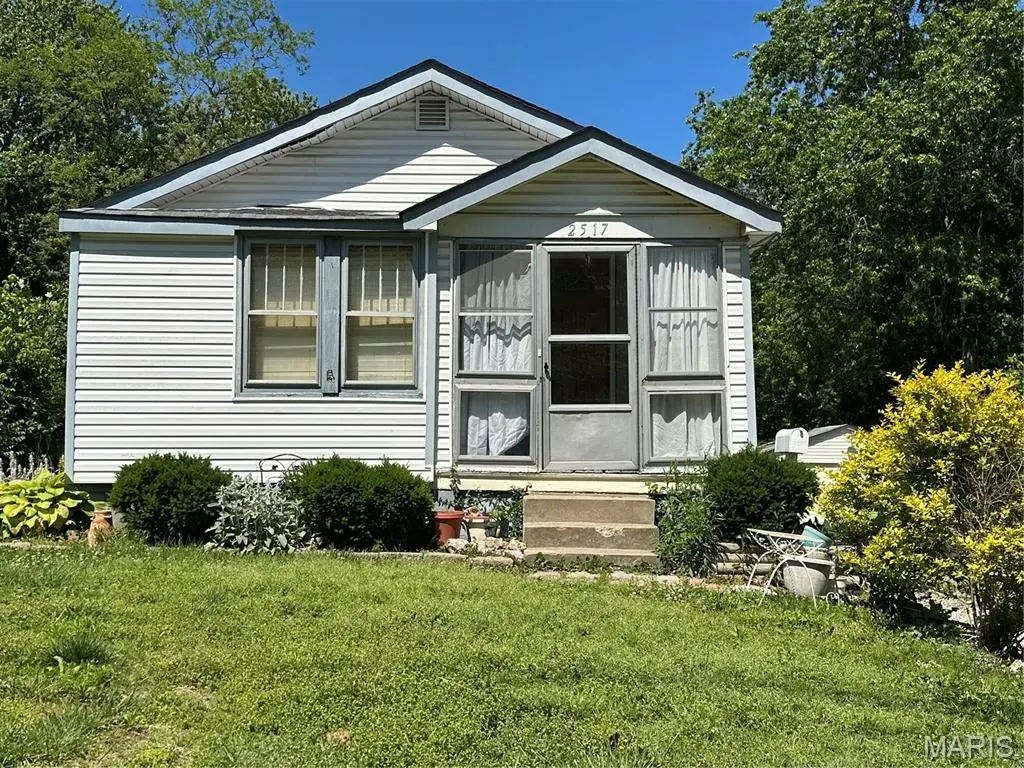
2517 Spencer Ave · Overland, MO
Flood risk 1/10 · Minimal
- FEMA flood zone
- X (unshaded)
- Chance of flooding over 30 yrs
- 0.0%
- Est. flood insurance / yr
- $473 – $860
Fire risk 1/10 · Minimal
- Est. fire insurance / yr
- $1,054 – $1,958
Heat risk 4/10 · Minor
- Hot days now (above 106°F)
- 7 days/yr
- Hot days in 30 yrs
- 20 days/yr
Wind risk 2/10 · Minimal
- Chance of severe wind over 30 yrs
- 1.0%
Air-quality risk 2/10 · Minimal
- Unhealthy air days now
- 1 days/yr
- Unhealthy air days in 30 yrs
- 3 days/yr
Risk factors via First Street. Map © Google.
Why this score? — see what drove the B- grade
The composite is a weighted blend of 9 inputs, each scored 0–100. Each bar is that input's sub-score; the figure is the points it added to the 100-point composite (weight × sub-score).
- Cash flow +30.0/30.0
- 1% rule +10.0/10.0
- DSCR +10.0/10.0
- ARV discount +7.5/15.0
- Livability +3.1/5.0
- Rent growth +3.0/5.0
- Condition / age +2.5/5.0
- Schools +1.7/10.0
- Appreciation +0.0/10.0
$50,000
🖨 Deal sheet (PDF) 📄 Offer letter ✓ Due diligence
Key facts
- 0.24 acre lot
- Built 1920
Neighborhood map
What this means for you Summary
Snapshot
- This is a 2-bed/1.0-bath single-family listed at $50k.
Deal economics
- At list price, monthly cash flow is $509 ($6k/yr) — positive.
- The deal already cash-flows at list — no discount required.
- Meets the 1% rule at list price ($1k rent vs $50k).
- Cap rate 18.5% vs local median 6.2% in Overland — top-decile yield for the area; either an underpriced asset or a hidden risk that comps aren't pricing in. Stress-test before assuming the spread holds.
Location & tenants
- Location reads 61/100 on livability (#436 in MO) — a middle-class / working-renter tenant base. Strengths: cost of living A+, housing A+; Watch: health & safety C-, crime F, amenities F.
- Ritenour (suburban): math 13% / reading 27% proficiency, ranked #304 of 324 in MO (top 94%) — low school quality limits family demand, transient renter base, plan for 1-2y turnover; 66% free/reduced lunch — lower-income household profile, screen leases tightly.
- Zoned schools: Marion Elem. (math 18% / reading 30%, grade F, #907 of 1,115 statewide, top 81%, 475 students, 99% FRL); Ritenour Sr. High (math 9% / reading 36%, grade F, #455 of 521 statewide, top 88%, 1,873 students, 100% FRL) — zoned schools average 100% FRL vs 66% district-wide (34 pts higher); higher-poverty schools than district average — tighter screening recommended.
- Market conditions: Rents rising (+2.0%/yr); 118 active listings in the ZIP; 7 comparable units currently listed for rent nearby; rentals at typical pace (median 25d on market — plan ~3-4 weeks tenant-placement turnaround); 43% of comp listings sitting > 30 days — soft ceiling on asking rent; 920 units permitted in St. Louis County in 2024 (250 in 5+ unit buildings).
Forward outlook
- Local home prices are declining (-3.0%/yr); year-one equity from $346 of loan paydown is wiped out by about $2k of value loss. Plan a longer hold.
- At projected returns (-3.0% appreciation + 2.0% rent growth), your $14k cash investment doubles in ~3 years — after that, you're playing with house money.
Negotiation context
- Only 0 days on market — expect competitive offers; lowballing is unlikely to land.
Risks & watch-outs
- Watch-outs: built in 1920 — expect roof / HVAC / electrical / plumbing capex.
Questions for the listing agent
- Built in 1920 — when were the roof, HVAC, electrical panel, plumbing, and water heater last replaced?
- Is there a deadline driving the sale (1031 exchange, divorce, estate, relocation)? That informs how much negotiation room exists.
- Schools are F-rated, which usually means shorter tenancies and higher turnover. Who's the typical renter profile here, and what's been the actual vacancy rate?
- Crime grade is F in this area — have there been break-ins, vandalism, or insurance claims at this property in the last 3 years? What carrier currently insures it and at what premium?
- What's the average days-on-market for RENTAL listings here right now (not sales)? A rising rental-DOM trend means longer vacancies and softer asking-rent achievability than the comps imply.
- What's the recent tenant-quality profile in this submarket — average credit score on applications, eviction rate, late-payment / NSF rate, and stable-employment percentage? A property-management company in the area should have these aggregated.
- How much new for-sale + rental construction is in the pipeline within 1–3 miles? Heavy new supply typically softens prices + rents 12–24 months out; constrained supply supports both.
Investment metrics
- 1% rule
- 2.26% ✓
- Cap rate
- 18.52%
- Cash-on-cash
- 43.65%
- DSCR
- 2.94
- GRM
- 3.7
CMA / ARV
- ARV (on-the-fly)
- $130,682
- Comps found
- 12
Show comp detail 12 sales within ~0.75 mi
| Address | Dist | Beds/Ba | Sqft | Sold | Price | $/sf | Match |
|---|---|---|---|---|---|---|---|
| 2339 Dawes Pl | 0.37mi | 1/1.0 (-1) | 728 (+1%) | 0mo | $139,900 | $192 | 76 |
| 2321 Dawes Pl | 0.41mi | 2/1.0 | 720 (-0%) | 5mo | $99,000 | $138 | 76 |
| 2324 Huntington Ave | 0.40mi | 2/2.0 | 720 (-0%) | 2mo | $130,000 | $181 | 75 |
| 3106 Quiet Ln | 0.58mi | 2/1.0 | 724 (+0%) | 3mo | $148,000 | $204 | 70 |
| 9440 Baltimore Ave | 0.56mi | 2/2.0 | 720 (-0%) | 4mo | $125,000 | $174 | 66 |
| 2242 Huntington Ave | 0.51mi | 1/1.0 (-1) | 702 (-3%) | 2mo | $125,000 | $178 | 65 |
| 2301 Burns Ave | 0.51mi | 2/1.0 | 672 (-7%) | 3mo | $165,000 | $246 | 62 |
| 9515 Cote Brilliante Ave | 0.69mi | 2/1.0 | 728 (+1%) | 8mo | $110,000 | $151 | 60 |
| 3219 Royalton Ave | 0.75mi | 2/1.0 | 792 (+10%) | 3mo | $102,500 | $129 | 47 |
| 2420 E Milton Ave Unit F | 0.72mi | 2/1.0 | 792 (+10%) | 5mo | $169,900 | $215 | 46 |
| 2220 Dawes Pl | 0.55mi | 2/1.0 | 816 (+13%) | 9mo | $145,000 | $178 | 45 |
| 9750 Flora Ave | 0.66mi | 2/2.0 | 816 (+13%) | 3mo | $199,900 | $245 | 41 |
Match score weights: distance 35% · size 25% · config 20% · recency 20%. Top-matched comps best support the ARV.
Projected returns pro-forma
-3.0% appreciation · 2.04% rent growth · sell at horizon
- IRR
- 39.4%
- Equity multiple
- 2.66×
- Total profit
- $23,295
- Equity at exit
- $7,455
- IRR
- 45.4%
- Equity multiple
- 5.13×
- Total profit
- $57,869
- Equity at exit
- $4,323
Cash invested: $14,000 (down + closing). Projections, not guarantees.
Landlord ↔ Tenant lean methodology
- Overall (STATE)
- 81 Strongly Landlord-Friendly
- State Missouri
- 81 Strongly Landlord-Friendly · R+10
- County
- — inherits STATE
- City
- — inherits STATE
ZIP-level market 63114
- Rents YoY
- 2.0%
- Active inventory
- 118
- Price-to-rent
- 3.7×
Monthly cashflow live
- Estimated rent
- $1,128 high interval (Pro) →
- Mortgage (P&I)
- −$262
- Tax from tax record
- −$99 /mo · $1,183/yr
- Insurance
- −$21
- HOA
- −$0
- Vacancy / Maint / Mgmt
- −$237
- Net cashflow
- $509
Break-even live
Sensitivity live
| Price | -10% $538 | -5% $523 | +0% $509 | +5% $495 | +10% $481 |
|---|---|---|---|---|---|
| Rent | -10% $420 | -5% $465 | +0% $509 | +5% $554 | +10% $598 |
| Rate | -1.0pp $534 | -0.5pp $522 | base $509 | +0.5pp $496 | +1.0pp $483 |
UW: 25.0% down · 7.5% · 30yr · 1.5% tax · 5.0% vac · 8.0% maint · 8.0% mgmt
Financing live
Cash to close
- Down payment
- $12,500
- Closing costs
- $1,500
- Reserves months
- —
- Total cash needed
- —
Loan-product check · same deal, 3 products live
Conventional
25% down · 7.5% · 30yr
- Down + closing
- —
- Monthly P&I
- —
- Monthly cashflow
- —
- DSCR
- —
- Eligible?
- —
Personal DTI + credit; lowest rate.
DSCR
20% down · 8.5% · 30yr
- Down + closing
- —
- Monthly P&I
- —
- Monthly cashflow
- —
- DSCR
- —
- Eligible?
- —
No personal income docs; deal must DSCR.
Hard money
10% down · 12.0% · 12mo
- Down + closing
- —
- Monthly P&I
- —
- Monthly cashflow
- —
- DSCR
- —
- Eligible?
- —
Short-term bridge; refi at stabilization.
Rent comps 7 comps
| Address | Beds | Baths | Sqft | Rent | $/sqft | DOM | Units | Dist |
|---|---|---|---|---|---|---|---|---|
| 2323 Woodson Rd Apt I Overland, MO | 1.0 | 1.0 | 650 | $875 | $1.35 | 8d | 1 | 0.54mi |
| 2323 Woodson Rd Apt J Overland, MO | 1.0 | 1.0 | 605 | $875 | $1.45 | 44d | 1 | 0.54mi |
| 2201 Gaebler Ave Unit A Overland, MO | 2.0 | 1.0 | 710 | $1,250 | $1.76 | 24d | 1 | 0.71mi |
| 3208 Dix Ave Saint Louis, MO | 2.0 | 1.0 | 656 | $1,235 | $1.88 | 11d | 1 | 0.73mi |
| 10214 Saint Anthony Ln Saint Ann, MO | 2.0 | 1.0 | 734 | $1,200 | $1.63 | 44d | 1 | 1.24mi |
| 8700 Crocus Ln Saint Louis, MO | 1.0 | 1.0 | 700 | $950 | $1.36 | 8d | 2 | 1.40mi |
| 3710 Geraldine Ave Apt 3 St Ann, MO | 1.0 | 1.0 | 400 | $675 | $1.69 | 44d | 1 | 1.41mi |
Listing history 2 events
-
2026-05-18$50,000
-
2026-05-18historical
ⓘ Source: listings_history table (triggers on properties + properties_extension) + one-shot
backfill from property_details.listing_events for pre-trigger history.
Tax reassessment forecast MO · Resets to sale price
- Current annual tax
- $1,183 · $99/mo
- Projected year-2 tax
- $1,183 · $99/mo
- Expected delta
- $0/yr ($0/mo · 0.0%)
ⓘ Screening estimate from a state-policy table — verify with the county assessor before closing.
Climate risk First Street
- Flood 1/10 Low FEMA zone X (unshaded) · 0% chance over 30 yrs
- Wildfire 1/10 Low
- Heat 4/10 Moderate 7 d/yr ≥106°F today · 20 d/yr by 30 yrs out
- Wind 2/10 Low 100% chance of damaging wind over 30 yrs
- Air quality 2/10 Low 1 unhealthy d/yr today · 3 by 30 yrs out
Nearby sold comps map
Loading sold comps map…
Walkable amenities ~0.75 mi
Loading nearby amenities…
Taxation est. · year 1
- Rental income
- $13,533
- − Mortgage interest
- −$2,801
- − Property taxes
- −$1,183
- − Insurance
- −$250
- − Repairs & maintenance
- −$1,083
- − Management
- −$1,083
- − Depreciation
- −$1,455
- Taxable income
- $5,679
- Est. tax owed @ 24.0%
- −$1,363
- After-tax cash flow
- $4,748/yr
For passive investors: Depreciation is non-cash, so a rental often shows a tax loss while cash-flowing — sheltering income. Rental losses are passive: they offset passive income freely, and up to $25,000/yr can offset ordinary (W-2) income if you actively participate and your MAGI is under $100k (phasing out to $0 by $150k); unused losses carry forward. On sale, claimed depreciation is recaptured at up to 25%, and gains may owe capital-gains tax (a 1031 exchange can defer both). Figures are a year-1 estimate at your 24.0% rate — not tax advice; consult a CPA.
Schools (NCES district)
- District
- Ritenour
- NCES district ID
- 2926640
- Math proficiency
- 13% ▼ -14.00%
- Reading proficiency
- 27% ▼ -7.00%
- Median HH income
- $41,410
- Composite
- 17.04/100
- National rank
- #9125
- State rank
- #304 of 324 in MO
Livability — Overland
- Score
- 61/100
- State rank
- #436
- US rank
- #17870
Category grades
Schools grade is shown separately in the Schools card above.
Census & demographics
- Census place
- Overland, MO
- County
- Saint Louis County · 888,823 people
- City population
- 33,969
- Metro
- St. Louis, MO-IL
- Population (ZIP)
- 33,969
- Household income
- $55,870
- Rent vs Own
- Severe rent burden
- 1595.0
Population outlook (St. Louis County) Hauer SSP2
- Today (2025)
- 1,025,227 people
- By 2030
- 1,028,023 · +0.3%
- By 2040
- 1,020,940 · -0.4%
- By 2050
- 1,007,280 · -1.8%
- By 2075
- 987,277 · -3.7%
- By 2100
- 921,984 · -10.1%
Race, ethnicity, and origin ACS 2023
- Neighborhood character
- Diverse neighborhood (Simpson 0.64)
- Race & ethnicity
- White 50% Black 30% Hispanic / Latino 11% Two or more races 6% Asian 2%
- Hispanic origin (detail)
- Mexican 7%
- Common ancestry
- Lithuanian 3% Italian 2% Romanian 1%
- Foreign-born
- 9% · Canada, Vietnam
- Languages at home
- 84% English-only · Spanish 10% French/Haitian/Cajun 2% Tagalog/Filipino 1%
Political lean MEDSL · St. Louis
- 2024 margin
- Strong D (+23.4) · D 60.8% · R 37.4% · Other 1.7%
- 2008→2024 swing
- +3.5pp toward D · 2008: 19.9pp · 2024: 23.4pp
- All cycles
- 2024: D+23.4 2020: D+24.0 2016: D+16.2 2012: D+13.7 2008: D+19.9
Not yet ingested
- Civics
- —
Market trends
- HPI YoY
- ▼ -276.62%
- Current HPI
- 223.9305
- Rent YoY
- ▲ 2.04%
- Metro
- St. Louis, MO-IL
- State GDP YoY
- ▲ 1.84%
- F500 in state
- 20
Industry mix (Fortune 500 HQ in MO)
| Industry | F500 HQs | Revenue |
|---|---|---|
| Healthcare | 1 | $163B |
|
||
| Insurance | 1 | $21B |
|
||
| Industrial Technology | 1 | $17B |
|
||
| Retail | 1 | $16B |
|
||
| Industrial Distribution | 1 | $10B |
|
||
| Utilities | 1 | $9B |
|
||
Price history
2 events — show timeline
- 2026-05-18 Delisted — MARIS as Distributed by MLS Grid
- 2026-05-18 Listed $50,000 MARIS as Distributed by MLS Grid
Property tax history
+3.3%/yrLatest (2022): $1,183 · +0.0% YoY. Source: county tax records.
Cash-flow waterfall
monthlySold comps — $/sqft
last 12 mo · ≤1 miLoading sold comps…