1679 S State St · Kent Acres, DE
Flood risk No data
- FEMA flood zone
- —
- Chance of flooding over 30 yrs
- —
- Est. flood insurance / yr
- —
Fire risk No data
- Est. fire insurance / yr
- —
Heat risk No data
- Hot days now (above threshold)
- —
- Hot days in 30 yrs
- —
Wind risk No data
- Chance of severe wind over 30 yrs
- —
Air-quality risk No data
- Unhealthy air days now
- —
- Unhealthy air days in 30 yrs
- —
Risk factors via First Street. Map © Google.
Why this score? — see what drove the B- grade
The composite is a weighted blend of 9 inputs, each scored 0–100. Each bar is that input's sub-score; the figure is the points it added to the 100-point composite (weight × sub-score).
- Cash flow +30.0/30.0
- 1% rule +10.0/10.0
- DSCR +10.0/10.0
- ARV discount +7.5/15.0
- Schools +3.3/10.0
- Livability +3.3/5.0
- Rent growth +3.0/5.0
- Condition / age +2.8/5.0
- Appreciation +0.0/10.0
$59,900
🖨 Deal sheet 📄 Offer letter ✓ Due diligence
Listing remarks
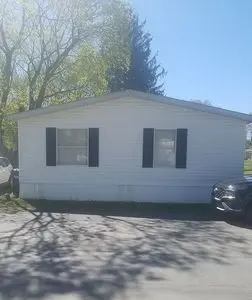
Spacious 1998 Skyline Double Wide Large Livingroom with ceiling fan Eat In kitchen with ceiling fan vinyl flooring All appliances good working condition Laundry Area has a washer /dryer Large yard nice for family gatherings Well Maintained Plumbing and Electric Located in Lakeland Mobile Home Park Lot rent - $600
Key facts
- Laundry area
- Eat in kitchen
- Large yard
Tags
Neighborhood map
What this means for you Summary
Snapshot
- This is a 3-bed/2.0-bath manufactured listed at $60k. Condition is rated average.
Deal economics
- At list price, monthly cash flow is $964 ($12k/yr) — positive.
- The deal already cash-flows at list — no discount required.
- Meets the 1% rule at list price ($2k rent vs $60k).
- Recommended offer: $59k (1.5% below list) — sets the bar for market timing.
Location & tenants
- Location reads 66/100 on livability (#41 in DE) — a middle-class / working-renter tenant base. Strengths: crime A+, cost of living A+, health & safety B; Watch: schools F, amenities F, commute F.
- Caesar Rodney School District (suburban): math 26% / reading 49% proficiency, ranked #9 of 26 in DE (top 35%) — families likely to look elsewhere, expect single-tenant / working-renter base with shorter leases.
- Market conditions: Rents rising (+2.0%/yr); 184 active listings in the ZIP; 5 comparable units currently listed for rent nearby; rentals lingering (median 44d on market — plan ~5-8 weeks vacancy on turnover, expect pricing pressure); 100% of comp listings sitting > 30 days — soft ceiling on asking rent; 1,201 units permitted in Kent County in 2024 (116 in 5+ unit buildings).
- This rent runs 32% of the median local income ($66k/yr) — at the standard rent-burdened threshold; future hikes will face affordability resistance.
Forward outlook
- Local home prices are declining (-3.0%/yr); year-one equity from $414 of loan paydown is wiped out by about $2k of value loss. Plan a longer hold.
- Kent County population projected at +22% by 2050 — long-run rental-demand tailwind backs the buy-and-hold thesis.
- At projected returns (-3.0% appreciation + 2.0% rent growth), your $17k cash investment doubles in ~2 years — after that, you're playing with house money.
Negotiation context
- It's been on market 24 days — a 2% lower offer ($59k) is reasonable based on typical stale-listing flexibility.
Questions for the listing agent
- Is there a deadline driving the sale (1031 exchange, divorce, estate, relocation)? That informs how much negotiation room exists.
- Schools are F-rated, which usually means shorter tenancies and higher turnover. Who's the typical renter profile here, and what's been the actual vacancy rate?
- What's the average days-on-market for RENTAL listings here right now (not sales)? A rising rental-DOM trend means longer vacancies and softer asking-rent achievability than the comps imply.
- What's the recent tenant-quality profile in this submarket — average credit score on applications, eviction rate, late-payment / NSF rate, and stable-employment percentage? A property-management company in the area should have these aggregated.
- How much new for-sale + rental construction is in the pipeline within 1–3 miles? Heavy new supply typically softens prices + rents 12–24 months out; constrained supply supports both.
Investment metrics
- 1% rule
- 2.91% ✓
- Cap rate
- 25.60%
- Cash-on-cash
- 68.96%
- DSCR
- 4.07
- GRM
- 2.9
CMA / ARV
No comps found within radius.
Projected returns pro-forma
-3.0% appreciation · 2.03% rent growth · sell at horizon
- IRR
- 67.3%
- Equity multiple
- 3.98×
- Total profit
- $50,017
- Equity at exit
- $8,931
- IRR
- 71.2%
- Equity multiple
- 7.91×
- Total profit
- $115,918
- Equity at exit
- $5,179
Cash invested: $16,772 (down + closing). Projections, not guarantees.
Landlord ↔ Tenant lean methodology
- Overall (STATE)
- 70 Landlord-Friendly
- State Delaware
- 70 Landlord-Friendly · D+7
- County
- — inherits STATE
- City
- — inherits STATE
ZIP-level market 19901
- Rents YoY
- 2.0%
- Active inventory
- 184
- Price-to-rent
- 2.9×
Monthly cashflow live
- Estimated rent
- $1,744 high interval (Pro) →
- Mortgage (P&I)
- −$314
- Tax est. 1.5%
- −$75 /mo · $898/yr
- Insurance
- −$25
- HOA
- −$0
- Vacancy / Maint / Mgmt
- −$366
- Net cashflow
- $964
Break-even live
UW: 25.0% down · 7.5% · 30yr · 1.5% tax · 5.0% vac · 8.0% maint · 8.0% mgmt
Financing live
Cash to close
- Down payment
- $14,975
- Closing costs
- $1,797
- Reserves months
- —
- Total cash needed
- —
Loan-product check · same deal, 3 products live
Conventional
25% down · 7.5% · 30yr
- Down + closing
- —
- Monthly P&I
- —
- Monthly cashflow
- —
- DSCR
- —
- Eligible?
- —
Personal DTI + credit; lowest rate.
DSCR
20% down · 8.5% · 30yr
- Down + closing
- —
- Monthly P&I
- —
- Monthly cashflow
- —
- DSCR
- —
- Eligible?
- —
No personal income docs; deal must DSCR.
Hard money
10% down · 12.0% · 12mo
- Down + closing
- —
- Monthly P&I
- —
- Monthly cashflow
- —
- DSCR
- —
- Eligible?
- —
Short-term bridge; refi at stabilization.
Rent comps 5 comps
| Address | Beds | Baths | Sqft | Rent | $/sqft | DOM | Units | Dist |
|---|---|---|---|---|---|---|---|---|
| 200 Beechwood Ave Unit 55 Dover, DE | 2.0 | 2.0 | 1168 | $1,550 | $1.33 | 43d | 1 | 0.12mi |
| 4 Carolee Dr Dover, DE | 3.0 | 1.0 | 1008 | $2,100 | $2.08 | 43d | 1 | 0.78mi |
| 51 Webbs Ln Dover, DE | 2.0 | 1.0–1.5 | 787 | $1,525 | $1.94 | 43d | 11 | 1.06mi |
| 2030 Generals Way Dover, DE | 2.0 | 1.0 | 660 | $1,499 | $2.27 | 43d | 1 | 1.10mi |
| 3002 Generals Way Dover, DE | 3.0 | 2.5 | 1300 | $1,500 | $1.15 | 43d | 1 | 1.14mi |
Listing history 16 events
-
2026-06-19days on market $59,900 Active 24 DOM
-
2026-06-18days on market $59,900 Active 23 DOM
-
2026-06-17days on market $59,900 Active 22 DOM
-
2026-06-16days on market $59,900 Active 21 DOM
-
2026-06-15days on market $59,900 Active 20 DOM
-
2026-06-14days on market $59,900 Active 18 DOM
-
2026-06-13days on market $59,900 Active 17 DOM
-
2026-06-10days on market $59,900 Active 15 DOM
-
2026-06-09days on market $59,900 Active 14 DOM
-
2026-06-08days on market $59,900 Active 13 DOM
-
2026-06-07days on market $59,900 Active 12 DOM
-
2026-06-02days on market $59,900 Active 7 DOM
-
2026-06-01days on market $59,900 Active 6 DOM
-
2026-05-31days on market $59,900 Active 5 DOM
-
2026-05-30days on market $59,900 Active 4 DOM
-
2026-05-26$59,900 Active
ⓘ Source: listings_history table (triggers on properties + properties_extension) + one-shot
backfill from property_details.listing_events for pre-trigger history.
Nearby sold comps map
Loading sold comps map…
Walkable amenities ~0.75 mi
Loading nearby amenities…
Taxation est. · year 1
- Rental income
- $20,928
- − Mortgage interest
- −$3,355
- − Property taxes
- −$898
- − Insurance
- −$300
- − Repairs & maintenance
- −$1,674
- − Management
- −$1,674
- − Depreciation
- −$1,743
- Taxable income
- $11,283
- Est. tax owed @ 24.0%
- −$2,708
- After-tax cash flow
- $8,857/yr
For passive investors: Depreciation is non-cash, so a rental often shows a tax loss while cash-flowing — sheltering income. Rental losses are passive: they offset passive income freely, and up to $25,000/yr can offset ordinary (W-2) income if you actively participate and your MAGI is under $100k (phasing out to $0 by $150k); unused losses carry forward. On sale, claimed depreciation is recaptured at up to 25%, and gains may owe capital-gains tax (a 1031 exchange can defer both). Figures are a year-1 estimate at your 24.0% rate — not tax advice; consult a CPA.
Condition & rehab AI · 1 photo
A well-maintained 1998 Skyline Double Wide mobile home with average exterior and interior conditions. Minor repairs and painting could significantly increase its resale and rental value.
Repairs flagged
- Minor Exterior siding — Some discoloration
- Minor Interior walls — Painted walls
Value-add opportunities
- Both Paint exterior siding — Enhances curb appeal and value
- Both Replace ceiling fans with LED lights — Improves energy efficiency and aesthetics
Renovation cost estimate screening
| Repair item | Severity | Est. cost |
|---|---|---|
| Exterior siding · Some discoloration | Minor | $500–3,000 |
| Interior walls · Painted walls | Minor | $500–3,000 |
| Total estimated repair cost · 2 items | $1,000–6,000 |
Value-add ROI direction
- Both Paint exterior siding — Enhances curb appeal and value ↑
- Both Replace ceiling fans with LED lights — Improves energy efficiency and aesthetics ↑
ⓘ Cost ranges are severity-bucket heuristics (US national rule-of-thumb). Get contractor quotes + a written scope before underwriting a rehab budget.
Schools (NCES district)
- District
- Caesar Rodney School District
- NCES district ID
- 1000180
- Math proficiency
- 26% ▼ -21.00%
- Reading proficiency
- 49% ▼ -14.00%
- Median HH income
- $61,187
- Composite
- 33.4/100
- National rank
- #5475
- State rank
- #9 of 26 in DE
Livability — Kent Acres
- Score
- 66/100
- State rank
- #41
- US rank
- #11466
Category grades
Schools grade is shown separately in the Schools card above.
Census & demographics
- Census place
- Kent Acres, DE
- County
- Kent County · 82,184 people
- Metro
- Dover, DE
- Population (ZIP)
- 37,763
- Household income
- $66,388
- Rent vs Own
- Severe rent burden
- 1320.0
Population outlook (Kent County) Hauer SSP2
- Today (2025)
- 194,477 people
- By 2030
- 204,351 · +5.1%
- By 2040
- 222,135 · +14.2%
- By 2050
- 236,483 · +21.6%
- By 2075
- 266,327 · +36.9%
- By 2100
- 275,335 · +41.6%
Race, ethnicity, and origin ACS 2023
- Neighborhood character
- Diverse neighborhood (Simpson 0.68)
- Race & ethnicity
- White 44% Black 34% Hispanic / Latino 13% Two or more races 11% Asian 2%
- Hispanic origin (detail)
- Mexican 3% Puerto Rican 6%
- Common ancestry
- Romanian 2% Hispanic 1% Lithuanian 1%
- Foreign-born
- 7% · Canada, South Korea
- Languages at home
- 88% English-only · Spanish 7% French/Haitian/Cajun 1% Other Asian/Pacific 1%
Political lean MEDSL · Kent
- 2024 margin
- Toss-up / Even · D 50.2% · R 48.2% · Other 1.7%
- 2008→2024 swing
- -7.8pp toward R · 2008: 9.8pp · 2024: 2.0pp
- All cycles
- 2024: D+2.0 2020: D+4.1 2016: R+4.9 2012: D+4.9 2008: D+9.8
Not yet ingested
- Civics
- —
Market trends
- HPI YoY
- ▼ -113.29%
- Current HPI
- 199.5132
- Rent YoY
- ▲ 2.03%
- Metro
- Dover, DE
- State GDP YoY
- —
- F500 in state
- 0
Price history
1 event — show timeline
- 2026-05-26 Listed $59,900 FSBO.com
Cash-flow waterfall
monthlySold comps — $/sqft
last 12 mo · ≤1 miLoading sold comps…