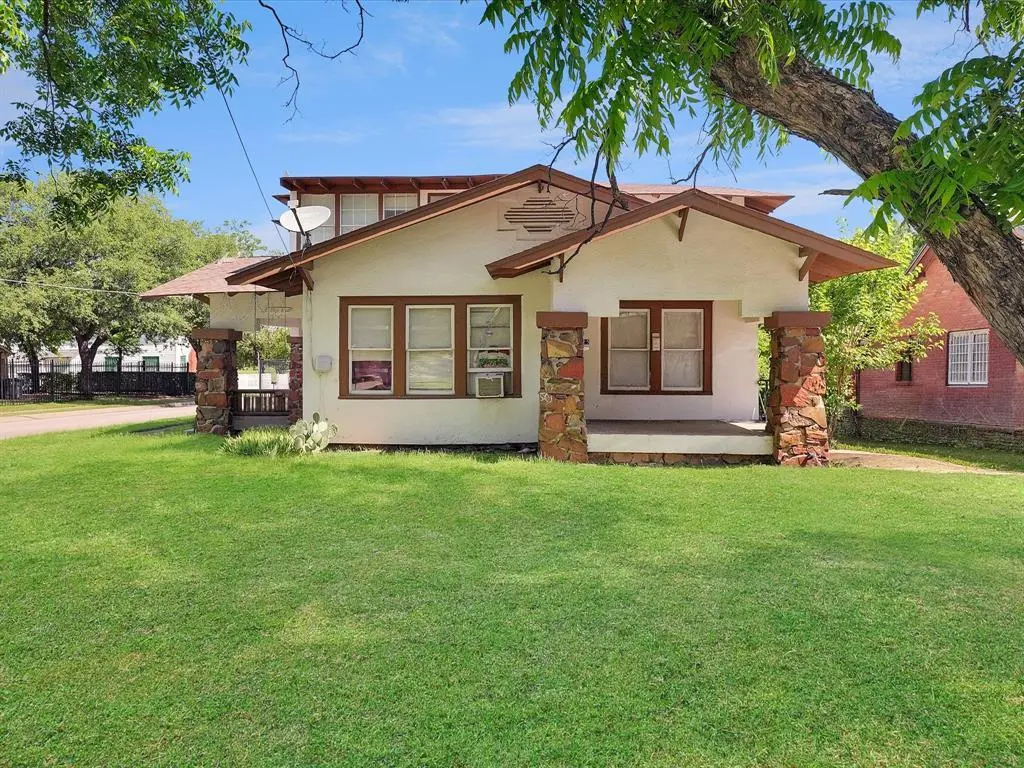
 Triplex
503 E 6th St · Dallas, TX
Flood risk 1/10 · Minimal
- FEMA flood zone
- X (unshaded)
- Chance of flooding over 30 yrs
- 0.0%
- Est. flood insurance / yr
- $507 – $1,088
Fire risk 1/10 · Minimal
- Est. fire insurance / yr
- $1,222 – $2,270
Heat risk 7/10 · Major
- Hot days now (above 109°F)
- 7 days/yr
- Hot days in 30 yrs
- 23 days/yr
Wind risk 6/10 · Moderate
- Chance of severe wind over 30 yrs
- 27.0%
Air-quality risk 3/10 · Minor
- Unhealthy air days now
- 2 days/yr
- Unhealthy air days in 30 yrs
- 3 days/yr
Risk factors via First Street. Map © Google.
Why this score? — see what drove the B+ grade
The composite is a weighted blend of 9 inputs, each scored 0–100. Each bar is that input's sub-score; the figure is the points it added to the 100-point composite (weight × sub-score).
- Cash flow +29.1/30.0
- DSCR +10.0/10.0
- Appreciation +10.0/10.0
- 1% rule +8.0/10.0
- ARV discount +7.5/15.0
- Livability +4.0/5.0
- Schools +2.8/10.0
- Condition / age +2.5/5.0
- Rent growth +1.8/5.0
$599,900
🖨 Deal sheet 📄 Offer letter ✓ Due diligence
Multi-family units
County records classify this as Multi-Family (5+ Unit). Listing-text estimate: 3 units. estimate disagrees with records
5+ unit building — per-unit beds/baths from public records are typically unavailable; the breakdown below (if shown) is an estimate from the listing text.
Listing remarks
Exceptional investment opportunity for a tripex in the heart of Lake Cliff, Dallas! This unique triplex offers three units with flexible layouts ideal to be rented, multigenerational living, or to live in one unit and rent out the rest. Unit 501 features a spacious 1-bedroom, 1-bath layout with 776 sq. ft. , highlighted by a large living room, eat-in kitchen, and walk-in closet. Unit 503 offers 1,110 sq. ft. with 3 bedrooms, 1 bath, an expansive living area, and generous kitchen and dining spaces. Unit 505 includes 2 bedrooms, 1 bath, and 899 sq. ft. featuring a spacious eat-in kitchen and comfortable living room. Conveniently located near downtown Dallas, walking distance to Bishop Arts, s
Key facts
- Walk-in closet
- Large living room
- Flexible layouts
Tags
Property features AI
Finance
- Other: Triplex with 3 units and 1 building; Total building area reported as 2785 (source: plans)
- Financial info: Listing accepts Cash, Conventional, FHA, and VA financing; Reported gross annual income and expenses (values provided); Net operating income reported
- HOA & community: No homeowners association
Exterior
- Parking: No garage; parking lot with 6 parking spaces
- Utilities: City water; City sewer; Not in a municipal utility district
- Home design: Residential income property (Triplex)
- Construction: Built in 1921; Stucco construction; Composition roof; Pillar/post/pier foundation
- Exterior features: Chain link fencing; Lot smaller than 0.5 acre
Interior
- Kitchen: Appliances: Other
- Bedrooms: 6 bedrooms
- Flooring: Carpet; Wood
- Bathrooms: 3 full bathrooms
- Heating & cooling: Central heating; Central air; Electric cooling
- Interior features: Eat-in kitchen; Two levels
Neighborhood map
What this means for you Summary
Snapshot
- This is a 3 × 2-bed/1.0-bath units multifamily listed at $600k.
Deal economics
- At list price, monthly cash flow is $2k ($25k/yr) — positive. Per door: $693/mo.
- The deal already cash-flows at list — no discount required.
- Meets the 1% rule at list price ($8k rent vs $600k).
- Recommended offer: $591k (1.5% below list) — sets the bar for market timing.
- Cap rate 10.5% vs local median 2.3% in Dallas — top-decile yield for the area; either an underpriced asset or a hidden risk that comps aren't pricing in. Stress-test before assuming the spread holds.
Location & tenants
- Location reads 81/100 on livability (#24 in TX, #1,380 nationally) — a professional / high-income tenant draw. Strengths: amenities A+, commute A+, housing A+; Watch: crime F.
- Dallas ISD (urban): math 31% / reading 36% proficiency, ranked #559 of 826 in TX (top 68%) — families likely to look elsewhere, expect single-tenant / working-renter base with shorter leases; 83% free/reduced lunch — lower-income household profile, screen leases tightly.
- Zoned schools: James Bowie El (math 37% / reading 47%, grade F, #1,335 of 4,322 statewide, top 33%, 345 students, 96% FRL).
- Market conditions: Rents soft (-2.7%/yr); 142 active listings in the ZIP; 40 comparable units currently listed for rent nearby; rentals leasing fast (median 14d on market — plan ~1-2 weeks tenant-placement turnaround); 12,577 units permitted in Dallas County in 2024 (6,829 in 5+ unit buildings).
- At $7,802/mo this rent would consume 199% of the median local household income ($47k/yr) (locally 948% of renters already pay >50% of income on rent) — very limited rent-growth headroom before tenants either downsize or default.
Forward outlook
- In year one you build about $64k of equity ($4k loan paydown + $60k appreciation (10.0% local appreciation)).
- Dallas County population projected at +35% by 2050 — long-run rental-demand tailwind backs the buy-and-hold thesis.
- At projected returns (10.0% appreciation + 0.0% rent growth), your $168k cash investment doubles in ~2 years — after that, you're playing with house money.
- By year 2, paydown + projected appreciation supports a ~$103k cash-out refi (75% LTV) — recoverable capital for the next deal without selling this one.
Negotiation context
- It's been on market 30 days — a 2% lower offer ($591k) is reasonable based on typical stale-listing flexibility.
Risks & watch-outs
- Watch-outs: built in 1921 — expect roof / HVAC / electrical / plumbing capex.
- Climate carrying-cost: major wind risk, 27% chance of damaging wind over 30y; extreme-heat days projected 7→23/yr by 2055 (HVAC capex compounding) — expect insurance premiums to compound above CPI over the hold.
Questions for the listing agent
- Can we see the unit-by-unit rent roll, current vacancy, and any below-market leases? What's the average tenancy length?
- What capital expenditures (roof, boiler, parking lot, exteriors) have been made in the last 5 years, and what's planned in the next 2?
- Built in 1921 — when were the roof, HVAC, electrical panel, plumbing, and water heater last replaced?
- Is there a deadline driving the sale (1031 exchange, divorce, estate, relocation)? That informs how much negotiation room exists.
- Crime grade is F in this area — have there been break-ins, vandalism, or insurance claims at this property in the last 3 years? What carrier currently insures it and at what premium?
- What's the average days-on-market for RENTAL listings here right now (not sales)? A rising rental-DOM trend means longer vacancies and softer asking-rent achievability than the comps imply.
- What's the recent tenant-quality profile in this submarket — average credit score on applications, eviction rate, late-payment / NSF rate, and stable-employment percentage? A property-management company in the area should have these aggregated.
- How much new apartment / multifamily construction is in the pipeline within 1–3 miles? Heavy new supply (>2% of stock underway) typically softens rents 12–24 months out; light construction supports rent growth.
Investment metrics
- 1% rule
- 1.30% ✓
- Cap rate
- 10.45%
- Cash-on-cash
- 14.86%
- DSCR
- 1.66
- GRM
- 6.4
CMA / ARV
No comps found within radius.
Projected returns pro-forma
10.0% appreciation · 0.0% rent growth · sell at horizon
- IRR
- 33.8%
- Equity multiple
- 3.60×
- Total profit
- $436,437
- Equity at exit
- $540,437
- IRR
- 28.2%
- Equity multiple
- 7.79×
- Total profit
- $1,140,255
- Equity at exit
- $1,165,474
Cash invested: $167,972 (down + closing). Projections, not guarantees.
Landlord ↔ Tenant lean methodology
- Overall (STATE)
- 87 Strongly Landlord-Friendly
- State Texas
- 87 Strongly Landlord-Friendly · R+5
- County
- — inherits STATE
- City
- — inherits STATE
ZIP-level market 75203
- Home prices YoY
- 31.8%
- Rents YoY
- -2.7%
- Active inventory
- 142
- Price-to-rent
- 19.2×
Monthly cashflow live
- Estimated rent
- $7,802 medium interval (Pro) →
- Mortgage (P&I)
- −$3,146
- Tax from tax record
- −$687 /mo · $8,248/yr
- Insurance
- −$250
- HOA
- −$0
- Vacancy / Maint / Mgmt
- −$1,638
- Net cashflow
- $2,080
Break-even live
3-unit breakdown (identical units grouped — click to expand)
| Units | Beds | Baths | Est. rent |
|---|---|---|---|
| 3× units | 2 | 1 | $7,803 |
| #1 | 2 | 1 | $2,601 |
| #2 | 2 | 1 | $2,601 |
| #3 | 2 | 1 | $2,601 |
| Total (3 units) | $7,802 | ||
UW: 25.0% down · 7.5% · 30yr · 1.5% tax · 5.0% vac · 8.0% maint · 8.0% mgmt
Financing live
Cash to close
- Down payment
- $149,975
- Closing costs
- $17,997
- Reserves months
- —
- Total cash needed
- —
Loan-product check · same deal, 3 products live
Conventional
25% down · 7.5% · 30yr
- Down + closing
- —
- Monthly P&I
- —
- Monthly cashflow
- —
- DSCR
- —
- Eligible?
- —
Personal DTI + credit; lowest rate.
DSCR
20% down · 8.5% · 30yr
- Down + closing
- —
- Monthly P&I
- —
- Monthly cashflow
- —
- DSCR
- —
- Eligible?
- —
No personal income docs; deal must DSCR.
Hard money
10% down · 12.0% · 12mo
- Down + closing
- —
- Monthly P&I
- —
- Monthly cashflow
- —
- DSCR
- —
- Eligible?
- —
Short-term bridge; refi at stabilization.
Rent comps 40 comps
| Address | Beds | Baths | Sqft | Rent | $/sqft | DOM | Units | Dist |
|---|---|---|---|---|---|---|---|---|
| 501 N Marsalis Ave Dallas, TX | 1.0 | 1.0 | 455 | $1,024 | $2.25 | 7d | 3 | 0.06mi |
| 406 Lansing St Dallas, TX | 2.0 | 2.0 | 1014 | $2,145 | $2.12 | 6d | 1 | 0.13mi |
| 606 N Marsalis Ave Dallas, TX | 2.0 | 1.0 | 800 | $1,475 | $1.84 | 11d | 2 | 0.14mi |
| 609 N Lancaster Ave Dallas, TX | 1.0–2.0 | 1.0 | 725 | $919 | $1.27 | 1d | 2 | 0.17mi |
| 506 N Lancaster Ave Unit 506A Dallas, TX | 1.0 | 1.0 | 798 | $1,400 | $1.75 | 2d | 1 | 0.18mi |
| 627 N Lancaster Ave Dallas, TX | 2.0 | 1.0–2.0 | 800 | $1,638 | $2.05 | 3d | 7 | 0.20mi |
| 230 E 5th St Unit 303 Dallas, TX | 1.0 | 1.0 | 665 | $1,469 | $2.21 | 24d | 1 | 0.20mi |
| 624 N Lancaster Ave Dallas, TX | 2.0 | 1.0–2.0 | 800 | $1,770 | $2.21 | 7d | 4 | 0.22mi |
| 523 N Ewing Ave Dallas, TX | 1.0 | 1.0 | 628 | $1,250 | $1.99 | 4d | 1 | 0.23mi |
| 405 N Ewing Ave Dallas, TX | 3.0 | 1.0–2.0 | 941 | $1,908 | $2.03 | 1d | 48 | 0.23mi |
| 511 N Ewing Ave Dallas, TX | 1.0 | 1.0 | 777 | $1,845 | $2.37 | 2d | 9 | 0.27mi |
| 321 E 8th St Dallas, TX | 1.0 | 1.0 | 544 | $999 | $1.84 | 3d | 1 | 0.30mi |
| 308 E 8th St Dallas, TX | 1.0 | 1.0 | 600 | $995 | $1.66 | 43d | 1 | 0.36mi |
| 308 E 8th St Unit A1-102 Dallas, TX | 1.0 | 1.0 | 600 | $995 | $1.66 | 24d | 1 | 0.36mi |
| 329 E Colorado Blvd Dallas, TX | 1.0–2.0 | 1.0–2.0 | 1086 | $1,380 | $1.27 | 24d | 2 | 0.37mi |
| 329 E Colorado Blvd Unit 1121 Dallas, TX | 1.0 | 1.0 | 822 | $1,344 | $1.64 | 43d | 1 | 0.37mi |
| 1207 N Zang Blvd Dallas, TX | 3.0 | 1.0–2.0 | 1009 | $1,815 | $1.80 | 1d | 29 | 0.38mi |
| 211 E Davis St Dallas, TX | 1.0–2.0 | 1.0–2.0 | 707 | $1,049 | $1.48 | 3d | 8 | 0.39mi |
| 409 E 9th St Dallas, TX | 1.0 | 1.0 | 538 | $970 | $1.80 | 43d | 4 | 0.39mi |
| 908 N Zang Blvd Unit A Dallas, TX | 1.0 | 1.0 | 780 | $925 | $1.19 | 43d | 1 | 0.39mi |
| 888 N Zang Blvd Dallas, TX | 1.0 | 1.0 | 750 | $1,644 | $2.19 | 6d | 5 | 0.40mi |
| 929 N Marsalis Ave Dallas, TX | 1.0–2.0 | 1.0–2.0 | 672 | $950 | $1.41 | 7d | 3 | 0.40mi |
| 120 E Colorado Blvd Dallas, TX | 1.0 | 1.0 | 659 | $863 | $1.31 | 43d | 1 | 0.42mi |
| 404 E 9th St Dallas, TX | 1.0 | 1.0 | 550 | $1,150 | $2.09 | 1d | 2 | 0.42mi |
| 900 E Colorado Blvd Dallas, TX | 3.0 | 1.0–2.0 | 914 | $1,781 | $1.95 | 1d | 31 | 0.45mi |
| 111 W Davis St Dallas, TX | 1.0–2.0 | 1.0–2.0 | 999 | $1,381 | $1.38 | 2d | 33 | 0.46mi |
| 1409 N Zang Blvd Dallas, TX | 1.0–2.0 | 1.0–2.0 | 940 | $1,266 | $1.35 | 2d | 30 | 0.47mi |
| 1602 E Jefferson Blvd Dallas, TX | 1.0 | 1.0 | 617 | $1,067 | $1.73 | 43d | 1 | 0.49mi |
| 1407 N Zang Blvd Dallas, TX | 2.0 | 2.0 | 1066 | $1,730 | $1.62 | 43d | 1 | 0.50mi |
| 1407 N Zang Blvd Dallas, TX | 1.0 | 1.0 | 664 | $1,320 | $1.99 | 24d | 1 | 0.50mi |
| 1407 N Zang Blvd Dallas, TX | 2.0 | 2.0 | 1066 | $1,730 | $1.62 | 21d | 1 | 0.50mi |
| 701 Elsbeth St Dallas, TX | 2.0 | 1.0 | 850 | $1,150 | $1.35 | 43d | 1 | 0.54mi |
| 615 Elsbeth St Dallas, TX | 1.0–2.0 | 1.0 | 760 | $1,300 | $1.71 | 6d | 2 | 0.57mi |
| 387 E Greenbriar Ln Dallas, TX | 1.0 | 1.0 | 750 | $1,200 | $1.60 | 20d | 1 | 0.61mi |
| 387 E Greenbriar Ln Dallas, TX | 2.0 | 2.0 | 1110 | $1,820 | $1.64 | 24d | 1 | 0.61mi |
| 387 E Greenbriar Ln Dallas, TX | 1.0 | 1.0 | 750 | $1,200 | $1.60 | 43d | 1 | 0.61mi |
| 387 E Greenbriar Ln Unit 701 Dallas, TX | 2.0 | 2.0 | 1066 | $1,458 | $1.37 | 43d | 1 | 0.61mi |
| 387 E Greenbriar Ln Unit 701 Dallas, TX | 1.0 | 1.0 | 653 | $1,277 | $1.96 | 24d | 1 | 0.61mi |
| 387 E Greenbriar Ln Unit 701 Dallas, TX | 2.0 | 2.0 | 1066 | $1,458 | $1.37 | 21d | 1 | 0.61mi |
| 320 W Canty St Unit 2 Dallas, TX | 1.0 | 1.0 | 795 | $1,425 | $1.79 | 13d | 1 | 0.61mi |
Listing history 14 events
-
2026-06-18days on market $599,900 Active 30 DOM
-
2026-06-17days on market $599,900 Active 29 DOM
-
2026-06-16days on market $599,900 Active 28 DOM
-
2026-06-15days on market $599,900 Active 27 DOM
-
2026-06-13days on market $599,900 Active 25 DOM
-
2026-06-09days on market $599,900 Active 21 DOM
-
2026-06-08days on market $599,900 Active 20 DOM
-
2026-06-07days on market $599,900 Active 19 DOM
-
2026-06-04days on market $599,900 Active 16 DOM
-
2026-06-03days on market $599,900 Active 15 DOM
-
2026-06-02days on market $599,900 Active 14 DOM
-
2026-06-01days on market $599,900 Active 13 DOM
-
2026-05-31days on market $599,900 Active 12 DOM
-
2026-05-19$599,900 Active
ⓘ Source: listings_history table (triggers on properties + properties_extension) + one-shot
backfill from property_details.listing_events for pre-trigger history.
Tax reassessment forecast TX · Resets to sale price
- Current annual tax
- $8,248 · $687/mo
- Projected year-2 tax
- $10,978 · $915/mo
- Expected delta
- +$2,731/yr (+$228/mo · 33.1%)
ⓘ Screening estimate from a state-policy table — verify with the county assessor before closing.
Climate risk First Street
- Flood 1/10 Low FEMA zone X (unshaded) · 0% chance over 30 yrs
- Wildfire 1/10 Low
- Heat 7/10 Severe 7 d/yr ≥109°F today · 23 d/yr by 30 yrs out
- Wind 6/10 Major 27% chance of damaging wind over 30 yrs
- Air quality 3/10 Moderate 2 unhealthy d/yr today · 3 by 30 yrs out
Nearby sold comps map
Loading sold comps map…
Walkable amenities ~0.75 mi
Loading nearby amenities…
Taxation est. · year 1
- Rental income
- $93,624
- − Mortgage interest
- −$33,604
- − Property taxes
- −$8,248
- − Insurance
- −$3,000
- − Repairs & maintenance
- −$7,490
- − Management
- −$7,490
- − Depreciation
- −$17,452
- Taxable income
- $16,342
- Est. tax owed @ 24.0%
- −$3,922
- After-tax cash flow
- $21,043/yr
For passive investors: Depreciation is non-cash, so a rental often shows a tax loss while cash-flowing — sheltering income. Rental losses are passive: they offset passive income freely, and up to $25,000/yr can offset ordinary (W-2) income if you actively participate and your MAGI is under $100k (phasing out to $0 by $150k); unused losses carry forward. On sale, claimed depreciation is recaptured at up to 25%, and gains may owe capital-gains tax (a 1031 exchange can defer both). Figures are a year-1 estimate at your 24.0% rate — not tax advice; consult a CPA.
Schools (NCES district)
- District
- Dallas ISD
- NCES district ID
- 4816230
- Math proficiency
- 31% ▼ -16.00%
- Reading proficiency
- 36% ▼ -4.00%
- Median HH income
- $42,881
- Composite
- 28.41/100
- National rank
- #6763
- State rank
- #559 of 826 in TX
Livability — Dallas
- Score
- 81/100
- State rank
- #24
- US rank
- #1380
Category grades
Schools grade is shown separately in the Schools card above.
Census & demographics
- Census place
- Dallas, TX
- County
- Dallas County · 2,612,404 people
- City population
- 1,168,437
- Metro
- Dallas-Fort Worth-Arlington, TX
- Population (ZIP)
- 15,775
- Household income
- $46,989
- Rent vs Own
- Severe rent burden
- 948.0
Population outlook (Dallas County) Hauer SSP2
- Today (2025)
- 2,979,839 people
- By 2030
- 3,191,823 · +7.1%
- By 2040
- 3,619,611 · +21.5%
- By 2050
- 4,026,915 · +35.1%
- By 2075
- 4,957,073 · +66.4%
- By 2100
- 5,508,725 · +84.9%
Race, ethnicity, and origin ACS 2023
- Neighborhood character
- Diverse neighborhood (Simpson 0.55)
- Race & ethnicity
- Hispanic / Latino 59% Black 31% Two or more races 17% White 7% Native American 2%
- Hispanic origin (detail)
- Mexican 53%
- Common ancestry
- Lithuanian 1% Swiss 1%
- Foreign-born
- 29% · Canada, China, Jamaica
- Languages at home
- 47% English-only · Spanish 51% French/Haitian/Cajun 1%
Political lean MEDSL · Dallas
- 2024 margin
- Strong D (+22.2) · D 60.2% · R 38.0% · Other 1.8%
- 2008→2024 swing
- +6.9pp toward D · 2008: 15.3pp · 2024: 22.2pp
- All cycles
- 2024: D+22.2 2020: D+31.6 2016: D+26.2 2012: D+15.4 2008: D+15.3
Not yet ingested
- Civics
- —
Market trends
- HPI YoY
- ▲ 86.64%
- Current HPI
- 358.9507
- Rent YoY
- ▼ -2.72%
- Metro
- Dallas-Fort Worth-Arlington, TX
- State GDP YoY
- ▲ 3.95%
- F500 in state
- 110
Industry mix (Fortune 500 HQ in TX)
| Industry | F500 HQs | Revenue |
|---|---|---|
| Energy | 16 | $1,198B |
|
||
| Technology | 5 | $198B |
|
||
| Engineering / Construction | 4 | $72B |
|
||
| Energy Services | 3 | $60B |
|
||
| Utilities | 3 | $41B |
|
||
| Healthcare | 2 | $330B |
|
||
Price history
1 event — show timeline
- 2026-05-19 Listed $599,900 NTREIS
Property tax history
+15.9%/yrLatest (2025): $8,248 · -22.4% YoY. Source: county tax records.
Cash-flow waterfall
monthlySold comps — $/sqft
last 12 mo · ≤1 miLoading sold comps…