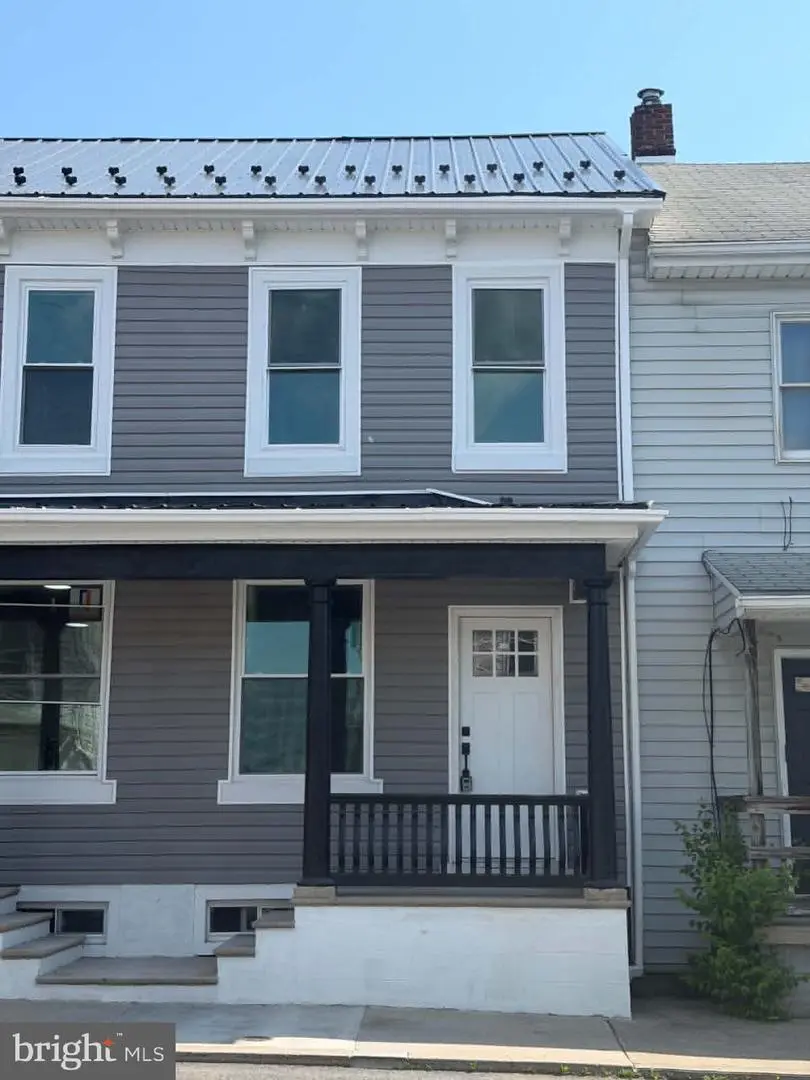
215 N Grand St · Lewistown, PA
Flood risk 1/10 · Minimal
- FEMA flood zone
- X (unshaded)
- Chance of flooding over 30 yrs
- 0.0%
- Est. flood insurance / yr
- $473 – $860
Fire risk 3/10 · Minor
- Est. fire insurance / yr
- $511 – $949
Heat risk 4/10 · Minor
- Hot days now (above 96°F)
- 7 days/yr
- Hot days in 30 yrs
- 17 days/yr
Wind risk 2/10 · Minimal
- Chance of severe wind over 30 yrs
- 0.0%
Air-quality risk 2/10 · Minimal
- Unhealthy air days now
- 0 days/yr
- Unhealthy air days in 30 yrs
- 1 days/yr
Risk factors via First Street. Map © Google.
Why this score? — see what drove the D grade
The composite is a weighted blend of 9 inputs, each scored 0–100. Each bar is that input's sub-score; the figure is the points it added to the 100-point composite (weight × sub-score).
- Cash flow +15.4/30.0
- ARV discount +7.5/15.0
- DSCR +4.7/10.0
- 1% rule +3.4/10.0
- Livability +3.3/5.0
- Schools +3.2/10.0
- Rent growth +2.5/5.0
- Condition / age +2.5/5.0
- Appreciation +0.0/10.0
$128,000
🖨 Deal sheet (PDF) 📄 Offer letter ✓ Due diligence
Listing remarks
Literally almost every inch of this home has been remodeled! Two-bedroom, 1.5 bath row home with a finished attic for the third bedroom/office. Main floor has laundry room. Kitchen appliances negotiable with acceptable offer. Flat rear yard with one car garage.
Key facts
- Garage
- Built 1940
- Listed 26 days
Property features AI
Exterior
- Parking: Detached garage (rear entry), 1-car
- Utilities: Public water; Public sewer; Electric power
- Home design: Interior townhouse/rowhouse; Fee simple ownership; Property in excellent condition; Effective remodel year 2025
- Construction: Brick and vinyl siding exterior; Brick/mortar foundation; Metal roof; Above grade and below grade structures; Year built information from assessor
- Exterior features: Porch(es); No tidal water
Interior
- Bedrooms: Two bedrooms on the first upper level; One bedroom on the second upper level
- Bathrooms: One full bathroom (upper levels); One full bathroom on first upper level; One half bathroom on main level
- Heating & cooling: Electric baseboard heating; Electric hot water
- Interior features: Walk-in shower; Combination dining and living area; Drywall walls and ceilings; Daylight, partial basement
- Laundry & utility: Main floor laundry hookups
Neighborhood map
What this means for you Summary
Snapshot
- This is a 2-bed/1.0-bath townhouse listed at $128k.
Deal economics
- At list price, monthly cash flow is $50 ($595/yr) — positive.
- The deal already cash-flows at list — no discount required.
- To meet the 1% rule (rent ≥ 1% of price), the offer needs to be $108k (15.5% below list).
- Recommended offer: $108k (15.5% below list) — sets the bar for 1% rule.
- Cap rate 6.8% vs local median 5.0% in Lewistown — top-decile yield for the area; either an underpriced asset or a hidden risk that comps aren't pricing in. Stress-test before assuming the spread holds.
Location & tenants
- Location reads 66/100 on livability (#1,057 in PA) — a middle-class / working-renter tenant base. Strengths: cost of living A+, housing A+, health & safety A+; Watch: amenities D+, commute F, employment F.
- Mifflin County SD (town): math 28% / reading 49% proficiency, ranked #380 of 539 in PA (top 70%) — families likely to look elsewhere, expect single-tenant / working-renter base with shorter leases.
- Zoned schools: Lewistown El Sch (math 17% / reading 27%, grade F, #1,221 of 1,518 statewide, top 81%, 486 students, 100% FRL); Mifflin Co Ms (math 16% / reading 51%, grade F, #342 of 512 statewide, top 67%, 689 students, 59% FRL); Mifflin Co Hs (math 76% / reading 24%, grade D+, #133 of 437 statewide, top 30%, 1,086 students, 34% FRL) — zoned schools average 64% FRL vs 44% district-wide (21 pts higher); higher-poverty schools than district average — tighter screening recommended.
- Market conditions: 73 active listings in the ZIP; 58 units permitted in Mifflin County in 2024 (0 in 5+ unit buildings).
Forward outlook
- Local home prices are declining (-3.0%/yr); year-one equity from $885 of loan paydown is wiped out by about $4k of value loss. Plan a longer hold.
- Mifflin County population projected at -18% by 2050 — secular population decline; favor cash flow + early exit over multi-decade hold.
Negotiation context
- It's been on market 26 days — a 2% lower offer ($126k) is reasonable based on typical stale-listing flexibility.
- Current owner paid $12k; list at $128k implies a 945% gain — meaningful room to come down on a strong offer.
Risks & watch-outs
- Watch-outs: built in 1940 — expect roof / HVAC / electrical / plumbing capex.
Questions for the listing agent
- Built in 1940 — when were the roof, HVAC, electrical panel, plumbing, and water heater last replaced?
- Is there a deadline driving the sale (1031 exchange, divorce, estate, relocation)? That informs how much negotiation room exists.
- The area grade is low — what's the realistic commute time and amenity access for the typical tenant pool here? Any planned neighborhood developments (good or bad) we should know about?
- What's the average days-on-market for RENTAL listings here right now (not sales)? A rising rental-DOM trend means longer vacancies and softer asking-rent achievability than the comps imply.
- What's the recent tenant-quality profile in this submarket — average credit score on applications, eviction rate, late-payment / NSF rate, and stable-employment percentage? A property-management company in the area should have these aggregated.
- How much new for-sale + rental construction is in the pipeline within 1–3 miles? Heavy new supply typically softens prices + rents 12–24 months out; constrained supply supports both.
Investment metrics
- 1% rule
- 0.84% ✗
- Cap rate
- 6.76%
- Cash-on-cash
- 1.66%
- DSCR
- 1.07
- GRM
- 9.9
CMA / ARV
- ARV (on-the-fly)
- $74,898
- Comps found
- 8
Show comp detail 8 sales within ~0.75 mi
| Address | Dist | Beds/Ba | Sqft | Sold | Price | $/sf | Match |
|---|---|---|---|---|---|---|---|
| 141 Third St W | 0.12mi | 2/1.0 | 960 (-6%) | 12mo | $70,000 | $73 | 74 |
| 16 W Hale St | 0.52mi | 2/1.0 | 1,073 (+5%) | 3mo | $160,000 | $149 | 66 |
| 16 Woods Ln | 0.20mi | 3/1.0 (+1) | 988 (-4%) | 18mo | $53,000 | $54 | 65 |
| 313 S Main St | 0.61mi | 2/1.5 | 1,028 (+0%) | 7mo | $54,000 | $53 | 64 |
| 187 W Fourth St | 0.18mi | 3/1.0 (+1) | 960 (-6%) | 16mo | $67,500 | $70 | 63 |
| 236 E 4th St | 0.49mi | 2/1.0 | 1,092 (+6%) | 16mo | $79,400 | $73 | 53 |
| 321 S Main St | 0.62mi | 2/1.5 | 1,058 (+3%) | 16mo | $70,000 | $66 | 50 |
| 207 South Spruce St | 0.74mi | 3/1.5 (+1) | 1,080 (+5%) | 7mo | $89,900 | $83 | 44 |
Match score weights: distance 35% · size 25% · config 20% · recency 20%. Top-matched comps best support the ARV.
Projected returns pro-forma
-3.0% appreciation · 3.0% rent growth · sell at horizon
- IRR
- -13.7%
- Equity multiple
- 0.51×
- Total profit
- $-17,617
- Equity at exit
- $19,085
- IRR
- -4.9%
- Equity multiple
- 0.68×
- Total profit
- $-11,409
- Equity at exit
- $11,067
Cash invested: $35,840 (down + closing). Projections, not guarantees.
Landlord ↔ Tenant lean methodology
- Overall (STATE)
- 62 Landlord-Friendly
- State Pennsylvania
- 62 Landlord-Friendly · EVEN
- County
- — inherits STATE
- City
- — inherits STATE
ZIP-level market 17044
- Home prices YoY
- -6.7%
- Active inventory
- 73
- Price-to-rent
- 9.9×
Monthly cashflow live
- Estimated rent
- $1,081 medium interval (Pro) →
- Mortgage (P&I)
- −$671
- Tax from tax record
- −$80 /mo · $959/yr
- Insurance
- −$53
- HOA
- −$0
- Vacancy / Maint / Mgmt
- −$227
- Net cashflow
- $50
Break-even live
Sensitivity live
| Price | -10% $122 | -5% $86 | +0% $50 | +5% $13 | +10% $-23 |
|---|---|---|---|---|---|
| Rent | -10% $-36 | -5% $7 | +0% $50 | +5% $92 | +10% $135 |
| Rate | -1.0pp $114 | -0.5pp $82 | base $50 | +0.5pp $16 | +1.0pp $-17 |
UW: 25.0% down · 7.5% · 30yr · 1.5% tax · 5.0% vac · 8.0% maint · 8.0% mgmt
Financing live
Cash to close
- Down payment
- $32,000
- Closing costs
- $3,840
- Reserves months
- —
- Total cash needed
- —
Loan-product check · same deal, 3 products live
Conventional
25% down · 7.5% · 30yr
- Down + closing
- —
- Monthly P&I
- —
- Monthly cashflow
- —
- DSCR
- —
- Eligible?
- —
Personal DTI + credit; lowest rate.
DSCR
20% down · 8.5% · 30yr
- Down + closing
- —
- Monthly P&I
- —
- Monthly cashflow
- —
- DSCR
- —
- Eligible?
- —
No personal income docs; deal must DSCR.
Hard money
10% down · 12.0% · 12mo
- Down + closing
- —
- Monthly P&I
- —
- Monthly cashflow
- —
- DSCR
- —
- Eligible?
- —
Short-term bridge; refi at stabilization.
Listing history 20 events
-
2026-06-21days on market $128,000 Active 26 DOM
-
2026-06-21days on market $128,000 Active 25 DOM
-
2026-06-18days on market $128,000 Active 23 DOM
-
2026-06-17days on market $128,000 Active 22 DOM
-
2026-06-16days on market $128,000 Active 21 DOM
-
2026-06-15days on market $128,000 Active 20 DOM
-
2026-06-13days on market $128,000 Active 18 DOM
-
2026-06-12days on market $128,000 Active 17 DOM
-
2026-06-09days on market $128,000 Active 14 DOM
-
2026-06-08days on market $128,000 Active 13 DOM
-
2026-06-08days on market $128,000 Active 12 DOM
-
2026-06-07days on market $128,000 Active 11 DOM
-
2026-06-04days on market $128,000 Active 8 DOM
-
2026-06-03price $128,000 Active 7 DOM
-
2026-06-02days on market $135,000 Active 7 DOM
-
2026-06-01days on market $135,000 Active 6 DOM
-
2026-05-31days on market $135,000 Active 5 DOM
-
2026-05-26$135,000 Active
-
2024-05-20soldstatus $12,250
-
2023-04-21soldstatus $7,350
ⓘ Source: listings_history table (triggers on properties + properties_extension) + one-shot
backfill from property_details.listing_events for pre-trigger history.
Tax reassessment forecast PA · Partial reset (capped growth)
- Current annual tax
- $959 · $80/mo
- Projected year-2 tax
- $1,491 · $124/mo
- Expected delta
- +$532/yr (+$44/mo · 55.4%)
ⓘ Screening estimate from a state-policy table — verify with the county assessor before closing.
Climate risk First Street
- Flood 1/10 Low FEMA zone X (unshaded) · 0% chance over 30 yrs
- Wildfire 3/10 Moderate
- Heat 4/10 Moderate 7 d/yr ≥96°F today · 17 d/yr by 30 yrs out
- Wind 2/10 Low 0% chance of damaging wind over 30 yrs
- Air quality 2/10 Low 0 unhealthy d/yr today · 1 by 30 yrs out
Nearby sold comps map
Loading sold comps map…
Walkable amenities ~0.75 mi
Loading nearby amenities…
Taxation est. · year 1
- Rental income
- $12,973
- − Mortgage interest
- −$7,170
- − Property taxes
- −$959
- − Insurance
- −$640
- − Repairs & maintenance
- −$1,038
- − Management
- −$1,038
- − Depreciation
- −$3,724
- Taxable loss
- −$1,595
- Est. tax savings @ 24.0%
- +$383
- After-tax cash flow
- $978/yr
For passive investors: Depreciation is non-cash, so a rental often shows a tax loss while cash-flowing — sheltering income. Rental losses are passive: they offset passive income freely, and up to $25,000/yr can offset ordinary (W-2) income if you actively participate and your MAGI is under $100k (phasing out to $0 by $150k); unused losses carry forward. On sale, claimed depreciation is recaptured at up to 25%, and gains may owe capital-gains tax (a 1031 exchange can defer both). Figures are a year-1 estimate at your 24.0% rate — not tax advice; consult a CPA.
Schools (NCES district)
- District
- Mifflin County SD
- NCES district ID
- 4215290
- Math proficiency
- 28% ▼ -7.00%
- Reading proficiency
- 49% ▼ -9.00%
- Median HH income
- $40,718
- Composite
- 32.28/100
- National rank
- #5755
- State rank
- #380 of 539 in PA
Livability — Lewistown
- Score
- 66/100
- State rank
- #1057
- US rank
- #11920
Category grades
Schools grade is shown separately in the Schools card above.
Census & demographics
- Census place
- Lewistown, PA
- Population (ZIP)
- 20,526
Population outlook (Mifflin County) Hauer SSP2
- Today (2025)
- 44,611 people
- By 2030
- 43,212 · -3.1%
- By 2040
- 40,197 · -9.9%
- By 2050
- 36,813 · -17.5%
- By 2075
- 28,833 · -35.4%
- By 2100
- 20,296 · -54.5%
Race, ethnicity, and origin ACS 2023
- Neighborhood character
- Predominantly White (92%)
- Race & ethnicity
- White 92% Two or more races 6% Hispanic / Latino 3%
- Common ancestry
- Romanian 2% Polish 2% Serbian 1%
- Foreign-born
- 1%
- Languages at home
- 97% English-only · Spanish 1% German/W. Germanic 1%
Political lean MEDSL · Mifflin
- 2024 margin
- Solid R (+56.4) · D 21.4% · R 77.9%
- 2008→2024 swing
- -22.8pp toward R · 2008: -33.7pp · 2024: -56.4pp
- All cycles
- 2024: R+56.4 2020: R+56.1 2016: R+57.5 2012: R+46.8 2008: R+33.7
Not yet ingested
- Civics
- —
Market trends
- HPI YoY
- ▼ -15.27%
- Current HPI
- 214.2729
- Rent YoY
- —
- Metro
- —
- State GDP YoY
- ▲ 1.68%
- F500 in state
- 34
Industry mix (Fortune 500 HQ in PA)
| Industry | F500 HQs | Revenue |
|---|---|---|
| Healthcare | 2 | $309B |
|
||
| Insurance | 2 | $27B |
|
||
| Telecommunications / Media | 1 | $124B |
|
||
| Industrial Distribution | 1 | $22B |
|
||
| Financial Services | 1 | $20B |
|
||
| Chemicals / Materials | 1 | $18B |
|
||
Price history
+1736.7% since first listed3 events — show timeline
- 2026-05-26 Listed $135,000 BRIGHT MLS
- 2024-05-20 Sold (Public Records) $12,250 Public Records
- 2023-04-21 Sold (Public Records) $7,350 Public Records
Property tax history
+0.8%/yrLatest (2026): $959 · +2.8% YoY. Source: county tax records.
Cash-flow waterfall
monthlySold comps — $/sqft
last 12 mo · ≤1 miLoading sold comps…