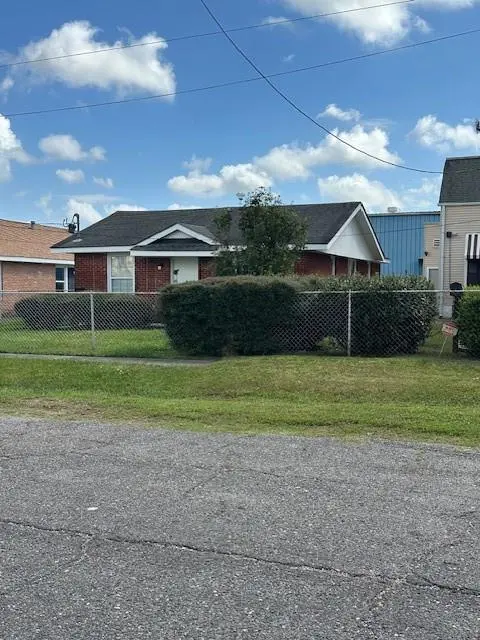
507 Fats Domino Ave · New Orleans, LA
Flood risk 8/10 · Major
- FEMA flood zone
- X (shaded)
- Chance of flooding over 30 yrs
- 0.6%
- Est. flood insurance / yr
- $507 – $1,088
Fire risk 1/10 · Minimal
- Est. fire insurance / yr
- $1,269 – $2,357
Heat risk 10/10 · Severe
- Hot days now (above 108°F)
- 7 days/yr
- Hot days in 30 yrs
- 21 days/yr
Wind risk 10/10 · Severe
- Chance of severe wind over 30 yrs
- 99.0%
Air-quality risk 3/10 · Minor
- Unhealthy air days now
- 3 days/yr
- Unhealthy air days in 30 yrs
- 3 days/yr
Risk factors via First Street. Map © Google.
Why this score? — see what drove the C grade
The composite is a weighted blend of 9 inputs, each scored 0–100. Each bar is that input's sub-score; the figure is the points it added to the 100-point composite (weight × sub-score).
- Cash flow +18.6/30.0
- ARV discount +15.0/15.0
- DSCR +5.9/10.0
- 1% rule +4.5/10.0
- Livability +4.0/5.0
- Rent growth +3.1/5.0
- Condition / age +2.5/5.0
- Schools +1.6/10.0
- Appreciation +0.0/10.0
$159,000
🖨 Deal sheet (PDF) 📄 Offer letter ✓ Due diligence
Listing remarks MLS
507 Fats Domino Avenue | New Orleans, LA---Welcome to this 9th Ward jewel, perfectly positioned on a quiet street and full of potential! This all-brick home, off-street parking, fully fenced yard, and a large patio— The home is move-in ready, yet offers the perfect opportunity for updates to truly make it your own and elevate it to perfection. Whether you're a first-time buyer, investor, or downsizing, this property delivers both value and versatility--solid construction, outdoor living space, and quiet neighborhood setting. All of this at an incredible value of $159,000—don’t miss your chance to own a piece of New Orleans charm.
Key facts
- Large patio
- Off-street parking
- Fully fenced yard
Tags
Neighborhood map
What this means for you Summary
Snapshot
- This is a 2-bed/1.0-bath single-family listed at $159k.
Deal economics
- At list price, monthly cash flow is $88 ($1k/yr) — positive.
- The deal already cash-flows at list — no discount required.
- To meet the 1% rule (rent ≥ 1% of price), the offer needs to be $151k (5.2% below list).
- Recommended offer: $149k (6.0% below list) — sets the bar for market timing.
- Cap rate 7.5% vs local median 4.4% in New Orleans — top-decile yield for the area; either an underpriced asset or a hidden risk that comps aren't pricing in. Stress-test before assuming the spread holds.
Location & tenants
- Location reads 81/100 on livability (#3 in LA, #1,383 nationally) — a professional / high-income tenant draw. Strengths: amenities A+, commute A+, health & safety A+; Watch: crime C-, employment D.
- Orleans Parish (urban): math 11% / reading 27% proficiency, ranked #69 of 98 in LA (top 70%) — low school quality limits family demand, transient renter base, plan for 1-2y turnover; 68% free/reduced lunch — lower-income household profile, screen leases tightly.
- Zoned schools: Benjamin Franklin Elem. Math And Science (math 12% / reading 23%, grade F, #479 of 646 statewide, top 75%, 747 students, 98% FRL, charter) — zoned schools average 98% FRL vs 68% district-wide (30 pts higher); higher-poverty schools than district average — tighter screening recommended.
- Market conditions: Rents rising (+2.5%/yr); 587 active listings in the ZIP; 40 comparable units currently listed for rent nearby; rentals at typical pace (median 23d on market — plan ~3-4 weeks tenant-placement turnaround); 710 units permitted in Orleans Parish in 2024 (244 in 5+ unit buildings).
- This rent runs 40% of the median local income ($46k/yr) — at the standard rent-burdened threshold; future hikes will face affordability resistance.
Forward outlook
- Local home prices are declining (-3.0%/yr); year-one equity from $1k of loan paydown is wiped out by about $5k of value loss. Plan a longer hold.
- Orleans County population projected at +61% by 2050 — long-run rental-demand tailwind backs the buy-and-hold thesis.
Negotiation context
- It's been on market 82 days — a 6% lower offer ($149k) is reasonable based on typical stale-listing flexibility.
- 2 sale attempts with the ask held roughly flat each time — persistent listings suggest the price (not the market) is what's stuck; bring a comps-based counter.
- Current owner paid $55k; list at $159k implies a 189% gain — meaningful room to come down on a strong offer.
Risks & watch-outs
- Watch-outs: flood insurance adds $66/mo.
- Climate carrying-cost: severe flood risk; severe wind risk, 99% chance of damaging wind over 30y; extreme-heat days projected 7→21/yr by 2055 (HVAC capex compounding) — expect insurance premiums to compound above CPI over the hold.
Questions for the listing agent
- It's been on market 82 days. Have you received any prior offers? Is the seller open to a 6% concession, seller financing, or rate buy-down credit?
- Built in 1960 — when were the roof, HVAC, electrical panel, plumbing, and water heater last replaced?
- What's the actual annual flood-insurance premium (NFIP or private), and is the property in a SFHA with mandatory coverage?
- Why hasn't it sold? Are there any deal-killer items the seller is aware of (foundation, flood, title, zoning, code violations)?
- Is there a deadline driving the sale (1031 exchange, divorce, estate, relocation)? That informs how much negotiation room exists.
- What's the average days-on-market for RENTAL listings here right now (not sales)? A rising rental-DOM trend means longer vacancies and softer asking-rent achievability than the comps imply.
- What's the recent tenant-quality profile in this submarket — average credit score on applications, eviction rate, late-payment / NSF rate, and stable-employment percentage? A property-management company in the area should have these aggregated.
- How much new for-sale + rental construction is in the pipeline within 1–3 miles? Heavy new supply typically softens prices + rents 12–24 months out; constrained supply supports both.
Investment metrics
- 1% rule
- 0.95% ✗
- Cap rate
- 7.46%
- Cash-on-cash
- 4.17%
- DSCR
- 1.19
- GRM
- 8.8
CMA / ARV
- ARV (median comp)
- $221,754
- List price
- $159,000
- Delta
- -28.30%
- Verdict
- UNDERPRICED
- Comps
- 20 within 1.0 mi
Show comp detail 9 sales within ~0.75 mi
| Address | Dist | Beds/Ba | Sqft | Sold | Price | $/sf | Match |
|---|---|---|---|---|---|---|---|
| 5220 Chartres St | 0.28mi | 3/1.0 (+1) | 1,130 (+10%) | 0mo | $199,000 | $176 | 64 |
| 6039 Dauphine St | 0.31mi | 2/1.5 | 1,024 (-0%) | 23mo | $177,000 | $173 | 64 |
| 5721 Burgundy St | 0.28mi | 2/2.0 | 1,051 (+2%) | 22mo | $225,000 | $214 | 61 |
| 622 Lizardi St | 0.33mi | 3/1.0 (+1) | 926 (-10%) | 10mo | $140,000 | $151 | 55 |
| 723 Andry St | 0.23mi | 3/2.0 (+1) | 1,154 (+12%) | 15mo | $62,500 | $54 | 47 |
| 1426 Tupelo St | 0.71mi | 3/2.0 (+1) | 1,104 (+8%) | 4mo | $100,000 | $91 | 42 |
| 5412 Marais St | 0.48mi | 3/1.0 (+1) | 900 (-12%) | 14mo | $131,500 | $146 | 40 |
| 1000 Lizardi St | 0.46mi | 2/2.0 | 1,160 (+13%) | 23mo | $225,000 | $194 | 34 |
| 1301 Lamanche St | 0.56mi | 3/2.0 (+1) | 1,178 (+15%) | 14mo | $60,000 | $51 | 29 |
Match score weights: distance 35% · size 25% · config 20% · recency 20%. Top-matched comps best support the ARV.
Projected returns pro-forma
-3.0% appreciation · 2.49% rent growth · sell at horizon
- IRR
- -13.1%
- Equity multiple
- 0.53×
- Total profit
- $-20,878
- Equity at exit
- $23,707
- IRR
- -4.9%
- Equity multiple
- 0.69×
- Total profit
- $-13,953
- Equity at exit
- $13,747
Cash invested: $44,520 (down + closing). Projections, not guarantees.
Landlord ↔ Tenant lean methodology
- Overall (STATE)
- 90 Strongly Landlord-Friendly
- State Louisiana
- 90 Strongly Landlord-Friendly · R+12
- County
- — inherits STATE
- City
- — inherits STATE
ZIP-level market 70117
- Rents YoY
- 2.5%
- Active inventory
- 587
- Price-to-rent
- 8.8×
Monthly cashflow live
- Estimated rent
- $1,508 high interval (Pro) →
- Mortgage (P&I)
- −$834
- Tax from tax record
- −$136 /mo · $1,636/yr
- Insurance
- −$66
- Flood insurance flood zone
- −$66 /mo · $798/yr
- HOA
- −$0
- Vacancy / Maint / Mgmt
- −$317
- Net cashflow
- $88
Break-even live
Sensitivity live
| Price | -10% $178 | -5% $133 | +0% $88 | +5% $43 | +10% $-2 |
|---|---|---|---|---|---|
| Rent | -10% $-31 | -5% $29 | +0% $88 | +5% $148 | +10% $208 |
| Rate | -1.0pp $168 | -0.5pp $129 | base $88 | +0.5pp $47 | +1.0pp $5 |
UW: 25.0% down · 7.5% · 30yr · 1.5% tax · 5.0% vac · 8.0% maint · 8.0% mgmt
Financing live
Cash to close
- Down payment
- $39,750
- Closing costs
- $4,770
- Reserves months
- —
- Total cash needed
- —
Loan-product check · same deal, 3 products live
Conventional
25% down · 7.5% · 30yr
- Down + closing
- —
- Monthly P&I
- —
- Monthly cashflow
- —
- DSCR
- —
- Eligible?
- —
Personal DTI + credit; lowest rate.
DSCR
20% down · 8.5% · 30yr
- Down + closing
- —
- Monthly P&I
- —
- Monthly cashflow
- —
- DSCR
- —
- Eligible?
- —
No personal income docs; deal must DSCR.
Hard money
10% down · 12.0% · 12mo
- Down + closing
- —
- Monthly P&I
- —
- Monthly cashflow
- —
- DSCR
- —
- Eligible?
- —
Short-term bridge; refi at stabilization.
Rent comps 40 comps
| Address | Beds | Baths | Sqft | Rent | $/sqft | DOM | Units | Dist |
|---|---|---|---|---|---|---|---|---|
| 5434 Chartres St New Orleans, LA | 2.0 | 1.0 | 800 | $1,150 | $1.44 | 25d | 1 | 0.17mi |
| 6019 Royal St New Orleans, LA | 2.0 | 1.0 | 790 | $1,200 | $1.52 | 25d | 1 | 0.23mi |
| 5450 Burgundy St New Orleans, LA | 2.0 | 1.0 | 1474 | $1,250 | $0.85 | 25d | 1 | 0.29mi |
| 906 Flood St New Orleans, LA | 3.0 | 3.0 | 1174 | $1,700 | $1.45 | 3d | 1 | 0.31mi |
| 6038 N Rampart St New Orleans, LA | 3.0 | 2.0 | 1080 | $1,795 | $1.66 | 25d | 1 | 0.39mi |
| 617 Forstall St New Orleans, LA | 3.0 | 2.0 | 1262 | $2,200 | $1.74 | 4d | 1 | 0.39mi |
| 18 Saint Claude Ct New Orleans, LA | 3.0 | 1.0 | 864 | $1,200 | $1.39 | 13d | 1 | 0.41mi |
| 716 Delery St Unit 716 New Orleans, LA | 2.0 | 1.0 | 900 | $1,200 | $1.33 | 25d | 1 | 0.42mi |
| 6002 Saint Claude Ave New Orleans, LA | 2.0 | 2.0 | 965 | $1,275 | $1.32 | 22d | 1 | 0.45mi |
| 619 Reynes St New Orleans, LA | 3.0 | 2.0 | 1318 | $2,100 | $1.59 | 17d | 1 | 0.45mi |
| 5805 Saint Claude Ave New Orleans, LA | 2.0 | 1.0 | 800 | $1,200 | $1.50 | 25d | 1 | 0.46mi |
| 816 Forstall St New Orleans, LA | 3.0 | 1.0 | 850 | $1,600 | $1.88 | 25d | 1 | 0.47mi |
| 5109 Burgundy St New Orleans, LA | 2.0 | 1.0 | 1122 | $1,474 | $1.31 | 18d | 1 | 0.47mi |
| 920 Forstall St New Orleans, LA | 2.0 | 1.0 | 800 | $1,600 | $2.00 | 25d | 1 | 0.51mi |
| 918 Forstall St New Orleans, LA | 2.0 | 1.0 | 800 | $2,290 | $2.86 | 25d | 1 | 0.51mi |
| 1201 Gordon St New Orleans, LA | 3.0 | 2.5 | 1367 | $1,900 | $1.39 | 18d | 1 | 0.54mi |
| 6530 Royal St Arabi, LA | 2.0 | 2.0 | 860 | $1,550 | $1.80 | 45d | 1 | 0.54mi |
| 4950 Dauphine St New Orleans, LA | 1.0 | 1.0 | 612 | $1,750 | $2.86 | 12d | 16 | 0.54mi |
| 1301 Lamanche St New Orleans, LA | 3.0 | 2.0 | 1178 | $1,600 | $1.36 | 25d | 1 | 0.58mi |
| 1301 Lamanche St New Orleans, LA | 3.0 | 2.0 | 1090 | $1,600 | $1.47 | 4d | 1 | 0.58mi |
| 1301 Lamanche St New Orleans, LA | 3.0 | 2.0 | 1090 | $1,600 | $1.47 | 4d | 1 | 0.58mi |
| 6608 Dauphine St Arabi, LA | 2.0 | 1.0 | 989 | $1,395 | $1.41 | 12d | 1 | 0.60mi |
| 6608 Dauphine St Unit 6608 Arabi, LA | 2.0 | 1.0 | 989 | $1,325 | $1.34 | 4d | 1 | 0.60mi |
| 1327 Fats Domino Ave Unit A New Orleans, LA | 3.0 | 2.0 | 1200 | $1,900 | $1.58 | 4d | 1 | 0.63mi |
| 4801 Dauphine St Unit B New Orleans, LA | 2.0 | 1.0 | 875 | $1,100 | $1.26 | 25d | 1 | 0.65mi |
| 1015 Government St Unit 11 Arabi, LA | 2.0 | 1.0 | 720 | $999 | $1.39 | 45d | 1 | 0.66mi |
| 4826 N Rampart St Unit 4826 New Orleans, LA | 2.0 | 1.0 | 850 | $1,200 | $1.41 | 25d | 1 | 0.66mi |
| 1334 Tricou St New Orleans, LA | 2.0 | 1.0 | 1117 | $1,500 | $1.34 | 22d | 1 | 0.71mi |
| 1422 Andry St New Orleans, LA | 3.0 | 2.0 | 1100 | $1,400 | $1.27 | 4d | 1 | 0.71mi |
| 1137 Deslonde St New Orleans, LA | 2.0 | 1.0 | 1017 | $1,500 | $1.47 | 25d | 1 | 0.73mi |
| 1449 Andry St New Orleans, LA | 2.0 | 1.0 | 833 | $1,300 | $1.56 | 25d | 1 | 0.73mi |
| 438 Friscoville Ave Arabi, LA | 3.0 | 2.0 | 1500 | $3,200 | $2.13 | 4d | 1 | 0.78mi |
| 1420 Delery St New Orleans, LA | 2.0 | 1.0 | 900 | $1,250 | $1.39 | 13d | 1 | 0.79mi |
| 616 Lebeau St Unit A Arabi, LA | 2.0 | 1.0 | 1205 | $1,650 | $1.37 | 45d | 1 | 0.85mi |
| 1333 Angela Ave Arabi, LA | 3.0 | 2.0 | 1090 | $1,850 | $1.70 | 4d | 1 | 0.85mi |
| 5900 N Derbigny St Unit 1 New Orleans, LA | 3.0 | 2.0 | 1000 | $1,950 | $1.95 | 4d | 1 | 0.86mi |
| 1304 Jourdan Ave New Orleans, LA | 2.0 | 2.0 | 890 | $959 | $1.08 | 17d | 6 | 0.87mi |
| 1200 Southlawn Blvd New Orleans, LA | 3.0 | 2.0 | 950 | $1,725 | $1.82 | 25d | 1 | 0.90mi |
| 1227 Flanders St New Orleans, LA | 2.0 | 1.0 | 900 | $1,000 | $1.11 | 25d | 1 | 0.92mi |
| 713 Community St Arabi, LA | 2.0 | 1.0 | 850 | $1,200 | $1.41 | 4d | 1 | 0.94mi |
Listing history 18 events
-
2026-06-21days on market $159,000 Active 82 DOM
-
2026-06-18days on market $159,000 Active 79 DOM
-
2026-06-17days on market $159,000 Active 78 DOM
-
2026-06-16days on market $159,000 Active 77 DOM
-
2026-06-15days on market $159,000 Active 76 DOM
-
2026-06-13days on market $159,000 Active 74 DOM
-
2026-06-10days on market $159,000 Active 71 DOM
-
2026-06-09days on market $159,000 Active 70 DOM
-
2026-06-08days on market $159,000 Active 69 DOM
-
2026-06-07days on market $159,000 Active 68 DOM
-
2026-06-05days on market $159,000 Active 65 DOM
-
2026-06-03days on market $159,000 Active 64 DOM
-
2026-06-02days on market $159,000 Active 63 DOM
-
2026-06-01days on market $159,000 Active 62 DOM
-
2026-05-31days on market $159,000 Active 61 DOM
-
2026-03-31$159,000 Active 655-char remark
Show marketing remark (639 chars)
507 Fats Domino Avenue | New Orleans, LA---Welcome to this 9th Ward jewel, perfectly positioned on a quiet street and full of potential! This all-brick home, off-street parking, fully fenced yard, and a large patio-- The home is move-in ready, yet offers the perfect opportunity for updates to truly make it your own and elevate it to perfection. Whether you're a first-time buyer, investor, or downsizing, this property delivers both value and versatility--solid construction, outdoor living space, and quiet neighborhood setting. All of this at an incredible value of $159,000--don't miss your chance to own a piece of New Orleans charm.
-
2026-03-31$159,000 Active 639-char remark
Show marketing remark (639 chars)
507 Fats Domino Avenue | New Orleans, LA---Welcome to this 9th Ward jewel, perfectly positioned on a quiet street and full of potential! This all-brick home, off-street parking, fully fenced yard, and a large patio-- The home is move-in ready, yet offers the perfect opportunity for updates to truly make it your own and elevate it to perfection. Whether you're a first-time buyer, investor, or downsizing, this property delivers both value and versatility--solid construction, outdoor living space, and quiet neighborhood setting. All of this at an incredible value of $159,000--don't miss your chance to own a piece of New Orleans charm.
-
1985-08-21soldstatus $55,000
ⓘ Source: listings_history table (triggers on properties + properties_extension) + one-shot
backfill from property_details.listing_events for pre-trigger history.
Tax reassessment forecast LA · Resets to sale price
- Current annual tax
- $1,636 · $136/mo
- Projected year-2 tax
- $1,636 · $136/mo
- Expected delta
- $0/yr ($0/mo · 0.0%)
ⓘ Screening estimate from a state-policy table — verify with the county assessor before closing.
Climate risk First Street
- Flood 8/10 Severe FEMA zone X (shaded) · 60% chance over 30 yrs
- Wildfire 1/10 Low
- Heat 10/10 Extreme 7 d/yr ≥108°F today · 21 d/yr by 30 yrs out
- Wind 10/10 Extreme 99% chance of damaging wind over 30 yrs
- Air quality 3/10 Moderate 3 unhealthy d/yr today · 3 by 30 yrs out
Nearby sold comps map
Loading sold comps map…
Walkable amenities ~0.75 mi
Loading nearby amenities…
Taxation est. · year 1
- Rental income
- $18,096
- − Mortgage interest
- −$8,906
- − Property taxes
- −$1,636
- − Insurance
- −$1,592
- − Repairs & maintenance
- −$1,448
- − Management
- −$1,448
- − Depreciation
- −$4,625
- Taxable loss
- −$1,560
- Est. tax savings @ 24.0%
- +$374
- After-tax cash flow
- $1,436/yr
For passive investors: Depreciation is non-cash, so a rental often shows a tax loss while cash-flowing — sheltering income. Rental losses are passive: they offset passive income freely, and up to $25,000/yr can offset ordinary (W-2) income if you actively participate and your MAGI is under $100k (phasing out to $0 by $150k); unused losses carry forward. On sale, claimed depreciation is recaptured at up to 25%, and gains may owe capital-gains tax (a 1031 exchange can defer both). Figures are a year-1 estimate at your 24.0% rate — not tax advice; consult a CPA.
Schools (NCES district)
- District
- Orleans Parish
- NCES district ID
- 2201170
- Math proficiency
- 11% ▼ -52.00%
- Reading proficiency
- 27% ▼ -46.00%
- Median HH income
- $37,011
- Composite
- 15.78/100
- National rank
- #9271
- State rank
- #69 of 98 in LA
Livability — New Orleans
- Score
- 81/100
- State rank
- #3
- US rank
- #1383
Category grades
Schools grade is shown separately in the Schools card above.
Census & demographics
- Census place
- New Orleans, LA
- County
- Orleans Parish · 338,817 people
- City population
- 338,817
- Metro
- New Orleans-Metairie, LA
- Population (ZIP)
- 25,652
- Household income
- $45,764
- Rent vs Own
- Severe rent burden
- 1988.0
Population outlook (Orleans County) Hauer SSP2
- Today (2025)
- 513,025 people
- By 2030
- 575,781 · +12.2%
- By 2040
- 700,174 · +36.5%
- By 2050
- 826,541 · +61.1%
- By 2075
- 1,123,374 · +119.0%
- By 2100
- 1,355,609 · +164.2%
Race, ethnicity, and origin ACS 2023
- Neighborhood character
- Majority Black (60%)
- Race & ethnicity
- Black 60% White 30% Two or more races 6% Hispanic / Latino 5%
- Common ancestry
- Lithuanian 5% Italian 1% Romanian 1%
- Foreign-born
- 5% · Canada, South Korea
- Languages at home
- 93% English-only · Spanish 3% Other Indo-European 1% French/Haitian/Cajun 1%
Political lean MEDSL · Orleans
- 2024 margin
- Solid D (+67.0) · D 82.2% · R 15.2% · Other 2.7%
- 2008→2024 swing
- +6.7pp toward D · 2008: 60.3pp · 2024: 67.0pp
- All cycles
- 2024: D+67.0 2020: D+68.2 2016: D+66.2 2012: D+62.5 2008: D+60.3
Not yet ingested
- Civics
- —
Market trends
- HPI YoY
- ▼ -177.22%
- Current HPI
- 184.6061
- Rent YoY
- ▲ 2.49%
- Metro
- New Orleans-Metairie, LA
- State GDP YoY
- ▲ 3.29%
- F500 in state
- 10
Industry mix (Fortune 500 HQ in LA)
| Industry | F500 HQs | Revenue |
|---|---|---|
| Telecommunications | 2 | $23B |
|
||
| Utilities | 1 | $12B |
|
||
| Wholesale / Distribution | 1 | $5B |
|
||
| Advertising | 1 | $2B |
|
||
Price history
+189.1% since first listed3 events — show timeline
- 2026-03-31 Listed $159,000 AcadianaMLS
- 2026-03-31 Listed $159,000 GSREIN
- 1985-08-21 Sold (Public Records) $55,000 Public Records
Property tax history
+5.9%/yrLatest (2026): $1,636 · +1.1% YoY. Source: county tax records.
Cash-flow waterfall
monthlySold comps — $/sqft
last 12 mo · ≤1 miLoading sold comps…