1111 SE 3rd Ave #15 · Canby, OR
Flood risk 1/10 · Minimal
- FEMA flood zone
- X (unshaded)
- Chance of flooding over 30 yrs
- 0.0%
- Est. flood insurance / yr
- $507 – $1,088
Fire risk 4/10 · Minor
- Est. fire insurance / yr
- $498 – $926
Heat risk 3/10 · Minor
- Hot days now (above 92°F)
- 7 days/yr
- Hot days in 30 yrs
- 14 days/yr
Wind risk 1/10 · Minimal
- Chance of severe wind over 30 yrs
- —
Air-quality risk 10/10 · Severe
- Unhealthy air days now
- 16 days/yr
- Unhealthy air days in 30 yrs
- 18 days/yr
Risk factors via First Street. Map © Google.
Why this score? — see what drove the B- grade
The composite is a weighted blend of 9 inputs, each scored 0–100. Each bar is that input's sub-score; the figure is the points it added to the 100-point composite (weight × sub-score).
- Cash flow +30.0/30.0
- DSCR +10.0/10.0
- 1% rule +7.9/10.0
- ARV discount +7.5/15.0
- Livability +4.1/5.0
- Schools +3.6/10.0
- Rent growth +3.0/5.0
- Condition / age +2.5/5.0
- Appreciation +0.0/10.0
$158,000
🖨 Deal sheet 📄 Offer letter ✓ Due diligence
Listing remarks MLS
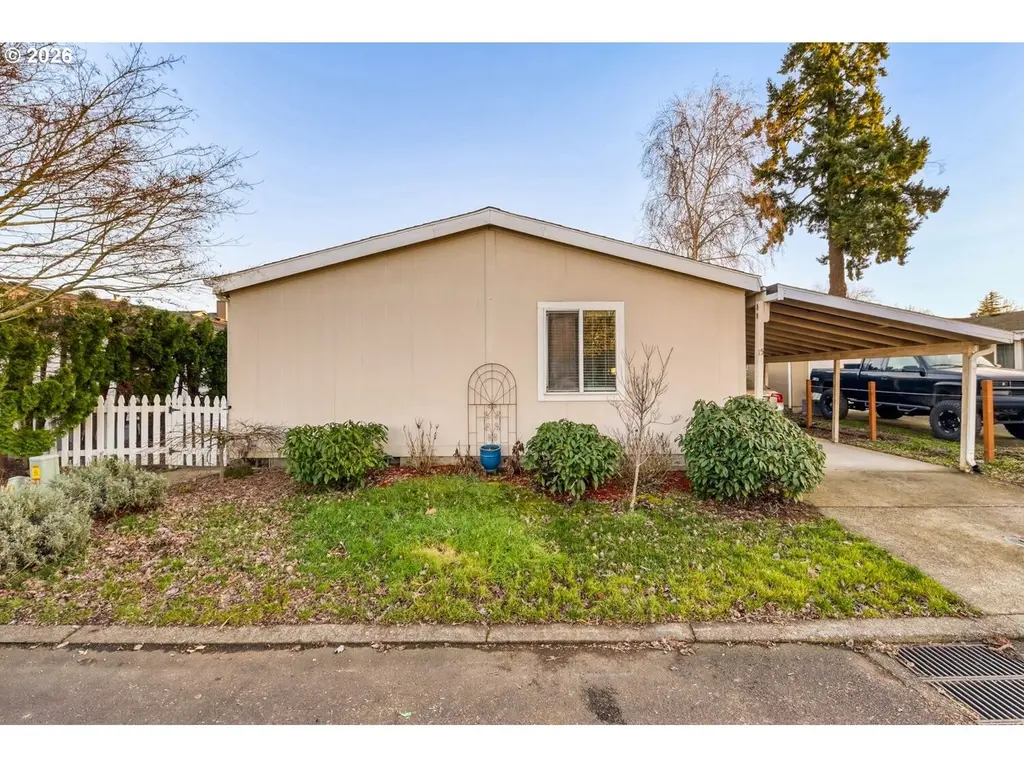
Pine Crossing is an all age manufactured home park in South East Canby with convenient access to 99E and all Canby has to offer. The manufactured home on lot 15 was built in 2006 and offers three bedrooms, two bathrooms, living room, dining and kitchen. The LVP flooring throughout the house brings continuity to the home. Primary suite is on one end of the home with the open living area in the center. The yard is fully fenced and also has a hot tub (needs to be serviced). At the end of the long carport, you will find an outside storage shed.
Key facts
- Hot tub
- Fully fenced yard
- Outside storage shed
Tags
Neighborhood map
What this means for you Summary
Snapshot
- This is a 3-bed/1.0-bath other listed at $158k.
Deal economics
- At list price, monthly cash flow is $652 ($8k/yr) — positive.
- The deal already cash-flows at list — no discount required.
- Meets the 1% rule at list price ($2k rent vs $158k).
- Recommended offer: $139k (12.0% below list) — sets the bar for market timing.
- Cap rate 11.2% vs local median 2.1% in Canby — top-decile yield for the area; either an underpriced asset or a hidden risk that comps aren't pricing in. Stress-test before assuming the spread holds.
Location & tenants
- Location reads 82/100 on livability (#43 in OR, #1,056 nationally) — a professional / high-income tenant draw. Strengths: commute A+, employment A+, housing A+; Watch: schools C-, cost of living D-.
- Canby SD 86 (town): math 36% / reading 45% proficiency, ranked #14 of 58 in OR (top 24%) — families likely to look elsewhere, expect single-tenant / working-renter base with shorter leases.
- Market conditions: Rents rising (+1.9%/yr); 166 active listings in the ZIP; 11 comparable units currently listed for rent nearby; rentals leasing fast (median 5d on market — plan ~1-2 weeks tenant-placement turnaround); solid renter incomes; 946 units permitted in Clackamas County in 2024 (188 in 5+ unit buildings).
Forward outlook
- Local home prices are declining (-3.0%/yr); year-one equity from $1k of loan paydown is wiped out by about $5k of value loss. Plan a longer hold.
- Clackamas County population projected at +25% by 2050 — long-run rental-demand tailwind backs the buy-and-hold thesis.
- At projected returns (-3.0% appreciation + 1.9% rent growth), your $44k cash investment doubles in ~8 years — after that, you're playing with house money.
Negotiation context
- It's been on market 126 days — a 12% lower offer ($139k) is reasonable based on typical stale-listing flexibility.
- 2 sale attempts with the ask held roughly flat each time — persistent listings suggest the price (not the market) is what's stuck; bring a comps-based counter.
Questions for the listing agent
- It's been on market 126 days. Have you received any prior offers? Is the seller open to a 12% concession, seller financing, or rate buy-down credit?
- Why hasn't it sold? Are there any deal-killer items the seller is aware of (foundation, flood, title, zoning, code violations)?
- Is there a deadline driving the sale (1031 exchange, divorce, estate, relocation)? That informs how much negotiation room exists.
- What's the average days-on-market for RENTAL listings here right now (not sales)? A rising rental-DOM trend means longer vacancies and softer asking-rent achievability than the comps imply.
- What's the recent tenant-quality profile in this submarket — average credit score on applications, eviction rate, late-payment / NSF rate, and stable-employment percentage? A property-management company in the area should have these aggregated.
- How much new for-sale + rental construction is in the pipeline within 1–3 miles? Heavy new supply typically softens prices + rents 12–24 months out; constrained supply supports both.
Investment metrics
- 1% rule
- 1.29% ✓
- Cap rate
- 11.25%
- Cash-on-cash
- 17.69%
- DSCR
- 1.79
- GRM
- 6.4
CMA / ARV
- ARV (median comp)
- $97,000
- List price
- $158,000
- Delta
- 62.89%
- Verdict
- OVERPRICED
- Comps
- 11 within 1.0 mi
Projected returns pro-forma
-3.0% appreciation · 1.89% rent growth · sell at horizon
- IRR
- 8.0%
- Equity multiple
- 1.31×
- Total profit
- $13,618
- Equity at exit
- $23,558
- IRR
- 16.3%
- Equity multiple
- 2.27×
- Total profit
- $56,075
- Equity at exit
- $13,661
Cash invested: $44,240 (down + closing). Projections, not guarantees.
Landlord ↔ Tenant lean methodology
- Overall (STATE)
- 28 Tenant-Leaning
- State Oregon
- 28 Tenant-Leaning · D+6
- County
- — inherits STATE
- City
- — inherits STATE
ZIP-level market 97013
- Rents YoY
- 1.9%
- Active inventory
- 166
- Price-to-rent
- 6.4×
Monthly cashflow live
- Estimated rent
- $2,044 high interval (Pro) →
- Mortgage (P&I)
- −$829
- Tax from tax record
- −$68 /mo · $819/yr
- Insurance
- −$66
- HOA
- −$0
- Vacancy / Maint / Mgmt
- −$429
- Net cashflow
- $652
Break-even live
UW: 25.0% down · 7.5% · 30yr · 1.5% tax · 5.0% vac · 8.0% maint · 8.0% mgmt
Financing live
Cash to close
- Down payment
- $39,500
- Closing costs
- $4,740
- Reserves months
- —
- Total cash needed
- —
Loan-product check · same deal, 3 products live
Conventional
25% down · 7.5% · 30yr
- Down + closing
- —
- Monthly P&I
- —
- Monthly cashflow
- —
- DSCR
- —
- Eligible?
- —
Personal DTI + credit; lowest rate.
DSCR
20% down · 8.5% · 30yr
- Down + closing
- —
- Monthly P&I
- —
- Monthly cashflow
- —
- DSCR
- —
- Eligible?
- —
No personal income docs; deal must DSCR.
Hard money
10% down · 12.0% · 12mo
- Down + closing
- —
- Monthly P&I
- —
- Monthly cashflow
- —
- DSCR
- —
- Eligible?
- —
Short-term bridge; refi at stabilization.
Rent comps 11 comps
| Address | Beds | Baths | Sqft | Rent | $/sqft | DOM | Units | Dist |
|---|---|---|---|---|---|---|---|---|
| 700 SE 5th Ave Canby, OR | 2.0–3.0 | 2.0 | 1066 | $1,840 | $1.73 | 2d | 2 | 0.13mi |
| 259 S Sequoia Pkwy Canby, OR | 1.0–3.0 | 1.0–2.0 | 1013 | $2,330 | $2.30 | 2d | 12 | 0.32mi |
| 575 N Pine St Unit 575 Canby, OR | 2.0 | 1.0 | 1100 | $1,550 | $1.41 | 4d | 1 | 0.39mi |
| 645 N Pine St Canby, OR | 2.0 | 1.0 | 1100 | $1,550 | $1.41 | 2d | 1 | 0.39mi |
| 625 N Pine St Unit 639 Canby, OR | 2.0 | 1.0 | 1100 | $1,550 | $1.41 | 43d | 1 | 0.41mi |
| 190 SE 3rd Ave Canby, OR | 3.0 | 2.0 | 1196 | $2,450 | $2.05 | 43d | 1 | 0.44mi |
| 499 SW 5th Ave Canby, OR | 3.0 | 1.0 | 942 | $2,195 | $2.33 | 44d | 1 | 0.76mi |
| 259 N Cedar St Canby, OR | 3.0 | 2.5 | 1453 | $2,399 | $1.65 | 7d | 1 | 1.00mi |
| 1802 N Pine St Canby, OR | 2.0 | 2.0 | 1002 | $1,499 | $1.50 | 4d | 1 | 1.05mi |
| 267 N Aspen St Canby, OR | 3.0 | 2.5 | 1252 | $2,100 | $1.68 | 20d | 1 | 1.10mi |
| 2040 N Redwood St Canby, OR | 1.0–2.0 | 1.0 | 910 | $1,599 | $1.76 | 1d | 2 | 1.20mi |
Listing history 15 events
-
2026-06-18days on market $158,000 Active 126 DOM
-
2026-06-17days on market $158,000 Active 125 DOM
-
2026-06-16days on market $158,000 Active 124 DOM
-
2026-06-15days on market $158,000 Active 123 DOM
-
2026-06-13days on market $158,000 Active 121 DOM
-
2026-06-09days on market $158,000 Active 117 DOM
-
2026-06-08days on market $158,000 Active 116 DOM
-
2026-06-07days on market $158,000 Active 115 DOM
-
2026-06-05days on market $158,000 Active 112 DOM
-
2026-06-03days on market $158,000 Active 111 DOM
-
2026-06-02days on market $158,000 Active 110 DOM
-
2026-06-01days on market $158,000 Active 109 DOM
-
2026-05-31days on market $158,000 Active 108 DOM
-
2026-03-03$163,000 Active 546-char remark
Show marketing remark (546 chars)
Pine Crossing is an all age manufactured home park in South East Canby with convenient access to 99E and all Canby has to offer. The manufactured home on lot 15 was built in 2006 and offers three bedrooms, two bathrooms, living room, dining and kitchen. The LVP flooring throughout the house brings continuity to the home. Primary suite is on one end of the home with the open living area in the center. The yard is fully fenced and also has a hot tub (needs to be serviced). At the end of the long carport, you will find an outside storage shed.
-
2026-02-12$163,000 Active 551-char remark
Show marketing remark (551 chars)
Pine Crossing is an all age manufactured home park in South East Canby with convenient access to 99E and all Canby has to offer. The manufactured home on lot 15 was built in 2006 and offers three bedrooms, two bathrooms, living room, dining and kitchen. The LVP flooring throughout the house brings continuity to the home. Primary suite is on one end of the home with the open living area in the center. The yard is fully fenced and also has a hot tub (needs to be serviced). At the end of the long carport, you will find an outside storage shed.
ⓘ Source: listings_history table (triggers on properties + properties_extension) + one-shot
backfill from property_details.listing_events for pre-trigger history.
Tax reassessment forecast OR · Resets to sale price
- Current annual tax
- $819 · $68/mo
- Projected year-2 tax
- $1,533 · $128/mo
- Expected delta
- +$714/yr (+$59/mo · 87.2%)
ⓘ Screening estimate from a state-policy table — verify with the county assessor before closing.
Climate risk First Street
- Flood 1/10 Low FEMA zone X (unshaded) · 0% chance over 30 yrs
- Wildfire 4/10 Moderate
- Heat 3/10 Moderate 7 d/yr ≥92°F today · 14 d/yr by 30 yrs out
- Wind 1/10 Low
- Air quality 10/10 Extreme 16 unhealthy d/yr today · 18 by 30 yrs out
Nearby sold comps map
Loading sold comps map…
Walkable amenities ~0.75 mi
Loading nearby amenities…
Taxation est. · year 1
- Rental income
- $24,526
- − Mortgage interest
- −$8,850
- − Property taxes
- −$819
- − Insurance
- −$790
- − Repairs & maintenance
- −$1,962
- − Management
- −$1,962
- − Depreciation
- −$4,596
- Taxable income
- $5,547
- Est. tax owed @ 24.0%
- −$1,331
- After-tax cash flow
- $6,493/yr
For passive investors: Depreciation is non-cash, so a rental often shows a tax loss while cash-flowing — sheltering income. Rental losses are passive: they offset passive income freely, and up to $25,000/yr can offset ordinary (W-2) income if you actively participate and your MAGI is under $100k (phasing out to $0 by $150k); unused losses carry forward. On sale, claimed depreciation is recaptured at up to 25%, and gains may owe capital-gains tax (a 1031 exchange can defer both). Figures are a year-1 estimate at your 24.0% rate — not tax advice; consult a CPA.
Schools (NCES district)
- District
- Canby SD 86
- NCES district ID
- 4102640
- Math proficiency
- 36% ▼ -4.00%
- Reading proficiency
- 45% ▼ -5.00%
- Median HH income
- $64,246
- Composite
- 36.24/100
- National rank
- #4717
- State rank
- #14 of 58 in OR
Livability — Canby
- Score
- 82/100
- State rank
- #43
- US rank
- #1056
Category grades
Schools grade is shown separately in the Schools card above.
Census & demographics
- Census place
- Canby, OR
- County
- Clackamas County · 361,406 people
- City population
- 24,293
- Metro
- Portland-Vancouver-Hillsboro, OR-WA
- Population (ZIP)
- 24,293
- Household income
- $101,832
- Rent vs Own
- Severe rent burden
- 575.0
Population outlook (Clackamas County) Hauer SSP2
- Today (2025)
- 458,456 people
- By 2030
- 485,185 · +5.8%
- By 2040
- 532,932 · +16.2%
- By 2050
- 574,445 · +25.3%
- By 2075
- 665,497 · +45.2%
- By 2100
- 697,488 · +52.1%
Race, ethnicity, and origin ACS 2023
- Neighborhood character
- Predominantly White (75%)
- Race & ethnicity
- White 75% Hispanic / Latino 18% Two or more races 8% Asian 2%
- Hispanic origin (detail)
- Mexican 17%
- Common ancestry
- Portuguese 4% Lithuanian 3% Italian 2%
- Foreign-born
- 9% · Canada, Vietnam
- Languages at home
- 83% English-only · Spanish 14% Russian/Polish/Slavic 1% Vietnamese 1%
Political lean MEDSL · Clackamas
- 2024 margin
- Lean D (+9.7) · D 53.4% · R 43.6% · Other 3.0%
- 2008→2024 swing
- -0.6pp no change · 2008: 10.4pp · 2024: 9.7pp
- All cycles
- 2024: D+9.7 2020: D+11.1 2016: D+6.1 2012: D+3.5 2008: D+10.4
Not yet ingested
- Civics
- —
Market trends
- HPI YoY
- ▼ -427.87%
- Current HPI
- 287.758
- Rent YoY
- ▲ 1.89%
- Metro
- Portland-Vancouver-Hillsboro, OR-WA
- State GDP YoY
- ▲ 2.05%
- F500 in state
- 2
Industry mix (Fortune 500 HQ in OR)
| Industry | F500 HQs | Revenue |
|---|---|---|
| Consumer Goods | 1 | $51B |
|
||
Price history
+0.0% since first listed2 events — show timeline
- 2026-03-03 Listed $163,000 WVMLS
- 2026-02-12 Listed $163,000 RMLS
Property tax history
+3.1%/yrLatest (2025): $819 · +2.8% YoY. Source: county tax records.
Cash-flow waterfall
monthlySold comps — $/sqft
last 12 mo · ≤1 miLoading sold comps…