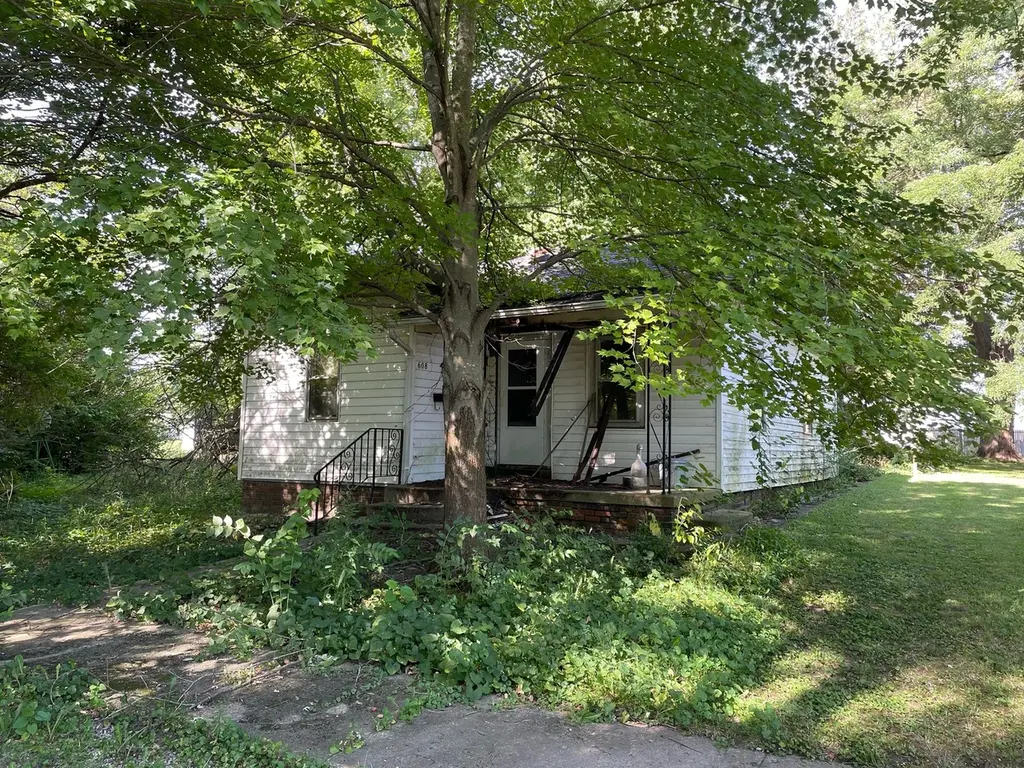
608 Elm St · Villa Grove, IL
Flood risk 1/10 · Minimal
- FEMA flood zone
- X (shaded)
- Chance of flooding over 30 yrs
- 0.0%
- Est. flood insurance / yr
- $507 – $1,088
Fire risk 1/10 · Minimal
- Est. fire insurance / yr
- $804 – $1,492
Heat risk 3/10 · Minor
- Hot days now (above 105°F)
- 7 days/yr
- Hot days in 30 yrs
- 19 days/yr
Wind risk 2/10 · Minimal
- Chance of severe wind over 30 yrs
- 1.0%
Air-quality risk 2/10 · Minimal
- Unhealthy air days now
- 1 days/yr
- Unhealthy air days in 30 yrs
- 1 days/yr
Risk factors via First Street. Map © Google.
Why this score? — see what drove the D grade
The composite is a weighted blend of 9 inputs, each scored 0–100. Each bar is that input's sub-score; the figure is the points it added to the 100-point composite (weight × sub-score).
- Cash flow +15.0/30.0
- ARV discount +7.5/15.0
- 1% rule +5.0/10.0
- DSCR +5.0/10.0
- Livability +3.2/5.0
- Rent growth +2.5/5.0
- Condition / age +2.5/5.0
- Schools +1.6/10.0
- Appreciation +0.0/10.0
$14,900
🖨 Deal sheet 📄 Offer letter ✓ Due diligence
Listing remarks MLS
Sitting on a triple lot at the end of a quiet street in Villa Grove you'll find endless possibilities! Start fresh and build your dream home or add your creative touches and restore what once was. Sold as is.
Key facts
- Quiet street
- Triple lot
- 0.49 acre lot
Tags
Neighborhood map
What this means for you Summary
Snapshot
- This is a 2-bed/1.0-bath single-family listed at $15k.
Deal economics
- At list price, monthly cash flow is $573 ($7k/yr) — positive.
- The deal already cash-flows at list — no discount required.
- Meets the 1% rule at list price ($855 rent vs $15k).
- Recommended offer: $15k (1.5% below list) — sets the bar for market timing.
Location & tenants
- Location reads 64/100 on livability (#713 in IL) — a middle-class / working-renter tenant base. Strengths: cost of living A+, crime A, housing A; Watch: employment D, schools D-, amenities F.
- Villa Grove CUSD 302 (rural): math 15% / reading 19% proficiency, ranked #464 of 620 in IL (top 75%) — low school quality limits family demand, transient renter base, plan for 1-2y turnover.
- Market conditions: 10 active listings in the ZIP; 36 units permitted in Douglas County in 2024 (0 in 5+ unit buildings).
Forward outlook
- Local home prices are declining (-3.0%/yr); year-one equity from $103 of loan paydown is wiped out by about $447 of value loss. Plan a longer hold.
- Douglas County population projected to shrink 7% by 2050 — rents likely to lag national; underwrite the cash flow, not the appreciation.
- At projected returns (-3.0% appreciation + 3.0% rent growth), your $4k cash investment doubles in ~1 year — after that, you're playing with house money.
Negotiation context
- It's been on market 27 days — a 2% lower offer ($15k) is reasonable based on typical stale-listing flexibility.
- 3 sale attempts since 2y ago with the ask held roughly flat each time — persistent listings suggest the price (not the market) is what's stuck; bring a comps-based counter.
Risks & watch-outs
- Watch-outs: built in 1904 — expect roof / HVAC / electrical / plumbing capex.
Questions for the listing agent
- Built in 1904 — when were the roof, HVAC, electrical panel, plumbing, and water heater last replaced?
- Is there a deadline driving the sale (1031 exchange, divorce, estate, relocation)? That informs how much negotiation room exists.
- Schools are D-rated, which usually means shorter tenancies and higher turnover. Who's the typical renter profile here, and what's been the actual vacancy rate?
- The area grade is low — what's the realistic commute time and amenity access for the typical tenant pool here? Any planned neighborhood developments (good or bad) we should know about?
- What's the average days-on-market for RENTAL listings here right now (not sales)? A rising rental-DOM trend means longer vacancies and softer asking-rent achievability than the comps imply.
- What's the recent tenant-quality profile in this submarket — average credit score on applications, eviction rate, late-payment / NSF rate, and stable-employment percentage? A property-management company in the area should have these aggregated.
- How much new for-sale + rental construction is in the pipeline within 1–3 miles? Heavy new supply typically softens prices + rents 12–24 months out; constrained supply supports both.
Investment metrics
- 1% rule
- 5.74% ✓
- Cap rate
- 52.43%
- Cash-on-cash
- 164.77%
- DSCR
- 8.33
- GRM
- 1.5
CMA / ARV
- ARV (median comp)
- $70,417
- List price
- $14,900
- Delta
- -78.84%
- Verdict
- UNDERPRICED
- Comps
- 20 within 1.0 mi
Show comp detail 6 sales within ~0.75 mi
| Address | Dist | Beds/Ba | Sqft | Sold | Price | $/sf | Match |
|---|---|---|---|---|---|---|---|
| 303 S Spruce St | 0.23mi | 3/1.0 (+1) | 945 (+10%) | 2mo | $36,050 | $38 | 66 |
| 207 N Pine St | 0.60mi | 2/1.0 | 836 (-3%) | 11mo | $100,000 | $120 | 58 |
| 405 E Wilson St | 0.70mi | 2/1.0 | 889 (+4%) | 22mo | $65,000 | $73 | 43 |
| 203 N Pine St | 0.59mi | 2/1.0 | 960 (+12%) | 17mo | $62,000 | $65 | 39 |
| 408 W Harrison St | 0.75mi | 2/1.5 | 959 (+12%) | 9mo | $149,000 | $155 | 36 |
| 307 E Wilson St | 0.69mi | 3/1.0 (+1) | 953 (+11%) | 20mo | $60,000 | $63 | 28 |
Match score weights: distance 35% · size 25% · config 20% · recency 20%. Top-matched comps best support the ARV.
Projected returns pro-forma
-3.0% appreciation · 3.0% rent growth · sell at horizon
- IRR
- —
- Equity multiple
- 9.17×
- Total profit
- $34,083
- Equity at exit
- $2,222
- IRR
- —
- Equity multiple
- 19.39×
- Total profit
- $76,710
- Equity at exit
- $1,288
Cash invested: $4,172 (down + closing). Projections, not guarantees.
Landlord ↔ Tenant lean methodology
- Overall (STATE)
- 43 Moderately Tenant-Leaning
- State Illinois
- 43 Moderately Tenant-Leaning · D+7
- County
- — inherits STATE
- City
- — inherits STATE
ZIP-level market 61956
- Home prices YoY
- -9.3%
- Active inventory
- 10
- Price-to-rent
- 1.5×
Monthly cashflow live
- Estimated rent
- $855 medium interval (Pro) →
- Mortgage (P&I)
- −$78
- Tax est. 1.5%
- −$19 /mo · $224/yr
- Insurance
- −$6
- HOA
- −$0
- Vacancy / Maint / Mgmt
- −$180
- Net cashflow
- $573
Break-even live
UW: 25.0% down · 7.5% · 30yr · 1.5% tax · 5.0% vac · 8.0% maint · 8.0% mgmt
Financing live
Cash to close
- Down payment
- $3,725
- Closing costs
- $447
- Reserves months
- —
- Total cash needed
- —
Loan-product check · same deal, 3 products live
Conventional
25% down · 7.5% · 30yr
- Down + closing
- —
- Monthly P&I
- —
- Monthly cashflow
- —
- DSCR
- —
- Eligible?
- —
Personal DTI + credit; lowest rate.
DSCR
20% down · 8.5% · 30yr
- Down + closing
- —
- Monthly P&I
- —
- Monthly cashflow
- —
- DSCR
- —
- Eligible?
- —
No personal income docs; deal must DSCR.
Hard money
10% down · 12.0% · 12mo
- Down + closing
- —
- Monthly P&I
- —
- Monthly cashflow
- —
- DSCR
- —
- Eligible?
- —
Short-term bridge; refi at stabilization.
Listing history 19 events
-
2026-06-18days on market $14,900 Active 27 DOM
-
2026-06-17days on market $14,900 Active 26 DOM
-
2026-06-16days on market $14,900 Active 25 DOM
-
2026-06-15days on market $14,900 Active 24 DOM
-
2026-06-13days on market $14,900 Active 22 DOM
-
2026-06-12days on market $14,900 Active 21 DOM
-
2026-06-09days on market $14,900 Active 18 DOM
-
2026-06-08days on market $14,900 Active 17 DOM
-
2026-06-07days on market $14,900 Active 16 DOM
-
2026-06-05days on market $14,900 Active 14 DOM
-
2026-06-04days on market $14,900 Active 12 DOM
-
2026-06-02days on market $14,900 Active 11 DOM
-
2026-06-01days on market $14,900 Active 10 DOM
-
2026-05-31days on market $14,900 Active 9 DOM
-
2026-05-31days on market $14,900 Active 8 DOM
-
2025-11-14$14,900 Active
-
2025-04-16$14,900 Active 208-char remark
Show marketing remark (208 chars)
Sitting on a triple lot at the end of a quiet street in Villa Grove you'll find endless possibilities! Start fresh and build your dream home or add your creative touches and restore what once was. Sold as is.
-
2024-12-26historical
-
2024-08-16Active
ⓘ Source: listings_history table (triggers on properties + properties_extension) + one-shot
backfill from property_details.listing_events for pre-trigger history.
Climate risk First Street
- Flood 1/10 Low FEMA zone X (shaded) · 0% chance over 30 yrs
- Wildfire 1/10 Low
- Heat 3/10 Moderate 7 d/yr ≥105°F today · 19 d/yr by 30 yrs out
- Wind 2/10 Low 100% chance of damaging wind over 30 yrs
- Air quality 2/10 Low 1 unhealthy d/yr today · 1 by 30 yrs out
Nearby sold comps map
Loading sold comps map…
Walkable amenities ~0.75 mi
Loading nearby amenities…
Taxation est. · year 1
- Rental income
- $10,265
- − Mortgage interest
- −$835
- − Property taxes
- −$224
- − Insurance
- −$74
- − Repairs & maintenance
- −$821
- − Management
- −$821
- − Depreciation
- −$433
- Taxable income
- $7,057
- Est. tax owed @ 24.0%
- −$1,694
- After-tax cash flow
- $5,180/yr
For passive investors: Depreciation is non-cash, so a rental often shows a tax loss while cash-flowing — sheltering income. Rental losses are passive: they offset passive income freely, and up to $25,000/yr can offset ordinary (W-2) income if you actively participate and your MAGI is under $100k (phasing out to $0 by $150k); unused losses carry forward. On sale, claimed depreciation is recaptured at up to 25%, and gains may owe capital-gains tax (a 1031 exchange can defer both). Figures are a year-1 estimate at your 24.0% rate — not tax advice; consult a CPA.
Schools (NCES district)
- District
- Villa Grove CUSD 302
- NCES district ID
- 1740320
- Math proficiency
- 15% ▼ -6.00%
- Reading proficiency
- 19% ▼ -12.00%
- Median HH income
- $52,614
- Composite
- 15.67/100
- National rank
- #9286
- State rank
- #464 of 620 in IL
Livability — Villa Grove
- Score
- 64/100
- State rank
- #713
- US rank
- #14496
Category grades
Schools grade is shown separately in the Schools card above.
Census & demographics
- Census place
- Villa Grove, IL
- Population (ZIP)
- 3,046
Population outlook (Douglas County) Hauer SSP2
- Today (2025)
- 19,209 people
- By 2030
- 18,940 · -1.4%
- By 2040
- 18,397 · -4.2%
- By 2050
- 17,829 · -7.2%
- By 2075
- 16,395 · -14.6%
- By 2100
- 14,329 · -25.4%
Race, ethnicity, and origin ACS 2023
- Neighborhood character
- Predominantly White (97%)
- Race & ethnicity
- White 97% Asian 1% Hispanic / Latino 1% Two or more races 1%
- Common ancestry
- Italian 2% Iranian 2% Slovak 2%
- Foreign-born
- 2% · Canada
- Languages at home
- 96% English-only · Russian/Polish/Slavic 1% Spanish 1% French/Haitian/Cajun 1%
Political lean MEDSL · Douglas
- 2024 margin
- Solid R (+46.1) · D 26.1% · R 72.3% · Other 1.6%
- 2008→2024 swing
- -24.9pp toward R · 2008: -21.3pp · 2024: -46.1pp
- All cycles
- 2024: R+46.1 2020: R+44.4 2016: R+46.3 2012: R+36.8 2008: R+21.3
Not yet ingested
- Civics
- —
Market trends
- HPI YoY
- ▼ -21.97%
- Current HPI
- 213.6799
- Rent YoY
- —
- Metro
- —
- State GDP YoY
- ▲ 1.59%
- F500 in state
- 60
Industry mix (Fortune 500 HQ in IL)
| Industry | F500 HQs | Revenue |
|---|---|---|
| Insurance | 4 | $201B |
|
||
| Consumer Goods | 4 | $87B |
|
||
| Industrial Machinery | 3 | $64B |
|
||
| Healthcare | 2 | $55B |
|
||
| Retail / Pharmacy | 1 | $148B |
|
||
| Agriculture / Food | 1 | $86B |
|
||
Price history
+0.0% since first listed4 events — show timeline
- 2025-11-14 Listed $14,900 CIBR
- 2025-04-16 Listed $14,900 MRED as Distributed by MLS Grid
- 2024-12-26 Listing Removed — MRED as Distributed by MLS Grid
- 2024-08-16 Listed — MRED as Distributed by MLS Grid
Property tax history
+27.8%/yrLatest (2024): $1,639 · +6.5% YoY. Source: county tax records.
Cash-flow waterfall
monthlySold comps — $/sqft
last 12 mo · ≤1 miLoading sold comps…