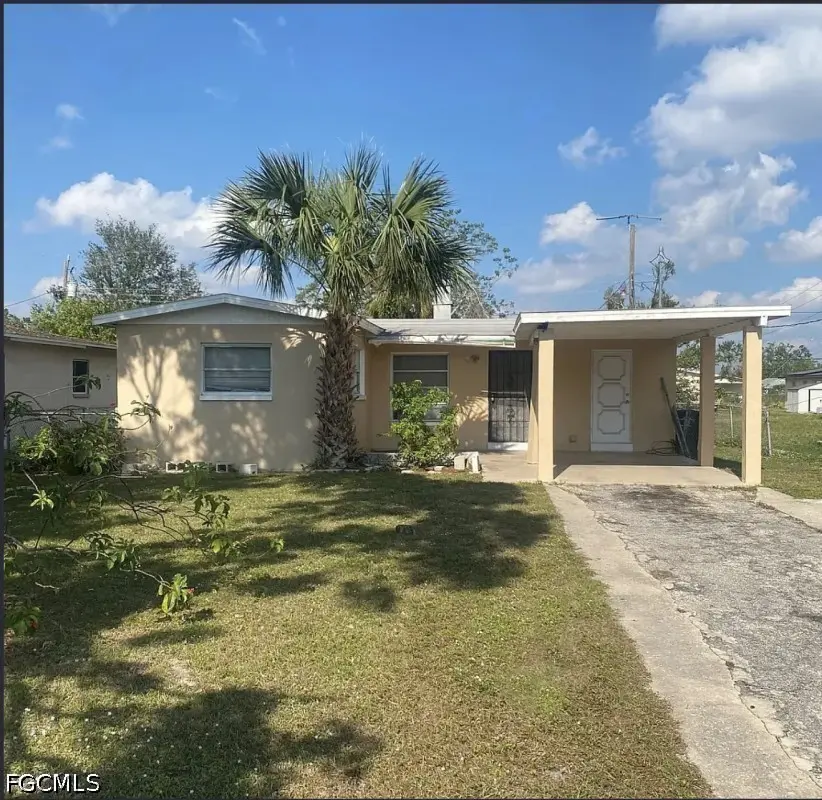
2985 Saint Charles St · Fort Myers, FL
Flood risk 1/10 · Minimal
- FEMA flood zone
- X (unshaded)
- Chance of flooding over 30 yrs
- 0.0%
- Est. flood insurance / yr
- $507 – $1,088
Fire risk 1/10 · Minimal
- Est. fire insurance / yr
- $947 – $1,759
Heat risk 10/10 · Severe
- Hot days now (above 107°F)
- 7 days/yr
- Hot days in 30 yrs
- 31 days/yr
Wind risk 10/10 · Severe
- Chance of severe wind over 30 yrs
- 99.0%
Air-quality risk 2/10 · Minimal
- Unhealthy air days now
- 1 days/yr
- Unhealthy air days in 30 yrs
- 1 days/yr
Risk factors via First Street. Map © Google.
Why this score? — see what drove the B- grade
The composite is a weighted blend of 9 inputs, each scored 0–100. Each bar is that input's sub-score; the figure is the points it added to the 100-point composite (weight × sub-score).
- Cash flow +25.3/30.0
- ARV discount +15.0/15.0
- DSCR +8.3/10.0
- 1% rule +6.3/10.0
- Livability +4.3/5.0
- Schools +4.1/10.0
- Condition / age +2.5/5.0
- Rent growth +1.4/5.0
- Appreciation +0.0/10.0
$175,000
🖨 Deal sheet 📄 Offer letter ✓ Due diligence
Listing remarks
Opportunity knocks in Fort Myers! value-packed home with strong upside—perfect for a first-time buyer ready to build equity or a savvy handyman/investor looking for their next project. This property offers a solid footprint and plenty of potential to update and customize to your taste. Bring your vision and transform this into a standout home. Conveniently located near shopping, dining, schools, and major roadways. Priced with updates in mind—don’t miss your chance to create instant value in a growing area.
Key facts
- 6,490 sq ft lot
- Parking
- Built 1963
Property features AI
Finance
- Financial info: Pets allowed
- HOA & community: No association fee
Exterior
- Parking: Attached carport; Two parking spaces (one covered/carport space)
- Utilities: Public water; Public sewer; Cable available
- Home design: Single-story; Entry level: 1; Faces south; Resale property
- Construction: Block, concrete and stucco construction; Shingle roof; Built on foundation (original construction materials listed)
- Exterior features: Patio; Paved road access; Rectangular lot; North exposure
Interior
- Kitchen: Microwave; Range; Refrigerator
- Flooring: Tile
- Bathrooms: 2 full bathrooms
- Heating & cooling: Central heating (electric); Central air conditioning (electric)
- Interior features: Living/dining room; Tub with shower; Single-hung windows; Unfurnished
Neighborhood map
What this means for you Summary
Snapshot
- This is a 3-bed/2.0-bath single-family listed at $175k.
Deal economics
- At list price, monthly cash flow is $398 ($5k/yr) — positive.
- The deal already cash-flows at list — no discount required.
- Meets the 1% rule at list price ($2k rent vs $175k).
- Recommended offer: $170k (3.0% below list) — sets the bar for market timing.
- Cap rate 9.0% vs local median 3.0% in Fort Myers — top-decile yield for the area; either an underpriced asset or a hidden risk that comps aren't pricing in. Stress-test before assuming the spread holds.
Location & tenants
- Location reads 86/100 on livability (#14 in FL, #383 nationally) — a professional / high-income tenant draw. Strengths: amenities A+, commute A+, housing A+.
- Lee (suburban): math 47% / reading 50% proficiency, ranked #42 of 73 in FL (top 58%) — families likely to look elsewhere, expect single-tenant / working-renter base with shorter leases.
- Market conditions: Rents falling (-4.3%/yr); 267 active listings in the ZIP; 40 comparable units currently listed for rent nearby; rentals at typical pace (median 19d on market — plan ~3-4 weeks tenant-placement turnaround); 15,411 units permitted in Lee County in 2024 (4,686 in 5+ unit buildings).
- At $1,983/mo this rent would consume 45% of the median local household income ($53k/yr) (locally 2324% of renters already pay >50% of income on rent) — very limited rent-growth headroom before tenants either downsize or default.
Forward outlook
- Local home prices are declining (-3.0%/yr); year-one equity from $1k of loan paydown is wiped out by about $5k of value loss. Plan a longer hold.
- Lee County population projected at +44% by 2050 — long-run rental-demand tailwind backs the buy-and-hold thesis.
Negotiation context
- It's been on market 41 days — a 3% lower offer ($170k) is reasonable based on typical stale-listing flexibility.
- 7 sale attempts since 6y ago; this cycle's ask has dropped $30k (15%) from the opening price — seller is motivated, your offer sets the floor, not the list.
- Current owner paid $80k; list at $175k implies a 119% gain — meaningful room to come down on a strong offer.
Risks & watch-outs
- Climate carrying-cost: severe wind risk, 99% chance of damaging wind over 30y; extreme-heat days projected 7→31/yr by 2055 (HVAC capex compounding) — expect insurance premiums to compound above CPI over the hold.
Questions for the listing agent
- It's been on market 41 days. Have you received any prior offers? Is the seller open to a 3% concession, seller financing, or rate buy-down credit?
- Built in 1963 — when were the roof, HVAC, electrical panel, plumbing, and water heater last replaced?
- Is there a deadline driving the sale (1031 exchange, divorce, estate, relocation)? That informs how much negotiation room exists.
- What's the average days-on-market for RENTAL listings here right now (not sales)? A rising rental-DOM trend means longer vacancies and softer asking-rent achievability than the comps imply.
- What's the recent tenant-quality profile in this submarket — average credit score on applications, eviction rate, late-payment / NSF rate, and stable-employment percentage? A property-management company in the area should have these aggregated.
- How much new for-sale + rental construction is in the pipeline within 1–3 miles? Heavy new supply typically softens prices + rents 12–24 months out; constrained supply supports both.
Investment metrics
- 1% rule
- 1.13% ✓
- Cap rate
- 9.02%
- Cash-on-cash
- 9.76%
- DSCR
- 1.43
- GRM
- 7.4
CMA / ARV
- ARV (on-the-fly)
- $289,680
- Comps found
- 6
Show comp detail 6 sales within ~0.75 mi
| Address | Dist | Beds/Ba | Sqft | Sold | Price | $/sf | Match |
|---|---|---|---|---|---|---|---|
| 2921 Lafayette St | 0.14mi | 3/2.0 | 1,519 (+7%) | 14mo | $155,000 | $102 | 70 |
| 2809 Thomas St | 0.27mi | 3/2.0 | 1,259 (-11%) | 14mo | $199,900 | $159 | 57 |
| 2924 Dunbar Ave | 0.18mi | 4/3.0 (+1) | 1,619 (+14%) | 4mo | $330,000 | $204 | 56 |
| 2639 Saint Charles St | 0.45mi | 3/2.0 | 1,317 (-7%) | 16mo | $300,000 | $228 | 53 |
| 2979 Blount St | 0.49mi | 4/2.0 (+1) | 1,392 (-2%) | 21mo | $265,000 | $190 | 51 |
| 2981 Market St | 0.06mi | 4/1.0 (+1) | 1,248 (-12%) | 24mo | $259,900 | $208 | 48 |
Match score weights: distance 35% · size 25% · config 20% · recency 20%. Top-matched comps best support the ARV.
Projected returns pro-forma
-3.0% appreciation · 0.0% rent growth · sell at horizon
- IRR
- -5.0%
- Equity multiple
- 0.82×
- Total profit
- $-8,789
- Equity at exit
- $26,093
- IRR
- 0.9%
- Equity multiple
- 1.05×
- Total profit
- $2,582
- Equity at exit
- $15,131
Cash invested: $49,000 (down + closing). Projections, not guarantees.
Landlord ↔ Tenant lean methodology
- Overall (STATE)
- 87 Strongly Landlord-Friendly
- State Florida
- 87 Strongly Landlord-Friendly · R+3
- County
- — inherits STATE
- City
- — inherits STATE
ZIP-level market 33916
- Home prices YoY
- -28.2%
- Rents YoY
- -4.3%
- Active inventory
- 267
- Price-to-rent
- 7.4×
Monthly cashflow live
- Estimated rent
- $1,983 high interval (Pro) →
- Mortgage (P&I)
- −$918
- Tax from tax record
- −$178 /mo · $2,130/yr
- Insurance
- −$73
- HOA
- −$0
- Vacancy / Maint / Mgmt
- −$416
- Net cashflow
- $398
Break-even live
UW: 25.0% down · 7.5% · 30yr · 1.5% tax · 5.0% vac · 8.0% maint · 8.0% mgmt
Financing live
Cash to close
- Down payment
- $43,750
- Closing costs
- $5,250
- Reserves months
- —
- Total cash needed
- —
Loan-product check · same deal, 3 products live
Conventional
25% down · 7.5% · 30yr
- Down + closing
- —
- Monthly P&I
- —
- Monthly cashflow
- —
- DSCR
- —
- Eligible?
- —
Personal DTI + credit; lowest rate.
DSCR
20% down · 8.5% · 30yr
- Down + closing
- —
- Monthly P&I
- —
- Monthly cashflow
- —
- DSCR
- —
- Eligible?
- —
No personal income docs; deal must DSCR.
Hard money
10% down · 12.0% · 12mo
- Down + closing
- —
- Monthly P&I
- —
- Monthly cashflow
- —
- DSCR
- —
- Eligible?
- —
Short-term bridge; refi at stabilization.
Rent comps 40 comps
| Address | Beds | Baths | Sqft | Rent | $/sqft | DOM | Units | Dist |
|---|---|---|---|---|---|---|---|---|
| 2987 Thomas St Fort Myers, FL | 3.0 | 2.0 | 1200 | $2,100 | $1.75 | 21d | 1 | 0.11mi |
| 2147 Pauldo St Fort Myers, FL | 3.0 | 2.0 | 1088 | $1,395 | $1.28 | 23d | 1 | 0.12mi |
| 2955 Dunbar St Unit A Fort Myers, FL | 3.0 | 2.0 | 1285 | $2,300 | $1.79 | 15d | 1 | 0.16mi |
| 2955 Dunbar St Unit A Fort Myers, FL | 3.0 | 2.0 | 1111 | $2,300 | $2.07 | 3d | 1 | 0.16mi |
| 3141 Edison Ave Fort Myers, FL | 4.0 | 1.0 | 1136 | $1,500 | $1.32 | 23d | 1 | 0.25mi |
| 3034 Price Ave Fort Myers, FL | 3.0 | 2.0 | 1367 | $2,100 | $1.54 | 3d | 1 | 0.25mi |
| 2218 Quality Life Center Way Fort Myers, FL | 4.0 | 2.0 | 1257 | $2,250 | $1.79 | 23d | 1 | 0.28mi |
| 4051 Regata Way Fort Myers, FL | 1.0–3.0 | 1.0–2.0 | 987 | $2,021 | $2.05 | 2d | 34 | 0.36mi |
| 2225 Carver Ave Fort Myers, FL | 3.0 | 2.0 | 1193 | $2,200 | $1.84 | 23d | 1 | 0.37mi |
| 3306 Bassie Ct Fort Myers, FL | 4.0 | 2.0 | 1257 | $2,100 | $1.67 | 23d | 1 | 0.40mi |
| 2651 Market St Fort Myers, FL | 3.0 | 2.0 | 1184 | $1,295 | $1.09 | 23d | 1 | 0.44mi |
| 2649 Market St Unit 2651 Fort Myers, FL | 3.0 | 2.0 | 1184 | $1,250 | $1.06 | 19d | 1 | 0.44mi |
| 2627 Saint Charles St Fort Myers, FL | 4.0 | 2.0 | 1400 | $1,850 | $1.32 | 14d | 1 | 0.47mi |
| 3341 Willard St Fort Myers, FL | 4.0 | 2.0 | 1619 | $2,500 | $1.54 | 19d | 1 | 0.50mi |
| 3341 Willard St Fort Myers, FL | 4.0 | 2.0 | 1257 | $2,500 | $1.99 | 15d | 1 | 0.50mi |
| 3216 Dale St Fort Myers, FL | 2.0 | 1.0 | 886 | $1,650 | $1.86 | 3d | 1 | 0.54mi |
| 2103 French St Fort Myers, FL | 3.0 | 2.0 | 1100 | $1,800 | $1.64 | 1d | 1 | 0.56mi |
| 2103 French St Fort Myers, FL | 3.0 | 2.0 | 1100 | $1,900 | $1.73 | 23d | 1 | 0.56mi |
| 2103 French St Fort Myers, FL | 3.0 | 2.0 | 1100 | $1,800 | $1.64 | 1d | 1 | 0.56mi |
| 2103 French St Unit 2 Fort Myers, FL | 3.0 | 2.0 | 1100 | $1,800 | $1.64 | 23d | 1 | 0.56mi |
| 3417 South St Fort Myers, FL | 3.0 | 2.0 | 1008 | $1,695 | $1.68 | 23d | 1 | 0.65mi |
| 3425 South St Fort Myers, FL | 3.0 | 1.0 | 1132 | $1,395 | $1.23 | 3d | 1 | 0.66mi |
| 2656 Lime St Fort Myers, FL | 4.0 | 2.0 | 1232 | $1,700 | $1.38 | 3d | 1 | 0.69mi |
| 2525 Royal Palm Ave Fort Myers, FL | 2.0 | 1.0 | 900 | $1,550 | $1.72 | 23d | 1 | 0.76mi |
| 2330 Hoople St Fort Myers, FL | 3.0 | 2.0 | 1250 | $1,750 | $1.40 | 15d | 1 | 0.85mi |
| 2188 Barker Blvd Fort Myers, FL | 4.0 | 2.0 | 1367 | $2,600 | $1.90 | 23d | 1 | 0.86mi |
| 2132 Barker Blvd Fort Myers, FL | 4.0 | 2.0 | 1367 | $2,600 | $1.90 | 23d | 1 | 0.88mi |
| 2197 Davis Ct Fort Myers, FL | 4.0 | 2.0 | 1257 | $2,450 | $1.95 | 2d | 1 | 0.94mi |
| 2579 Second St Fort Myers, FL | 3.0 | 2.0 | 1404 | $2,500 | $1.78 | 15d | 1 | 0.94mi |
| 3323 Michigan Ave Fort Myers, FL | 3.0 | 2.0 | 1029 | $1,600 | $1.55 | 21d | 1 | 0.97mi |
| 1629 Poinsettia Ave Fort Myers, FL | 2.0 | 1.0 | 1410 | $2,500 | $1.77 | 23d | 1 | 0.98mi |
| 2330 Union St Fort Myers, FL | 3.0 | 1.0–2.0 | 951 | $3,714 | $3.90 | 3d | 27 | 1.02mi |
| 2822 Central Ave Fort Myers, FL | 3.0 | 2.0 | 1641 | $1,100 | $0.67 | 23d | 1 | 1.05mi |
| 2741 First St Apt 207 Fort Myers, FL | 2.0 | 2.5 | 1250 | $1,995 | $1.60 | 14d | 1 | 1.11mi |
| 2741 First St Apt 203 Fort Myers, FL | 2.0 | 2.5 | 1150 | $1,825 | $1.59 | 14d | 1 | 1.11mi |
| 2741 First St Apt 204 Fort Myers, FL | 2.0 | 2.5 | 1200 | $1,850 | $1.54 | 14d | 1 | 1.11mi |
| 2741 1st St Fort Myers, FL | 2.0 | 2.5 | 1250 | $1,975 | $1.58 | 11d | 1 | 1.11mi |
| 2817 Jackson St Fort Myers, FL | 3.0 | 2.0 | 1200 | $2,200 | $1.83 | 23d | 1 | 1.11mi |
| 2480 First St Fort Myers, FL | 2.0 | 1.0–2.0 | 984 | $2,499 | $2.54 | 2d | 26 | 1.12mi |
| 2711 1st St Fort Myers, FL | 2.0 | 2.0 | 1201 | $1,690 | $1.41 | 23d | 2 | 1.13mi |
Listing history 17 events
-
2026-05-05status Pending
-
2026-04-10price $175,000
-
2026-03-25$205,000 Active
-
2026-01-10historical $2,250
-
2025-10-30$2,250
-
2025-10-09historical $1,500
-
2025-08-02price $1,500
-
2025-08-01$2,000
-
2025-08-01historical $2,000
-
2025-07-31$2,000
-
2024-08-24historical $1,999
-
2024-06-05historical $1,999
-
2024-06-05$1,999
-
2024-03-04$1,999
-
2020-12-12historical
-
2020-06-16$135,000 Active
-
2005-07-27soldstatus $80,000
ⓘ Source: listings_history table (triggers on properties + properties_extension) + one-shot
backfill from property_details.listing_events for pre-trigger history.
Tax reassessment forecast FL · Resets to sale price
- Current annual tax
- $2,130 · $178/mo
- Projected year-2 tax
- $2,130 · $178/mo
- Expected delta
- $0/yr ($0/mo · 0.0%)
ⓘ Screening estimate from a state-policy table — verify with the county assessor before closing.
Climate risk First Street
- Flood 1/10 Low FEMA zone X (unshaded) · 0% chance over 30 yrs
- Wildfire 1/10 Low
- Heat 10/10 Extreme 7 d/yr ≥107°F today · 31 d/yr by 30 yrs out
- Wind 10/10 Extreme 99% chance of damaging wind over 30 yrs
- Air quality 2/10 Low 1 unhealthy d/yr today · 1 by 30 yrs out
Nearby sold comps map
Loading sold comps map…
Walkable amenities ~0.75 mi
Loading nearby amenities…
Taxation est. · year 1
- Rental income
- $23,796
- − Mortgage interest
- −$9,803
- − Property taxes
- −$2,130
- − Insurance
- −$875
- − Repairs & maintenance
- −$1,904
- − Management
- −$1,904
- − Depreciation
- −$5,091
- Taxable income
- $2,090
- Est. tax owed @ 24.0%
- −$502
- After-tax cash flow
- $4,279/yr
For passive investors: Depreciation is non-cash, so a rental often shows a tax loss while cash-flowing — sheltering income. Rental losses are passive: they offset passive income freely, and up to $25,000/yr can offset ordinary (W-2) income if you actively participate and your MAGI is under $100k (phasing out to $0 by $150k); unused losses carry forward. On sale, claimed depreciation is recaptured at up to 25%, and gains may owe capital-gains tax (a 1031 exchange can defer both). Figures are a year-1 estimate at your 24.0% rate — not tax advice; consult a CPA.
Schools (NCES district)
- District
- Lee
- NCES district ID
- 1201080
- Math proficiency
- 47% ▼ -11.00%
- Reading proficiency
- 50% ▼ -4.00%
- Median HH income
- $49,518
- Composite
- 41.49/100
- National rank
- #3458
- State rank
- #42 of 73 in FL
Livability — Fort Myers
- Score
- 86/100
- State rank
- #14
- US rank
- #383
Category grades
Schools grade is shown separately in the Schools card above.
Census & demographics
- Census place
- Fort Myers, FL
- County
- Lee County · 788,662 people
- City population
- 278,598
- Metro
- Cape Coral-Fort Myers, FL
- Population (ZIP)
- 27,943
- Household income
- $52,586
- Rent vs Own
- Severe rent burden
- 2324.0
Population outlook (Lee County) Hauer SSP2
- Today (2025)
- 871,946 people
- By 2030
- 955,468 · +9.6%
- By 2040
- 1,113,587 · +27.7%
- By 2050
- 1,256,891 · +44.1%
- By 2075
- 1,560,270 · +78.9%
- By 2100
- 1,726,848 · +98.0%
Race, ethnicity, and origin ACS 2023
- Neighborhood character
- Highly diverse neighborhood (Simpson 0.71)
- Race & ethnicity
- Black 34% Hispanic / Latino 30% White 28% Two or more races 21% Asian 2%
- Hispanic origin (detail)
- Mexican 5% Puerto Rican 6% Cuban 7% Dominican 1%
- Common ancestry
- Estonian 3% Hispanic 1% Romanian 1%
- Foreign-born
- 22% · Canada, Vietnam, China
- Languages at home
- 69% English-only · Spanish 24% Other Indo-European 4% French/Haitian/Cajun 1%
Political lean MEDSL · Lee
- 2024 margin
- Strong R (+28.4) · D 35.5% · R 63.9%
- 2008→2024 swing
- -18.0pp toward R · 2008: -10.4pp · 2024: -28.4pp
- All cycles
- 2024: R+28.4 2020: R+19.2 2016: R+20.4 2012: R+16.6 2008: R+10.4
Not yet ingested
- Civics
- —
Market trends
- HPI YoY
- ▼ -95.73%
- Current HPI
- 243.2657
- Rent YoY
- ▼ -4.30%
- Metro
- Cape Coral-Fort Myers, FL
- State GDP YoY
- ▲ 3.28%
- F500 in state
- 36
Industry mix (Fortune 500 HQ in FL)
| Industry | F500 HQs | Revenue |
|---|---|---|
| Industrial Technology | 2 | $29B |
|
||
| Insurance | 2 | $17B |
|
||
| Retail | 1 | $60B |
|
||
| Technology Distribution | 1 | $58B |
|
||
| Homebuilding | 1 | $35B |
|
||
| Technology Manufacturing | 1 | $35B |
|
||
Price history
+118.8% since first listed17 events — show timeline
- 2026-05-05 Pending — FORTMLS
- 2026-04-10 Price Changed $175,000 FORTMLS
- 2026-03-25 Listed $205,000 FORTMLS
- 2026-01-10 Rental Removed $2,250 APPFOLIO
- 2025-10-30 Listed for Rent $2,250 APPFOLIO
- 2025-10-09 Rental Removed $1,500 FORTMLS
- 2025-08-02 Price Changed $1,500 FORTMLS
- 2025-08-01 Listed for Rent $2,000 FORTMLS
- 2025-08-01 Rental Removed $2,000 NAPLESMLS
- 2025-07-31 Listed for Rent $2,000 NAPLESMLS
- 2024-08-24 Rental Removed $1,999 NAPLESMLS
- 2024-06-05 Rental Removed $1,999 FORTMLS
- 2024-06-05 Listed for Rent $1,999 NAPLESMLS
- 2024-03-04 Listed for Rent $1,999 FORTMLS
- 2020-12-12 Listing Removed — FORTMLS
- 2020-06-16 Listed $135,000 FORTMLS
- 2005-07-27 Sold (Public Records) $80,000 Public Records
Property tax history
+7.7%/yrLatest (2025): $2,130 · -1.4% YoY. Source: county tax records.
Cash-flow waterfall
monthlySold comps — $/sqft
last 12 mo · ≤1 miLoading sold comps…