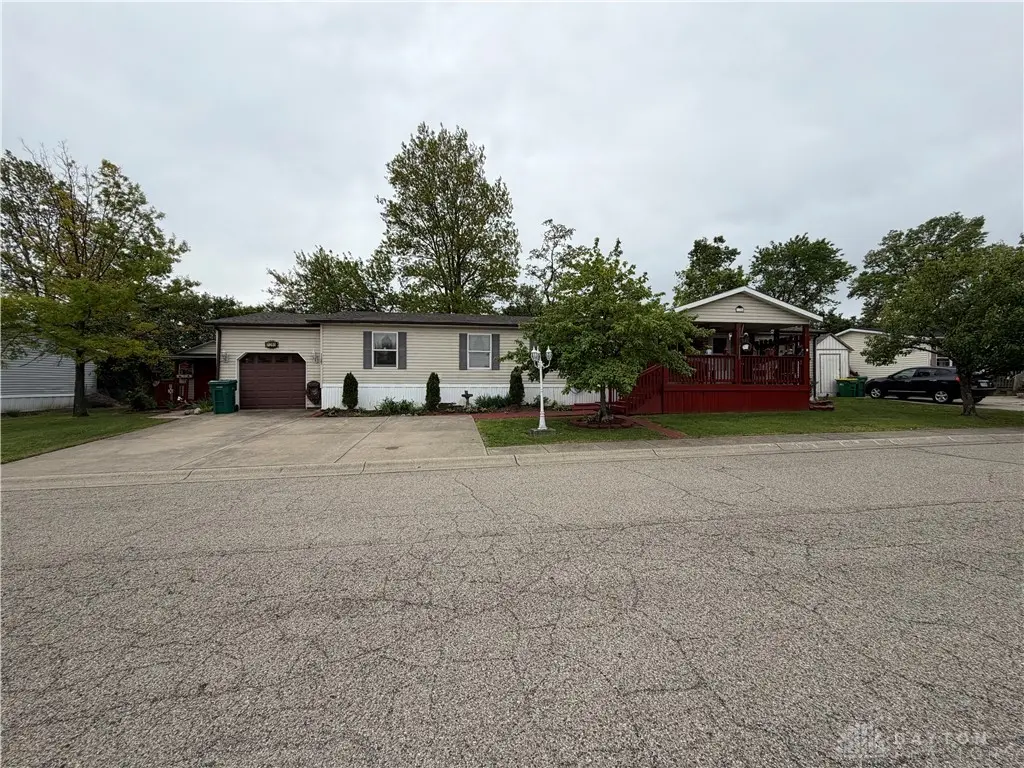
11285 Crimson · Springboro, OH
Flood risk 1/10 · Minimal
- FEMA flood zone
- X (unshaded)
- Chance of flooding over 30 yrs
- 0.0%
- Est. flood insurance / yr
- $507 – $1,088
Fire risk 1/10 · Minimal
- Est. fire insurance / yr
- $713 – $1,323
Heat risk 4/10 · Minor
- Hot days now (above 100°F)
- 7 days/yr
- Hot days in 30 yrs
- 19 days/yr
Wind risk 2/10 · Minimal
- Chance of severe wind over 30 yrs
- 1.0%
Air-quality risk 4/10 · Minor
- Unhealthy air days now
- 4 days/yr
- Unhealthy air days in 30 yrs
- 5 days/yr
Risk factors via First Street. Map © Google.
Why this score? — see what drove the C+ grade
The composite is a weighted blend of 9 inputs, each scored 0–100. Each bar is that input's sub-score; the figure is the points it added to the 100-point composite (weight × sub-score).
- Cash flow +30.0/30.0
- 1% rule +10.0/10.0
- DSCR +10.0/10.0
- Schools +4.8/10.0
- Livability +4.0/5.0
- Rent growth +3.3/5.0
- Condition / age +2.2/5.0
- ARV discount +0.0/15.0
- Appreciation +0.0/10.0
$95,000
🖨 Deal sheet 📄 Offer letter ✓ Due diligence
Listing remarks
Large home with 4 bedrooms and 2 baths! All appliances stay (refrigerator, microwave, range, washer, dryer, and dishwasher)!! Truly move in ready!! Big front porch and back porch! Gorgeous backyard with stepping stones and landscaping!! Attached garage and storage shed. Located in Oakwood Community that has lots to offer- pool and playground!! Nice community and ready for you to start making memories !! Hurry this one won't last long!!
Key facts
- Attached garage
- Landscaping
- Front porch
Tags
Property features AI
Finance
- HOA & community: Homeowners association with a monthly fee of $700; HOA covers clubhouse, grounds maintenance, structure maintenance, pool(s), snow removal and trash
Exterior
- Parking: Attached one-car garage
- Security: Smoke detector(s)
- Utilities: Public water; Sewer available; Electric heating; Central air conditioning
- Home design: Single-story home; Vinyl siding exterior; Residential zoning
- Construction: Vinyl siding construction
- Exterior features: Deck; Patio; Porch; In-ground pool; Shed(s) for additional storage
Interior
- Kitchen: Kitchen with island; Range; Microwave; Dishwasher; Refrigerator
- Bedrooms: Main level bedrooms (three listed); Additional main level room that may serve as bedroom or flex space
- Bathrooms: Two full bathrooms (both on main level)
- Interior features: Cathedral ceilings; Kitchen island; Walk-in closets; Smoke detectors
- Laundry & utility: Washer; Dryer; Storage space / shed
Neighborhood map
What this means for you Summary
Snapshot
- This is a 4-bed/2.0-bath manufactured listed at $95k. Condition is rated fair.
Deal economics
- At list price, monthly cash flow is $393 ($5k/yr) — positive.
- The deal already cash-flows at list — no discount required.
- Meets the 1% rule at list price ($2k rent vs $95k).
- Recommended offer: $92k (3.0% below list) — sets the bar for market timing.
- Cap rate 11.3% vs local median 3.0% in Springboro — top-decile yield for the area; either an underpriced asset or a hidden risk that comps aren't pricing in. Stress-test before assuming the spread holds.
Location & tenants
- Location reads 81/100 on livability (#93 in OH, #1,395 nationally) — a professional / high-income tenant draw. Strengths: schools A+, crime A+, employment A+; Watch: health & safety C-, amenities F, commute F.
- Miamisburg City (suburban): math 52% / reading 61% proficiency, ranked #338 of 656 in OH (top 52%) — acceptable for families but not a draw, mixed tenant base, ~2y average lease.
- Market conditions: Rents rising (+3.3%/yr); 113 active listings in the ZIP; 2 comparable units currently listed for rent nearby; solid renter incomes; 907 units permitted in Montgomery County in 2024 (416 in 5+ unit buildings).
- This rent runs 31% of the median local income ($85k/yr) — at the standard rent-burdened threshold; future hikes will face affordability resistance.
Forward outlook
- Local home prices are declining (-3.0%/yr); year-one equity from $657 of loan paydown is wiped out by about $3k of value loss. Plan a longer hold.
- Montgomery County population projected at -10% by 2050 — secular population decline; favor cash flow + early exit over multi-decade hold.
- At projected returns (-3.0% appreciation + 3.3% rent growth), your $27k cash investment doubles in ~7 years — after that, you're playing with house money.
Negotiation context
- It's been on market 45 days — a 3% lower offer ($92k) is reasonable based on typical stale-listing flexibility.
Risks & watch-outs
- Watch-outs: HOA is 32% of rent.
Questions for the listing agent
- It's been on market 45 days. Have you received any prior offers? Is the seller open to a 3% concession, seller financing, or rate buy-down credit?
- Have any recent inspections been done? Can we get a copy of the seller's disclosures and any deferred-maintenance estimates?
- What does the HOA fee cover, when was the last increase, and are there any pending special assessments or reserve-fund shortfalls?
- Is there a deadline driving the sale (1031 exchange, divorce, estate, relocation)? That informs how much negotiation room exists.
- Schools are A-rated — typically a magnet for longer-tenancy family renters. What's the average tenant stay here, and is there a school-zone premium baked into asking?
- What's the average days-on-market for RENTAL listings here right now (not sales)? A rising rental-DOM trend means longer vacancies and softer asking-rent achievability than the comps imply.
- What's the recent tenant-quality profile in this submarket — average credit score on applications, eviction rate, late-payment / NSF rate, and stable-employment percentage? A property-management company in the area should have these aggregated.
- How much new for-sale + rental construction is in the pipeline within 1–3 miles? Heavy new supply typically softens prices + rents 12–24 months out; constrained supply supports both.
Investment metrics
- 1% rule
- 2.33% ✓
- Cap rate
- 11.26%
- Cash-on-cash
- 17.73%
- DSCR
- 1.79
- GRM
- 3.6
CMA / ARV
- ARV (median comp)
- $75,950
- List price
- $95,000
- Delta
- 25.08%
- Verdict
- OVERPRICED
- Comps
- 3 within 1.0 mi
Show comp detail 2 sales within ~0.75 mi
| Address | Dist | Beds/Ba | Sqft | Sold | Price | $/sf | Match |
|---|---|---|---|---|---|---|---|
| 11485 Branch Ln | 0.21mi | 4/2.0 | 2,280 (+8%) | 1mo | $87,000 | $38 | 76 |
| 11290 Trailing Oak | 0.10mi | 3/2.0 (-1) | 1,848 (-12%) | 9mo | $30,000 | $16 | 62 |
Match score weights: distance 35% · size 25% · config 20% · recency 20%. Top-matched comps best support the ARV.
Projected returns pro-forma
-3.0% appreciation · 3.29% rent growth · sell at horizon
- IRR
- 10.1%
- Equity multiple
- 1.40×
- Total profit
- $10,748
- Equity at exit
- $14,165
- IRR
- 19.9%
- Equity multiple
- 2.73×
- Total profit
- $46,148
- Equity at exit
- $8,214
Cash invested: $26,600 (down + closing). Projections, not guarantees.
Landlord ↔ Tenant lean methodology
- Overall (STATE)
- 73 Landlord-Friendly
- State Ohio
- 73 Landlord-Friendly · R+6
- County
- — inherits STATE
- City
- — inherits STATE
ZIP-level market 45342
- Rents YoY
- 3.3%
- Active inventory
- 113
- Price-to-rent
- 3.6×
Monthly cashflow live
- Estimated rent
- $2,215 medium interval (Pro) →
- Mortgage (P&I)
- −$498
- Tax est. 1.5%
- −$119 /mo · $1,425/yr
- Insurance
- −$40
- HOA
- −$700
- Vacancy / Maint / Mgmt
- −$465
- Net cashflow
- $393
Break-even live
UW: 25.0% down · 7.5% · 30yr · 1.5% tax · 5.0% vac · 8.0% maint · 8.0% mgmt
Financing live
Cash to close
- Down payment
- $23,750
- Closing costs
- $2,850
- Reserves months
- —
- Total cash needed
- —
Loan-product check · same deal, 3 products live
Conventional
25% down · 7.5% · 30yr
- Down + closing
- —
- Monthly P&I
- —
- Monthly cashflow
- —
- DSCR
- —
- Eligible?
- —
Personal DTI + credit; lowest rate.
DSCR
20% down · 8.5% · 30yr
- Down + closing
- —
- Monthly P&I
- —
- Monthly cashflow
- —
- DSCR
- —
- Eligible?
- —
No personal income docs; deal must DSCR.
Hard money
10% down · 12.0% · 12mo
- Down + closing
- —
- Monthly P&I
- —
- Monthly cashflow
- —
- DSCR
- —
- Eligible?
- —
Short-term bridge; refi at stabilization.
Rent comps 2 comps
| Address | Beds | Baths | Sqft | Rent | $/sqft | DOM | Units | Dist |
|---|---|---|---|---|---|---|---|---|
| 504 Brownstone Row Springboro, OH | 3.0 | 3.5 | 1800 | $2,750 | $1.53 | 44d | 1 | 0.78mi |
| 110 Teakwood Ln Springboro, OH | 3.0 | 1.5 | 1492 | $1,800 | $1.21 | 19d | 1 | 1.45mi |
HOA detail
- Monthly dues
- $700 · $8,400/yr
- Likely covers
- landscapingpool
Listing history 14 events
-
2026-06-18days on market $95,000 Active 45 DOM
-
2026-06-17days on market $95,000 Active 44 DOM
-
2026-06-16days on market $95,000 Active 43 DOM
-
2026-06-15days on market $95,000 Active 42 DOM
-
2026-06-14days on market $95,000 Active 40 DOM
-
2026-06-10days on market $95,000 Active 37 DOM
-
2026-06-09days on market $95,000 Active 36 DOM
-
2026-06-08days on market $95,000 Active 35 DOM
-
2026-06-07days on market $95,000 Active 34 DOM
-
2026-06-03days on market $95,000 Active 30 DOM
-
2026-06-02days on market $95,000 Active 29 DOM
-
2026-06-01days on market $95,000 Active 28 DOM
-
2026-05-31days on market $95,000 Active 27 DOM
-
2026-05-04$95,000 Active 439-char remark
ⓘ Source: listings_history table (triggers on properties + properties_extension) + one-shot
backfill from property_details.listing_events for pre-trigger history.
Climate risk First Street
- Flood 1/10 Low FEMA zone X (unshaded) · 0% chance over 30 yrs
- Wildfire 1/10 Low
- Heat 4/10 Moderate 7 d/yr ≥100°F today · 19 d/yr by 30 yrs out
- Wind 2/10 Low 100% chance of damaging wind over 30 yrs
- Air quality 4/10 Moderate 4 unhealthy d/yr today · 5 by 30 yrs out
Nearby sold comps map
Loading sold comps map…
Walkable amenities ~0.75 mi
Loading nearby amenities…
Taxation est. · year 1
- Rental income
- $26,575
- − Mortgage interest
- −$5,321
- − Property taxes
- −$1,425
- − Insurance
- −$475
- − Repairs & maintenance
- −$2,126
- − Management
- −$2,126
- − HOA
- −$8,400
- − Depreciation
- −$2,764
- Taxable income
- $3,938
- Est. tax owed @ 24.0%
- −$945
- After-tax cash flow
- $3,771/yr
For passive investors: Depreciation is non-cash, so a rental often shows a tax loss while cash-flowing — sheltering income. Rental losses are passive: they offset passive income freely, and up to $25,000/yr can offset ordinary (W-2) income if you actively participate and your MAGI is under $100k (phasing out to $0 by $150k); unused losses carry forward. On sale, claimed depreciation is recaptured at up to 25%, and gains may owe capital-gains tax (a 1031 exchange can defer both). Figures are a year-1 estimate at your 24.0% rate — not tax advice; consult a CPA.
Condition & rehab AI · 30 photos
This home is in fair condition with moderate repairs needed, particularly in the kitchen and bathrooms. Upgrading the paint, cabinets, and landscaping can significantly increase its value.
Repairs flagged
- Moderate Kitchen cabinets — The cabinets appear dated and may need updating or replacement.
- Moderate Bathroom fixtures — The fixtures in the bathrooms appear outdated and may need replacement.
- Moderate Paint — The interior walls and possibly the exterior could benefit from fresh paint to improve the overall appearance.
- Minor Landscaping — The landscaping is simple and could be improved with some additional plants and features to enhance curb appeal.
Value-add opportunities
- Both Painting the interior and exterior — Fresh paint can improve the overall appearance and value of the home.
- Both Updating the kitchen cabinets and fixtures — Modernizing the kitchen can increase both resale and rental value.
- Both Landscaping improvements — Enhancing the landscaping can improve curb appeal and potentially increase the home's value.
- Rental HVAC maintenance — A well-maintained HVAC system can attract tenants and improve rental value.
Renovation cost estimate screening
| Repair item | Severity | Est. cost |
|---|---|---|
| Kitchen cabinets · The cabinets appear dated and may need updating or replacement. | Moderate | $3,000–15,000 |
| Bathroom fixtures · The fixtures in the bathrooms appear outdated and may need replacement. | Moderate | $3,000–15,000 |
| Paint · The interior walls and possibly the exterior could benefit from fresh paint to improve the overall appearance. | Moderate | $3,000–15,000 |
| Landscaping · The landscaping is simple and could be improved with some additional plants and features to enhance curb appeal. | Minor | $500–3,000 |
| Total estimated repair cost · 4 items | $9,500–48,000 |
Value-add ROI direction
- Both Painting the interior and exterior — Fresh paint can improve the overall appearance and value of the home. ↑
- Both Updating the kitchen cabinets and fixtures — Modernizing the kitchen can increase both resale and rental value. ↑
- Both Landscaping improvements — Enhancing the landscaping can improve curb appeal and potentially increase the home's value. ↑
- Rental HVAC maintenance — A well-maintained HVAC system can attract tenants and improve rental value. ↑
ⓘ Cost ranges are severity-bucket heuristics (US national rule-of-thumb). Get contractor quotes + a written scope before underwriting a rehab budget.
Schools (NCES district)
- District
- Miamisburg City
- NCES district ID
- 3904439
- Math proficiency
- 52% ▼ -13.00%
- Reading proficiency
- 61% ▼ -7.00%
- Median HH income
- $53,394
- Composite
- 48.47/100
- National rank
- #2128
- State rank
- #338 of 656 in OH
Livability — Springboro
- Score
- 81/100
- State rank
- #93
- US rank
- #1395
Category grades
Schools grade is shown separately in the Schools card above.
Census & demographics
- County
- Montgomery County · 459,541 people
- City population
- 27,545
- Metro
- Dayton-Kettering, OH
- Population (ZIP)
- 36,152
- Household income
- $84,907
- Rent vs Own
- Severe rent burden
- 790.0
Population outlook (Montgomery County) Hauer SSP2
- Today (2025)
- 523,241 people
- By 2030
- 514,948 · -1.6%
- By 2040
- 493,378 · -5.7%
- By 2050
- 469,639 · -10.2%
- By 2075
- 418,360 · -20.0%
- By 2100
- 353,315 · -32.5%
Race, ethnicity, and origin ACS 2023
- Neighborhood character
- Predominantly White (83%)
- Race & ethnicity
- White 83% Black 6% Two or more races 4% Asian 4% Hispanic / Latino 3%
- Common ancestry
- Slovak 2% Italian 2% Serbian 2%
- Foreign-born
- 6% · Canada, China
- Languages at home
- 93% English-only · Other Asian/Pacific 3% Spanish 2% Other Indo-European 1%
Political lean MEDSL · Montgomery
- 2024 margin
- Toss-up / Even · D 49.8% · R 49.3%
- 2008→2024 swing
- -5.8pp toward R · 2008: 6.2pp · 2024: 0.5pp
- All cycles
- 2024: D+0.5 2020: D+2.2 2016: R+1.2 2012: D+3.1 2008: D+6.2
Not yet ingested
- Civics
- —
Market trends
- HPI YoY
- ▼ -183.01%
- Current HPI
- 227.3999
- Rent YoY
- ▲ 3.29%
- Metro
- Dayton-Kettering, OH
- State GDP YoY
- ▲ 1.98%
- F500 in state
- 48
Industry mix (Fortune 500 HQ in OH)
| Industry | F500 HQs | Revenue |
|---|---|---|
| Insurance | 3 | $145B |
|
||
| Industrial Machinery | 3 | $49B |
|
||
| Financial Services | 3 | $24B |
|
||
| Consumer Goods | 2 | $93B |
|
||
| Aerospace / Defense | 2 | $47B |
|
||
| Utilities | 2 | $33B |
|
||
Price history
1 event — show timeline
- 2026-05-04 Listed $95,000 Dayton MLS
Cash-flow waterfall
monthlySold comps — $/sqft
last 12 mo · ≤1 miLoading sold comps…