1684 Gale Dr · Pelican Bay, TX
Flood risk 1/10 · Minimal
- FEMA flood zone
- X (unshaded)
- Chance of flooding over 30 yrs
- 0.0%
- Est. flood insurance / yr
- $507 – $1,088
Fire risk 4/10 · Minor
- Est. fire insurance / yr
- $1,222 – $2,270
Heat risk 7/10 · Major
- Hot days now (above 110°F)
- 7 days/yr
- Hot days in 30 yrs
- 22 days/yr
Wind risk 6/10 · Moderate
- Chance of severe wind over 30 yrs
- 27.0%
Air-quality risk 2/10 · Minimal
- Unhealthy air days now
- 2 days/yr
- Unhealthy air days in 30 yrs
- 2 days/yr
Risk factors via First Street. Map © Google.
Why this score? — see what drove the C- grade
The composite is a weighted blend of 9 inputs, each scored 0–100. Each bar is that input's sub-score; the figure is the points it added to the 100-point composite (weight × sub-score).
- Cash flow +25.6/30.0
- DSCR +8.5/10.0
- 1% rule +5.9/10.0
- Schools +3.6/10.0
- Rent growth +3.1/5.0
- Livability +3.1/5.0
- Condition / age +2.5/5.0
- ARV discount +2.4/15.0
- Appreciation +0.0/10.0
$140,000
🖨 Deal sheet (PDF) 📄 Offer letter ✓ Due diligence
Listing remarks MLS
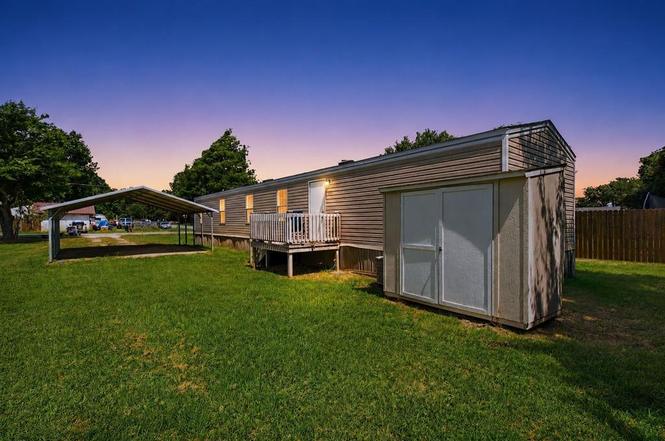
Perfect lot for your mobile! . 1688 of an acre. .. With Septic!!!! Go and Show!!
Key facts
- 2 car carport
- Storage shed
- Lake access
Tags
Property features AI
Finance
- Other: Property is residential, not attached, no accessory unit; Lot approximately 0.169 acre (less than 0.5 acre); Subdivision: Pelican Bay Tenth Filing
- Financial info: Accepts Cash, Conventional, FHA, and VA financing; Treat as clear loan type; No second mortgage
- HOA & community: No association
Exterior
- Parking: Covered carport (2 spaces)
- Security: Fire alarm
- Utilities: City water; City sewer; Electricity connected; Cable available
- Home design: Manufactured home; Single-story
- Construction: Built in 2014; Vinyl siding; Asphalt roof
- Exterior features: Deck; Cleared lot with few trees
Interior
- Kitchen: Built-in cabinets; Eat-in kitchen; Electric range; Dishwasher; Refrigerator; Electric water heater
- Bedrooms: 3 bedrooms (all on level 1)
- Flooring: Carpet; Vinyl
- Bathrooms: 2 full bathrooms
- Heating & cooling: Electric heating; Central air conditioning; Electric cooling components
- Interior features: Open floorplan; Eat-in kitchen; One living area; One dining area; Room count: 4
- Laundry & utility: Full-size washer/dryer area; Washer hookup; Electric dryer hookup; Utility room
Neighborhood map
What this means for you Summary
Snapshot
- This is a 3-bed/2.0-bath manufactured listed at $140k.
Deal economics
- At list price, monthly cash flow is $333 ($4k/yr) — positive.
- The deal already cash-flows at list — no discount required.
- Meets the 1% rule at list price ($2k rent vs $140k).
- Cap rate 9.1% vs local median 6.4% in Pelican Bay — top-decile yield for the area; either an underpriced asset or a hidden risk that comps aren't pricing in. Stress-test before assuming the spread holds.
Location & tenants
- Location reads 62/100 on livability (#917 in TX) — a middle-class / working-renter tenant base. Strengths: cost of living A+, housing A+, crime A; Watch: health & safety D+, schools F, amenities F.
- Azle ISD (suburban): math 37% / reading 43% proficiency, ranked #351 of 826 in TX (top 42%) — families likely to look elsewhere, expect single-tenant / working-renter base with shorter leases.
- Market conditions: Rents rising (+2.3%/yr); 596 active listings in the ZIP; 5 comparable units currently listed for rent nearby; rentals at typical pace (median 23d on market — plan ~3-4 weeks tenant-placement turnaround); solid renter incomes; 18,938 units permitted in Tarrant County in 2024 (8,336 in 5+ unit buildings).
Forward outlook
- Local home prices are declining (-3.0%/yr); year-one equity from $968 of loan paydown is wiped out by about $4k of value loss. Plan a longer hold.
- Tarrant County population projected at +41% by 2050 — long-run rental-demand tailwind backs the buy-and-hold thesis.
Negotiation context
- Only 3 days on market — expect competitive offers; lowballing is unlikely to land.
- 2 sale attempts since 12y ago with the ask held roughly flat each time — persistent listings suggest the price (not the market) is what's stuck; bring a comps-based counter.
- Current owner paid $9k; list at $140k implies a 1402% gain — meaningful room to come down on a strong offer.
Risks & watch-outs
- Climate carrying-cost: major wind risk, 27% chance of damaging wind over 30y; extreme-heat days projected 7→22/yr by 2055 (HVAC capex compounding) — expect insurance premiums to compound above CPI over the hold.
Questions for the listing agent
- Is there a deadline driving the sale (1031 exchange, divorce, estate, relocation)? That informs how much negotiation room exists.
- Schools are F-rated, which usually means shorter tenancies and higher turnover. Who's the typical renter profile here, and what's been the actual vacancy rate?
- What's the average days-on-market for RENTAL listings here right now (not sales)? A rising rental-DOM trend means longer vacancies and softer asking-rent achievability than the comps imply.
- What's the recent tenant-quality profile in this submarket — average credit score on applications, eviction rate, late-payment / NSF rate, and stable-employment percentage? A property-management company in the area should have these aggregated.
- How much new for-sale + rental construction is in the pipeline within 1–3 miles? Heavy new supply typically softens prices + rents 12–24 months out; constrained supply supports both.
Investment metrics
- 1% rule
- 1.09% ✓
- Cap rate
- 9.15%
- Cash-on-cash
- 10.19%
- DSCR
- 1.45
- GRM
- 7.6
CMA / ARV
- ARV (on-the-fly)
- $125,664
- Comps found
- 5
Show comp detail 5 sales within ~0.75 mi
| Address | Dist | Beds/Ba | Sqft | Sold | Price | $/sf | Match |
|---|---|---|---|---|---|---|---|
| 1800 Pelican NONE E | 0.13mi | 2/1.0 (-1) | 840 (-9%) | 11mo | $114,000 | $136 | 61 |
| 1509 Pelican Dr N | 0.36mi | 2/2.0 (-1) | 840 (-9%) | 8mo | $115,000 | $137 | 57 |
| 1813 Gale Dr | 0.15mi | 4/3.0 (+1) | 1,024 (+11%) | 11mo | $120,000 | $117 | 57 |
| 1404 Dawn Dr N | 0.52mi | 2/1.5 (-1) | 980 (+6%) | 7mo | $70,000 | $71 | 53 |
| 1225 Trails End St | 0.60mi | 2/2.0 (-1) | 1,056 (+14%) | 23mo | $163,900 | $155 | 24 |
Match score weights: distance 35% · size 25% · config 20% · recency 20%. Top-matched comps best support the ARV.
Projected returns pro-forma
-3.0% appreciation · 2.31% rent growth · sell at horizon
- IRR
- -1.8%
- Equity multiple
- 0.93×
- Total profit
- $-2,577
- Equity at exit
- $20,874
- IRR
- 7.2%
- Equity multiple
- 1.53×
- Total profit
- $20,647
- Equity at exit
- $12,105
Cash invested: $39,200 (down + closing). Projections, not guarantees.
Landlord ↔ Tenant lean methodology
- Overall (STATE)
- 87 Strongly Landlord-Friendly
- State Texas
- 87 Strongly Landlord-Friendly · R+5
- County
- — inherits STATE
- City
- — inherits STATE
ZIP-level market 76020
- Home prices YoY
- -20.6%
- Rents YoY
- 2.3%
- Active inventory
- 596
- Price-to-rent
- 7.6×
Monthly cashflow live
- Estimated rent
- $1,531 high interval (Pro) →
- Mortgage (P&I)
- −$734
- Tax from tax record
- −$85 /mo · $1,014/yr
- Insurance
- −$58
- HOA
- −$0
- Vacancy / Maint / Mgmt
- −$322
- Net cashflow
- $333
Break-even live
Sensitivity live
| Price | -10% $412 | -5% $372 | +0% $333 | +5% $293 | +10% $254 |
|---|---|---|---|---|---|
| Rent | -10% $212 | -5% $272 | +0% $333 | +5% $393 | +10% $454 |
| Rate | -1.0pp $403 | -0.5pp $368 | base $333 | +0.5pp $297 | +1.0pp $260 |
UW: 25.0% down · 7.5% · 30yr · 1.5% tax · 5.0% vac · 8.0% maint · 8.0% mgmt
Financing live
Cash to close
- Down payment
- $35,000
- Closing costs
- $4,200
- Reserves months
- —
- Total cash needed
- —
Loan-product check · same deal, 3 products live
Conventional
25% down · 7.5% · 30yr
- Down + closing
- —
- Monthly P&I
- —
- Monthly cashflow
- —
- DSCR
- —
- Eligible?
- —
Personal DTI + credit; lowest rate.
DSCR
20% down · 8.5% · 30yr
- Down + closing
- —
- Monthly P&I
- —
- Monthly cashflow
- —
- DSCR
- —
- Eligible?
- —
No personal income docs; deal must DSCR.
Hard money
10% down · 12.0% · 12mo
- Down + closing
- —
- Monthly P&I
- —
- Monthly cashflow
- —
- DSCR
- —
- Eligible?
- —
Short-term bridge; refi at stabilization.
Rent comps 5 comps
| Address | Beds | Baths | Sqft | Rent | $/sqft | DOM | Units | Dist |
|---|---|---|---|---|---|---|---|---|
| 1920 Reef Ct Azle, TX | 3.0 | 2.0 | 1090 | $1,449 | $1.33 | 45d | 1 | 0.37mi |
| 1620 Mockingbird Ln Azle, TX | 3.0 | 2.0 | 1090 | $1,499 | $1.38 | 22d | 1 | 0.46mi |
| 1329 Fox Hollow Ct Azle, TX | 2.0 | 1.0 | 924 | $900 | $0.97 | 7d | 1 | 0.62mi |
| 11124 Liberty School Rd Unit 24B Azle, TX | 2.0 | 2.0 | 700 | $999 | $1.43 | 23d | 1 | 0.72mi |
| 11128 Liberty School Rd Unit 28A Azle, TX | 2.0 | 2.0 | 700 | $1,050 | $1.50 | 25d | 1 | 0.73mi |
Listing history 3 events
-
2026-06-21days on market $140,000 Active 3 DOM
-
2026-06-18remarks 699-char remark
-
2026-06-18$140,000 Active 1 DOM
ⓘ Source: listings_history table (triggers on properties + properties_extension) + one-shot
backfill from property_details.listing_events for pre-trigger history.
Tax reassessment forecast TX · Resets to sale price
- Current annual tax
- $1,014 · $85/mo
- Projected year-2 tax
- $2,562 · $214/mo
- Expected delta
- +$1,548/yr (+$129/mo · 152.7%)
ⓘ Screening estimate from a state-policy table — verify with the county assessor before closing.
Climate risk First Street
- Flood 1/10 Low FEMA zone X (unshaded) · 0% chance over 30 yrs
- Wildfire 4/10 Moderate
- Heat 7/10 Severe 7 d/yr ≥110°F today · 22 d/yr by 30 yrs out
- Wind 6/10 Major 27% chance of damaging wind over 30 yrs
- Air quality 2/10 Low 2 unhealthy d/yr today · 2 by 30 yrs out
Nearby sold comps map
Loading sold comps map…
Walkable amenities ~0.75 mi
Loading nearby amenities…
Taxation est. · year 1
- Rental income
- $18,377
- − Mortgage interest
- −$7,842
- − Property taxes
- −$1,014
- − Insurance
- −$700
- − Repairs & maintenance
- −$1,470
- − Management
- −$1,470
- − Depreciation
- −$4,073
- Taxable income
- $1,808
- Est. tax owed @ 24.0%
- −$434
- After-tax cash flow
- $3,560/yr
For passive investors: Depreciation is non-cash, so a rental often shows a tax loss while cash-flowing — sheltering income. Rental losses are passive: they offset passive income freely, and up to $25,000/yr can offset ordinary (W-2) income if you actively participate and your MAGI is under $100k (phasing out to $0 by $150k); unused losses carry forward. On sale, claimed depreciation is recaptured at up to 25%, and gains may owe capital-gains tax (a 1031 exchange can defer both). Figures are a year-1 estimate at your 24.0% rate — not tax advice; consult a CPA.
Schools (NCES district)
- District
- Azle ISD
- NCES district ID
- 4809200
- Math proficiency
- 37% ▼ -11.00%
- Reading proficiency
- 43% ▼ -5.00%
- Median HH income
- $61,473
- Composite
- 35.57/100
- National rank
- #4900
- State rank
- #351 of 826 in TX
Livability — Pelican Bay
- Score
- 62/100
- State rank
- #917
- US rank
- #16376
Category grades
Schools grade is shown separately in the Schools card above.
Census & demographics
- County
- Parker County · 144,797 people
- Metro
- Dallas-Fort Worth-Arlington, TX
- Population (ZIP)
- 34,602
- Household income
- $87,298
- Rent vs Own
- Severe rent burden
- 433.0
Population outlook (Tarrant County) Hauer SSP2
- Today (2025)
- 2,380,417 people
- By 2030
- 2,578,900 · +8.3%
- By 2040
- 2,974,995 · +25.0%
- By 2050
- 3,350,489 · +40.8%
- By 2075
- 4,216,909 · +77.2%
- By 2100
- 4,741,527 · +99.2%
Race, ethnicity, and origin ACS 2023
- Neighborhood character
- Predominantly White (78%)
- Race & ethnicity
- White 78% Hispanic / Latino 18% Two or more races 9% Black 1%
- Hispanic origin (detail)
- Mexican 15%
- Common ancestry
- Slovak 2% Italian 1% Portuguese 1%
- Foreign-born
- 5% · Canada
- Languages at home
- 89% English-only · Spanish 11%
Political lean MEDSL · Tarrant
- 2024 margin
- Lean R (+5.1) · D 46.7% · R 51.9% · Other 1.4%
- 2008→2024 swing
- +6.6pp toward D · 2008: -11.7pp · 2024: -5.1pp
- All cycles
- 2024: R+5.1 2020: D+0.2 2016: R+8.7 2012: R+15.7 2008: R+11.7
Not yet ingested
- Civics
- —
Market trends
- HPI YoY
- ▼ -74.72%
- Current HPI
- 287.155
- Rent YoY
- ▲ 2.31%
- Metro
- Dallas-Fort Worth-Arlington, TX
- State GDP YoY
- ▲ 3.95%
- F500 in state
- 110
Industry mix (Fortune 500 HQ in TX)
| Industry | F500 HQs | Revenue |
|---|---|---|
| Energy | 16 | $1,198B |
|
||
| Technology | 5 | $198B |
|
||
| Engineering / Construction | 4 | $72B |
|
||
| Energy Services | 3 | $60B |
|
||
| Utilities | 3 | $41B |
|
||
| Healthcare | 2 | $330B |
|
||
Price history
+1402.0% since first listed9 events — show timeline
- 2026-06-12 Listed $140,000 NTREIS
- 2015-08-07 Sold (Public Records) — Public Records
- 2014-07-28 Sold (Public Records) — Public Records
- 2014-07-25 Sold (MLS) — NTREIS
- 2014-07-22 Pending — NTREIS
- 2014-07-08 Pending — NTREIS
- 2014-06-08 Listed $5,000 NTREIS
- 1998-03-04 Sold (Public Records) $9,321 Public Records
- 1994-01-01 Sold (Public Records) — Public Records
Property tax history
+11.7%/yrLatest (2025): $1,014 · +1.3% YoY. Source: county tax records.
Cash-flow waterfall
monthlySold comps — $/sqft
last 12 mo · ≤1 miLoading sold comps…