 Duplex
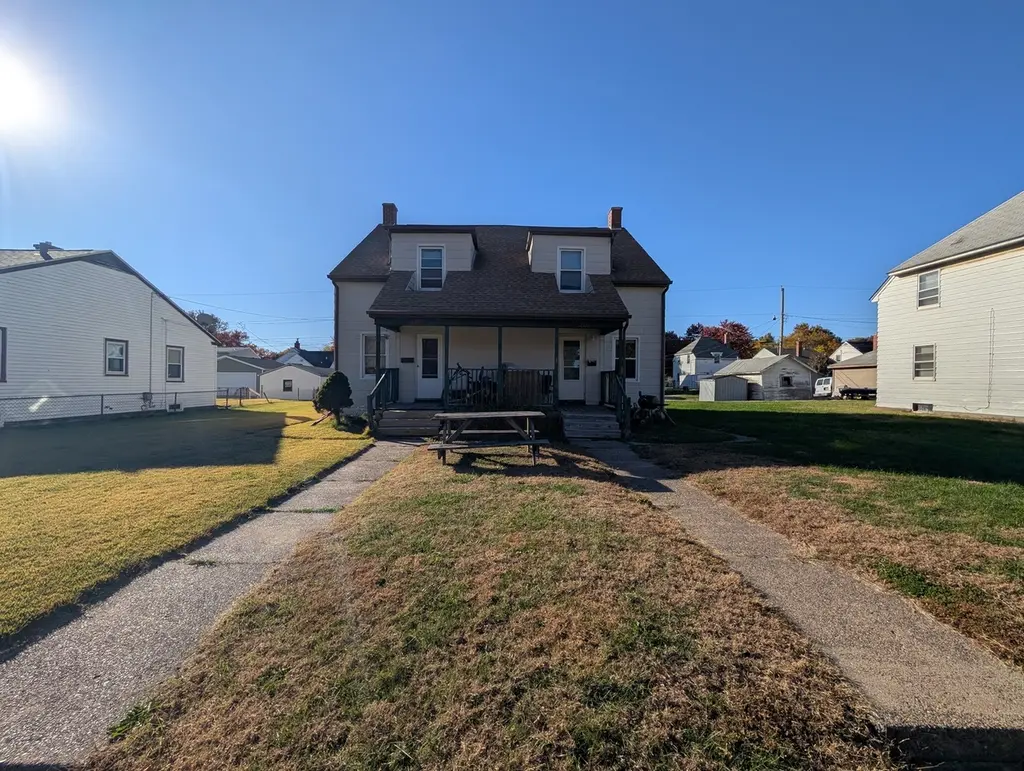
222 S Elmwood Ave · Davenport, IA
Flood risk 1/10 · Minimal
- FEMA flood zone
- X (unshaded)
- Chance of flooding over 30 yrs
- 0.0%
- Est. flood insurance / yr
- $473 – $860
Fire risk 3/10 · Minor
- Est. fire insurance / yr
- $902 – $1,676
Heat risk 3/10 · Minor
- Hot days now (above 104°F)
- 7 days/yr
- Hot days in 30 yrs
- 16 days/yr
Wind risk 2/10 · Minimal
- Chance of severe wind over 30 yrs
- —
Air-quality risk 3/10 · Minor
- Unhealthy air days now
- 2 days/yr
- Unhealthy air days in 30 yrs
- 3 days/yr
Risk factors via First Street. Map © Google.
Why this score? — see what drove the B grade
The composite is a weighted blend of 9 inputs, each scored 0–100. Each bar is that input's sub-score; the figure is the points it added to the 100-point composite (weight × sub-score).
- Cash flow +30.0/30.0
- ARV discount +11.0/15.0
- 1% rule +10.0/10.0
- DSCR +10.0/10.0
- Livability +4.0/5.0
- Schools +3.9/10.0
- Rent growth +2.5/5.0
- Condition / age +2.5/5.0
- Appreciation +0.0/10.0
$115,000
🖨 Deal sheet (PDF) 📄 Offer letter ✓ Due diligence
Multi-family units
County records classify this as Multi-Family (2-4 Unit). Listing-text estimate: 2 units. confirmed
Listing remarks
turnkey duplex across the street from a park! Both units are 2 bed 1 bath with full unfinished basements that work great as additional space. Convenient off street parking available from the back alley access. One unit is currently occupied and renting for $795/month. The other is ready for its next tenant. Tenant's pay all utilities. 48hr notice required.
Key facts
- Off street parking
- Turnkey duplex
- Back alley access
Tags
Property features AI
Finance
- Financial info: Two-unit building; Unit 1 rent $795 (security deposit $795) — lease through May 1, 2026; Unit 2 rent $750 (security deposit $750) — lease date listed (Dec 1, 1999) — tenant pays all utilities
Exterior
- Parking: 2 parking spaces
- Utilities: Public water; Public sewer
- Home design: Two-to-four unit property; Over 100 years old; Built before 1978
- Construction: Shake siding exterior; Asphalt roof; Block foundation
- Exterior features: Level lot; Lot dimensions approximately 80 x 110
Interior
- Kitchen: Stove; Refrigerator
- Bedrooms: 4 bedrooms total; Each unit has 2 bedrooms (two 2-bedroom units)
- Bathrooms: 2 full bathrooms total
- Heating & cooling: Natural gas heating; Forced air
- Interior features: 10 total rooms; Unfinished full basement
- Laundry & utility: Tenant pays all utilities
Neighborhood map
What this means for you Summary
Snapshot
- This is a 2 × 2-bed/1-bath units multifamily listed at $115k.
Deal economics
- At list price, monthly cash flow is $603 ($7k/yr) — positive. Per door: $302/mo.
- The deal already cash-flows at list — no discount required.
- Meets the 1% rule at list price ($2k rent vs $115k).
- Recommended offer: $112k (3.0% below list) — sets the bar for market timing.
- Cap rate 12.6% vs local median 4.4% in Davenport — top-decile yield for the area; either an underpriced asset or a hidden risk that comps aren't pricing in. Stress-test before assuming the spread holds.
Location & tenants
- Location reads 79/100 on livability (#126 in IA, #2,312 nationally) — a middle-class / working-renter tenant base. Strengths: cost of living A+, housing A+, health & safety A+; Watch: employment C-, crime F.
- Davenport Community School District (urban): math 43% / reading 50% proficiency, ranked #288 of 289 in IA (top 100%) — families likely to look elsewhere, expect single-tenant / working-renter base with shorter leases.
- Zoned schools: Hayes Elementary School (math 41% / reading 46%, grade F, #560 of 616 statewide, top 91%, 339 students, 60% FRL); Frank L Smart Intermediate (math 27% / reading 30%, grade F, #246 of 246 statewide, top 100%, 313 students, 71% FRL); West High School (math 38% / reading 53%, grade D-, #323 of 336 statewide, top 96%, 1,469 students, 54% FRL).
- Market conditions: 67 active listings in the ZIP; 4 comparable units currently listed for rent nearby; rentals lingering (median 45d on market — plan ~5-8 weeks vacancy on turnover, expect pricing pressure); 50% of comp listings sitting > 30 days — soft ceiling on asking rent; 805 units permitted in Scott County in 2024 (479 in 5+ unit buildings).
- This rent runs 39% of the median local income ($54k/yr) — at the standard rent-burdened threshold; future hikes will face affordability resistance.
Forward outlook
- Local home prices are declining (-3.0%/yr); year-one equity from $795 of loan paydown is wiped out by about $3k of value loss. Plan a longer hold.
- Scott County population projected at +19% by 2050 — long-run rental-demand tailwind backs the buy-and-hold thesis.
- At projected returns (-3.0% appreciation + 3.0% rent growth), your $32k cash investment doubles in ~6 years — after that, you're playing with house money.
Negotiation context
- It's been on market 52 days — a 3% lower offer ($112k) is reasonable based on typical stale-listing flexibility.
- Current owner paid $76k; list at $115k implies a 51% gain — meaningful room to come down on a strong offer.
Risks & watch-outs
- Watch-outs: built in 1918 — expect roof / HVAC / electrical / plumbing capex.
Questions for the listing agent
- It's been on market 52 days. Have you received any prior offers? Is the seller open to a 3% concession, seller financing, or rate buy-down credit?
- Can we see the unit-by-unit rent roll, current vacancy, and any below-market leases? What's the average tenancy length?
- What capital expenditures (roof, boiler, parking lot, exteriors) have been made in the last 5 years, and what's planned in the next 2?
- Built in 1918 — when were the roof, HVAC, electrical panel, plumbing, and water heater last replaced?
- Is there a deadline driving the sale (1031 exchange, divorce, estate, relocation)? That informs how much negotiation room exists.
- Crime grade is F in this area — have there been break-ins, vandalism, or insurance claims at this property in the last 3 years? What carrier currently insures it and at what premium?
- What's the average days-on-market for RENTAL listings here right now (not sales)? A rising rental-DOM trend means longer vacancies and softer asking-rent achievability than the comps imply.
- What's the recent tenant-quality profile in this submarket — average credit score on applications, eviction rate, late-payment / NSF rate, and stable-employment percentage? A property-management company in the area should have these aggregated.
- How much new apartment / multifamily construction is in the pipeline within 1–3 miles? Heavy new supply (>2% of stock underway) typically softens rents 12–24 months out; light construction supports rent growth.
Investment metrics
- 1% rule
- 1.54% ✓
- Cap rate
- 12.59%
- Cash-on-cash
- 22.48%
- DSCR
- 2.00
- GRM
- 5.4
CMA / ARV
- ARV (median comp)
- $124,651
- List price
- $115,000
- Delta
- -7.74%
- Verdict
- FAIR
- Comps
- 20 within 1.0 mi
Projected returns pro-forma
-3.0% appreciation · 3.0% rent growth · sell at horizon
- IRR
- 15.3%
- Equity multiple
- 1.62×
- Total profit
- $19,816
- Equity at exit
- $17,147
- IRR
- 24.0%
- Equity multiple
- 3.08×
- Total profit
- $66,835
- Equity at exit
- $9,943
Cash invested: $32,200 (down + closing). Projections, not guarantees.
Landlord ↔ Tenant lean methodology
- Overall (STATE)
- 83 Strongly Landlord-Friendly
- State Iowa
- 83 Strongly Landlord-Friendly · R+6
- County
- — inherits STATE
- City
- — inherits STATE
ZIP-level market 52802
- Home prices YoY
- -28.3%
- Active inventory
- 67
- Price-to-rent
- 10.9×
Monthly cashflow live
- Estimated rent
- $1,766 high interval (Pro) →
- Mortgage (P&I)
- −$603
- Tax from tax record
- −$141 /mo · $1,690/yr
- Insurance
- −$48
- HOA
- −$0
- Vacancy / Maint / Mgmt
- −$371
- Net cashflow
- $603
Break-even live
Sensitivity live
| Price | -10% $668 | -5% $636 | +0% $603 | +5% $571 | +10% $538 |
|---|---|---|---|---|---|
| Rent | -10% $464 | -5% $534 | +0% $603 | +5% $673 | +10% $743 |
| Rate | -1.0pp $661 | -0.5pp $633 | base $603 | +0.5pp $574 | +1.0pp $543 |
2-unit breakdown (identical units grouped — click to expand)
| Units | Beds | Baths | Est. rent |
|---|---|---|---|
| 2× units | 2 | 1 | $1,766 |
| #1 | 2 | 1 | $883 |
| #2 | 2 | 1 | $883 |
| Total (2 units) | $1,766 | ||
UW: 25.0% down · 7.5% · 30yr · 1.5% tax · 5.0% vac · 8.0% maint · 8.0% mgmt
Financing live
Cash to close
- Down payment
- $28,750
- Closing costs
- $3,450
- Reserves months
- —
- Total cash needed
- —
Loan-product check · same deal, 3 products live
Conventional
25% down · 7.5% · 30yr
- Down + closing
- —
- Monthly P&I
- —
- Monthly cashflow
- —
- DSCR
- —
- Eligible?
- —
Personal DTI + credit; lowest rate.
DSCR
20% down · 8.5% · 30yr
- Down + closing
- —
- Monthly P&I
- —
- Monthly cashflow
- —
- DSCR
- —
- Eligible?
- —
No personal income docs; deal must DSCR.
Hard money
10% down · 12.0% · 12mo
- Down + closing
- —
- Monthly P&I
- —
- Monthly cashflow
- —
- DSCR
- —
- Eligible?
- —
Short-term bridge; refi at stabilization.
Rent comps 4 comps
| Address | Beds | Baths | Sqft | Rent | $/sqft | DOM | Units | Dist |
|---|---|---|---|---|---|---|---|---|
| 301 S Thornwood Ave Davenport, IA | 3.0 | 1.0 | 1242 | $1,395 | $1.12 | 15d | 1 | 0.00mi |
| 2424 Telegraph Rd Davenport, IA | 4.0 | 2.0 | 2000 | $1,750 | $0.88 | 45d | 1 | 0.29mi |
| 1912 Dixwell St Davenport, IA | 4.0 | 2.0 | 1116 | $1,300 | $1.16 | 45d | 1 | 0.55mi |
| 1716 W 7th St Davenport, IA | 4.0 | 1.0 | 1278 | $1,712 | $1.34 | 15d | 1 | 1.01mi |
Listing history 20 events
-
2026-06-21days on market $115,000 Active 52 DOM
-
2026-06-18days on market $115,000 Active 49 DOM
-
2026-06-17days on market $115,000 Active 48 DOM
-
2026-06-16days on market $115,000 Active 47 DOM
-
2026-06-15days on market $115,000 Active 46 DOM
-
2026-06-14days on market $115,000 Active 44 DOM
-
2026-06-13days on market $115,000 Active 43 DOM
-
2026-06-10days on market $115,000 Active 41 DOM
-
2026-06-09days on market $115,000 Active 40 DOM
-
2026-06-08days on market $115,000 Active 39 DOM
-
2026-06-07days on market $115,000 Active 38 DOM
-
2026-06-03days on market $115,000 Active 34 DOM
-
2026-06-02days on market $115,000 Active 33 DOM
-
2026-06-01days on market $115,000 Active 32 DOM
-
2026-05-31days on market $115,000 Active 31 DOM
-
2026-05-30days on market $115,000 Active 30 DOM
-
2026-04-30$115,000 Active 361-char remark
-
2021-08-06historical
-
2021-03-03soldstatus $76,000
-
2008-02-08historical
ⓘ Source: listings_history table (triggers on properties + properties_extension) + one-shot
backfill from property_details.listing_events for pre-trigger history.
Tax reassessment forecast IA · Partial reset (capped growth)
- Current annual tax
- $1,690 · $141/mo
- Projected year-2 tax
- $1,748 · $146/mo
- Expected delta
- +$58/yr (+$5/mo · 3.4%)
ⓘ Screening estimate from a state-policy table — verify with the county assessor before closing.
Climate risk First Street
- Flood 1/10 Low FEMA zone X (unshaded) · 0% chance over 30 yrs
- Wildfire 3/10 Moderate
- Heat 3/10 Moderate 7 d/yr ≥104°F today · 16 d/yr by 30 yrs out
- Wind 2/10 Low
- Air quality 3/10 Moderate 2 unhealthy d/yr today · 3 by 30 yrs out
Nearby sold comps map
Loading sold comps map…
Walkable amenities ~0.75 mi
Loading nearby amenities…
Taxation est. · year 1
- Rental income
- $21,192
- − Mortgage interest
- −$6,442
- − Property taxes
- −$1,690
- − Insurance
- −$575
- − Repairs & maintenance
- −$1,695
- − Management
- −$1,695
- − Depreciation
- −$3,345
- Taxable income
- $5,749
- Est. tax owed @ 24.0%
- −$1,380
- After-tax cash flow
- $5,860/yr
For passive investors: Depreciation is non-cash, so a rental often shows a tax loss while cash-flowing — sheltering income. Rental losses are passive: they offset passive income freely, and up to $25,000/yr can offset ordinary (W-2) income if you actively participate and your MAGI is under $100k (phasing out to $0 by $150k); unused losses carry forward. On sale, claimed depreciation is recaptured at up to 25%, and gains may owe capital-gains tax (a 1031 exchange can defer both). Figures are a year-1 estimate at your 24.0% rate — not tax advice; consult a CPA.
Schools (NCES district)
- District
- Davenport Community School District
- NCES district ID
- 1908580
- Math proficiency
- 43% ▼ -11.00%
- Reading proficiency
- 50% ▼ -3.00%
- Median HH income
- $46,157
- Composite
- 39.49/100
- National rank
- #3951
- State rank
- #288 of 289 in IA
Livability — Davenport
- Score
- 79/100
- State rank
- #126
- US rank
- #2312
Category grades
Schools grade is shown separately in the Schools card above.
Census & demographics
- Census place
- Davenport, IA
- County
- Scott County · 144,583 people
- City population
- 103,319
- Metro
- Davenport-Moline-Rock Island, IA-IL
- Population (ZIP)
- 9,466
- Household income
- $54,380
- Rent vs Own
- Severe rent burden
- 244.0
Population outlook (Scott County) Hauer SSP2
- Today (2025)
- 188,878 people
- By 2030
- 196,648 · +4.1%
- By 2040
- 210,860 · +11.6%
- By 2050
- 224,359 · +18.8%
- By 2075
- 258,884 · +37.1%
- By 2100
- 286,447 · +51.7%
Race, ethnicity, and origin ACS 2023
- Neighborhood character
- Predominantly White (71%)
- Race & ethnicity
- White 71% Hispanic / Latino 14% Two or more races 10% Black 5% Asian 1%
- Hispanic origin (detail)
- Mexican 13%
- Common ancestry
- Romanian 2% Lithuanian 1% Italian 1%
- Foreign-born
- 4% · Canada, Vietnam
- Languages at home
- 92% English-only · Spanish 7%
Political lean MEDSL · Scott
- 2024 margin
- Toss-up / Even · D 47.3% · R 51.2% · Other 1.4%
- 2008→2024 swing
- -18.4pp toward R · 2008: 14.6pp · 2024: -3.9pp
- All cycles
- 2024: R+3.9 2020: D+3.5 2016: D+1.4 2012: D+13.8 2008: D+14.6
Not yet ingested
- Civics
- —
Market trends
- HPI YoY
- ▼ -59.59%
- Current HPI
- 151.2076
- Rent YoY
- —
- Metro
- Davenport-Moline-Rock Island, IA-IL
- State GDP YoY
- ▲ 2.48%
- F500 in state
- 4
Industry mix (Fortune 500 HQ in IA)
| Industry | F500 HQs | Revenue |
|---|---|---|
| Financial Services | 1 | $16B |
|
||
| Retail / Convenience | 1 | $15B |
|
||
Price history
+51.3% since first listed4 events — show timeline
- 2026-04-30 Listed $115,000 MRED as Distributed by MLS Grid
- 2021-08-06 Listing Removed — RMLSA as Distributed by MLS Grid
- 2021-03-03 Sold (Public Records) $76,000 Public Records
- 2008-02-08 Listing Removed — MRED as Distributed by MLS Grid
Property tax history
+1.9%/yrLatest (2025): $1,690 · +2.4% YoY. Source: county tax records.
Cash-flow waterfall
monthlySold comps — $/sqft
last 12 mo · ≤1 miLoading sold comps…