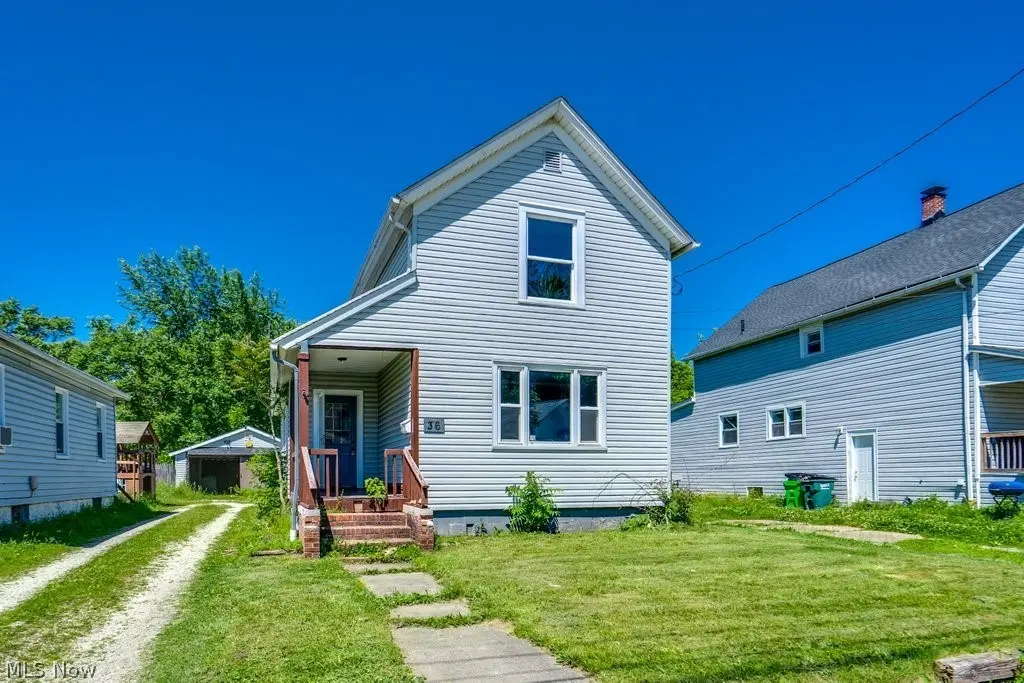
36 21st St NW · Barberton, OH
Flood risk 5/10 · Moderate
- FEMA flood zone
- X (unshaded)
- Chance of flooding over 30 yrs
- 0.67%
- Est. flood insurance / yr
- $473 – $860
Fire risk 1/10 · Minimal
- Est. fire insurance / yr
- $713 – $1,323
Heat risk 3/10 · Minor
- Hot days now (above 96°F)
- 7 days/yr
- Hot days in 30 yrs
- 17 days/yr
Wind risk 1/10 · Minimal
- Chance of severe wind over 30 yrs
- —
Air-quality risk 2/10 · Minimal
- Unhealthy air days now
- 0 days/yr
- Unhealthy air days in 30 yrs
- 1 days/yr
Risk factors via First Street. Map © Google.
Why this score? — see what drove the B- grade
The composite is a weighted blend of 9 inputs, each scored 0–100. Each bar is that input's sub-score; the figure is the points it added to the 100-point composite (weight × sub-score).
- Cash flow +24.2/30.0
- ARV discount +15.0/15.0
- DSCR +7.8/10.0
- 1% rule +6.1/10.0
- Schools +4.1/10.0
- Rent growth +4.0/5.0
- Livability +3.6/5.0
- Condition / age +2.5/5.0
- Appreciation +0.0/10.0
$129,600
🖨 Deal sheet 📄 Offer letter ✓ Due diligence
Listing remarks MLS
Spacious 2 Sty features Full Walk Out Basement, Detached Garage and Covered Patio. Small fenced pen with shed behind Garage. Some recent updates, First Floor Bedroom converted into Laundry Area. Location convenient to Shopping, Parks, Recreation, and Downtown Barberton. Great Investment Opportunity or Starter Home. Needs some finish work and TLC. Property is to be Sold AS-IS, Seller has No Reports or Disclosures. Buyer is responsible for researching all information, taxes, assessments, and certifications, IF Any. Buyer is responsible for ALL elected inspections and related Cost. Agents see Broker Remarks for Offer Instructions and Requirements. Seller will not allow repair prior to close, seller does not pay for inspections. AS-IS.
Key facts
- 6,908 sq ft lot
- 2 garage spots
- Built 1920
Property features AI
Exterior
- Parking: Detached 2-car garage; Detached gravel driveway
- Utilities: Public water; Public sewer
- Home design: 2 stories; Above-grade finished area approximately 1,300 (assessor)
- Construction: Aluminum siding; Vinyl siding; Asphalt shingle roof
- Exterior features: Driveway; Gravel surfaces
Interior
- Kitchen: Range; Refrigerator
- Bedrooms: One main-level bedroom
- Bathrooms: One full bathroom; One half bathroom; One main-level bathroom
- Heating & cooling: Forced air heating
- Interior features: ENERGY STAR qualified windows; Concrete unfinished basement
- Laundry & utility: Laundry located in basement
Neighborhood map
What this means for you Summary
Snapshot
- This is a 3-bed/1.0-bath single-family listed at $130k.
Deal economics
- At list price, monthly cash flow is $258 ($3k/yr) — positive.
- The deal already cash-flows at list — no discount required.
- Meets the 1% rule at list price ($1k rent vs $130k).
- Cap rate 8.7% vs local median 6.2% in Barberton — top-decile yield for the area; either an underpriced asset or a hidden risk that comps aren't pricing in. Stress-test before assuming the spread holds.
Location & tenants
- Location reads 71/100 on livability (#428 in OH) — a middle-class / working-renter tenant base. Strengths: cost of living A+, housing A+, health & safety A+; Watch: crime C-, amenities F, commute F.
- Barberton City (suburban): math 47% / reading 51% proficiency, ranked #466 of 656 in OH (top 71%) — families likely to look elsewhere, expect single-tenant / working-renter base with shorter leases; 62% free/reduced lunch — lower-income household profile, screen leases tightly.
- Market conditions: Rents rising fast (+5.9%/yr); 219 active listings in the ZIP; 13 comparable units currently listed for rent nearby; rentals at typical pace (median 14d on market — plan ~3-4 weeks tenant-placement turnaround); 1,114 units permitted in Summit County in 2024 (397 in 5+ unit buildings).
Forward outlook
- Local home prices are declining (-3.0%/yr); year-one equity from $896 of loan paydown is wiped out by about $4k of value loss. Plan a longer hold.
- Summit County population projected to shrink 6% by 2050 — rents likely to lag national; underwrite the cash flow, not the appreciation.
- At projected returns (-3.0% appreciation + 5.9% rent growth), your $36k cash investment doubles in ~9 years — after that, you're playing with house money.
Negotiation context
- Only 5 days on market — expect competitive offers; lowballing is unlikely to land.
- 2 sale attempts since 12y ago with the ask held roughly flat each time — persistent listings suggest the price (not the market) is what's stuck; bring a comps-based counter.
Risks & watch-outs
- Watch-outs: built in 1920 — expect roof / HVAC / electrical / plumbing capex.
- Climate carrying-cost: moderate flood risk — expect insurance premiums to compound above CPI over the hold.
Questions for the listing agent
- Built in 1920 — when were the roof, HVAC, electrical panel, plumbing, and water heater last replaced?
- Is there a deadline driving the sale (1031 exchange, divorce, estate, relocation)? That informs how much negotiation room exists.
- What's the average days-on-market for RENTAL listings here right now (not sales)? A rising rental-DOM trend means longer vacancies and softer asking-rent achievability than the comps imply.
- What's the recent tenant-quality profile in this submarket — average credit score on applications, eviction rate, late-payment / NSF rate, and stable-employment percentage? A property-management company in the area should have these aggregated.
- How much new for-sale + rental construction is in the pipeline within 1–3 miles? Heavy new supply typically softens prices + rents 12–24 months out; constrained supply supports both.
Investment metrics
- 1% rule
- 1.11% ✓
- Cap rate
- 8.68%
- Cash-on-cash
- 8.53%
- DSCR
- 1.38
- GRM
- 7.5
CMA / ARV
- ARV (on-the-fly)
- $159,900
- Comps found
- 12
Show comp detail 12 sales within ~0.75 mi
| Address | Dist | Beds/Ba | Sqft | Sold | Price | $/sf | Match |
|---|---|---|---|---|---|---|---|
| 30 22nd St NW | 0.09mi | 3/2.0 | 1,388 (+7%) | 2mo | $95,000 | $68 | 78 |
| 76 16th St NW | 0.22mi | 4/1.5 (+1) | 1,360 (+5%) | 1mo | $175,000 | $129 | 74 |
| 67 25th St NW | 0.25mi | 3/1.5 | 1,200 (-8%) | 0mo | $184,000 | $153 | 73 |
| 36 23rd St SW | 0.24mi | 4/1.5 (+1) | 1,380 (+6%) | 0mo | $139,000 | $101 | 71 |
| 144 19th St NW | 0.25mi | 4/2.5 (+1) | 1,342 (+3%) | 1mo | $165,000 | $123 | 71 |
| 333 17th St NW | 0.62mi | 3/1.0 | 1,270 (-2%) | 2mo | $216,500 | $170 | 65 |
| 377 Hillsdale Ave | 0.45mi | 2/2.0 (-1) | 1,282 (-1%) | 3mo | $165,000 | $129 | 65 |
| 219 17th St NW | 0.42mi | 3/1.0 | 1,428 (+10%) | 1mo | $165,000 | $116 | 63 |
| 131 25th St NW | 0.24mi | 3/2.0 | 1,472 (+13%) | 2mo | $155,000 | $105 | 61 |
| 48 20th St SW | 0.15mi | 4/2.0 (+1) | 1,478 (+14%) | 1mo | $135,000 | $91 | 60 |
| 1312 Wooster Rd W | 0.57mi | 3/1.0 | 1,200 (-8%) | 3mo | $103,000 | $86 | 58 |
| 1338 Oak Ave | 0.65mi | 3/1.0 | 1,128 (-13%) | 2mo | $182,000 | $161 | 46 |
Match score weights: distance 35% · size 25% · config 20% · recency 20%. Top-matched comps best support the ARV.
Projected returns pro-forma
-3.0% appreciation · 5.86% rent growth · sell at horizon
- IRR
- -0.2%
- Equity multiple
- 0.99×
- Total profit
- $-319
- Equity at exit
- $19,324
- IRR
- 12.2%
- Equity multiple
- 2.09×
- Total profit
- $39,381
- Equity at exit
- $11,205
Cash invested: $36,288 (down + closing). Projections, not guarantees.
Landlord ↔ Tenant lean methodology
- Overall (STATE)
- 73 Landlord-Friendly
- State Ohio
- 73 Landlord-Friendly · R+6
- County
- — inherits STATE
- City
- — inherits STATE
ZIP-level market 44203
- Rents YoY
- 5.9%
- Active inventory
- 219
- Price-to-rent
- 7.5×
Monthly cashflow live
- Estimated rent
- $1,434 high interval (Pro) →
- Mortgage (P&I)
- −$680
- Tax from tax record
- −$141 /mo · $1,692/yr
- Insurance
- −$54
- HOA
- −$0
- Vacancy / Maint / Mgmt
- −$301
- Net cashflow
- $258
Break-even live
UW: 25.0% down · 7.5% · 30yr · 1.5% tax · 5.0% vac · 8.0% maint · 8.0% mgmt
Financing live
Cash to close
- Down payment
- $32,400
- Closing costs
- $3,888
- Reserves months
- —
- Total cash needed
- —
Loan-product check · same deal, 3 products live
Conventional
25% down · 7.5% · 30yr
- Down + closing
- —
- Monthly P&I
- —
- Monthly cashflow
- —
- DSCR
- —
- Eligible?
- —
Personal DTI + credit; lowest rate.
DSCR
20% down · 8.5% · 30yr
- Down + closing
- —
- Monthly P&I
- —
- Monthly cashflow
- —
- DSCR
- —
- Eligible?
- —
No personal income docs; deal must DSCR.
Hard money
10% down · 12.0% · 12mo
- Down + closing
- —
- Monthly P&I
- —
- Monthly cashflow
- —
- DSCR
- —
- Eligible?
- —
Short-term bridge; refi at stabilization.
Rent comps 13 comps
| Address | Beds | Baths | Sqft | Rent | $/sqft | DOM | Units | Dist |
|---|---|---|---|---|---|---|---|---|
| 268 21st St NW Barberton, OH | 2.0 | 1.0 | 1224 | $1,399 | $1.14 | 14d | 1 | 0.42mi |
| 1270 South Ave Barberton, OH | 1.0–2.0 | 1.0–1.5 | 1012 | $1,449 | $1.43 | 13d | 1 | 0.49mi |
| 1285 Wooster Rd W Barberton, OH | 2.0 | 1.0 | 900 | $1,100 | $1.22 | 14d | 1 | 0.51mi |
| 667 W Park Ave Barberton, OH | 2.0 | 1.0 | 900 | $1,350 | $1.50 | 14d | 1 | 0.71mi |
| 200 8th St NW Barberton, OH | 3.0 | 2.0 | 1144 | $1,550 | $1.35 | 14d | 1 | 0.72mi |
| 149 2nd St SW Unit 149 Barberton, OH | 2.0 | 1.0 | 1037 | $1,100 | $1.06 | 14d | 1 | 1.02mi |
| 3953 Mount Vernon Blvd Norton, OH | 2.0 | 1.0 | 1000 | $1,318 | $1.32 | 13d | 1 | 1.06mi |
| 3954 Mount Vernon Blvd Norton, OH | 2.0 | 2.0 | 1200 | $1,676 | $1.40 | 13d | 1 | 1.06mi |
| 3943 Long Dr Norton, OH | 2.0 | 1.0–2.0 | 1200 | $1,508 | $1.26 | 13d | 5 | 1.10mi |
| 3888 Long Dr Norton, OH | 2.0 | 2.0 | 1000 | $1,601 | $1.60 | 13d | 1 | 1.17mi |
| 1275 Norton Ave #1283 Norton, OH | 3.0 | 1.0 | 932 | $1,200 | $1.29 | 43d | 1 | 1.17mi |
| 3343 Columbia Woods Dr Norton, OH | 1.0–2.0 | 1.0–2.0 | 900 | $1,525 | $1.69 | 2d | 9 | 1.26mi |
| 1465 Wilsonway Dr Barberton, OH | 3.0 | 2.5 | 1848 | $1,675 | $0.91 | 23d | 1 | 1.31mi |
Listing history 4 events
-
2026-06-07remarks 583-char remark
-
2026-06-07statusdays on market $129,600 Pending 5 DOM
-
2026-06-03remarks 545-char remark
-
2026-06-03$129,600 Active 1 DOM
ⓘ Source: listings_history table (triggers on properties + properties_extension) + one-shot
backfill from property_details.listing_events for pre-trigger history.
Tax reassessment forecast OH · Partial reset (capped growth)
- Current annual tax
- $1,692 · $141/mo
- Projected year-2 tax
- $1,857 · $155/mo
- Expected delta
- +$165/yr (+$14/mo · 9.7%)
ⓘ Screening estimate from a state-policy table — verify with the county assessor before closing.
Climate risk First Street
- Flood 5/10 Major FEMA zone X (unshaded) · 67% chance over 30 yrs
- Wildfire 1/10 Low
- Heat 3/10 Moderate 7 d/yr ≥96°F today · 17 d/yr by 30 yrs out
- Wind 1/10 Low
- Air quality 2/10 Low 0 unhealthy d/yr today · 1 by 30 yrs out
Nearby sold comps map
Loading sold comps map…
Walkable amenities ~0.75 mi
Loading nearby amenities…
Taxation est. · year 1
- Rental income
- $17,204
- − Mortgage interest
- −$7,260
- − Property taxes
- −$1,692
- − Insurance
- −$648
- − Repairs & maintenance
- −$1,376
- − Management
- −$1,376
- − Depreciation
- −$3,770
- Taxable income
- $1,082
- Est. tax owed @ 24.0%
- −$260
- After-tax cash flow
- $2,836/yr
For passive investors: Depreciation is non-cash, so a rental often shows a tax loss while cash-flowing — sheltering income. Rental losses are passive: they offset passive income freely, and up to $25,000/yr can offset ordinary (W-2) income if you actively participate and your MAGI is under $100k (phasing out to $0 by $150k); unused losses carry forward. On sale, claimed depreciation is recaptured at up to 25%, and gains may owe capital-gains tax (a 1031 exchange can defer both). Figures are a year-1 estimate at your 24.0% rate — not tax advice; consult a CPA.
Schools (NCES district)
- District
- Barberton City
- NCES district ID
- 3904353
- Math proficiency
- 47% ▼ -9.00%
- Reading proficiency
- 51% ▼ -9.00%
- Median HH income
- $37,660
- Composite
- 40.77/100
- National rank
- #3646
- State rank
- #466 of 656 in OH
Livability — Barberton
- Score
- 71/100
- State rank
- #428
- US rank
- #7016
Category grades
Schools grade is shown separately in the Schools card above.
Census & demographics
- Census place
- Barberton, OH
- County
- Summit County · 440,783 people
- City population
- 38,701
- Metro
- Akron, OH
- Population (ZIP)
- 38,701
- Household income
- $63,759
- Rent vs Own
- Severe rent burden
- 805.0
Population outlook (Summit County) Hauer SSP2
- Today (2025)
- 546,583 people
- By 2030
- 544,028 · -0.5%
- By 2040
- 531,363 · -2.8%
- By 2050
- 514,923 · -5.8%
- By 2075
- 481,765 · -11.9%
- By 2100
- 432,265 · -20.9%
Race, ethnicity, and origin ACS 2023
- Neighborhood character
- Predominantly White (86%)
- Race & ethnicity
- White 86% Black 7% Two or more races 5% Hispanic / Latino 1%
- Common ancestry
- Romanian 3% Slovak 2% Italian 1%
- Foreign-born
- 2% · Canada
- Languages at home
- 97% English-only · Russian/Polish/Slavic 1% Spanish 1%
Political lean MEDSL · Summit
- 2024 margin
- Lean D (+7.0) · D 53.0% · R 46.0%
- 2008→2024 swing
- -9.6pp toward R · 2008: 16.6pp · 2024: 7.0pp
- All cycles
- 2024: D+7.0 2020: D+9.6 2016: D+8.2 2012: D+14.8 2008: D+16.6
Not yet ingested
- Civics
- —
Market trends
- HPI YoY
- ▼ -224.82%
- Current HPI
- 199.8143
- Rent YoY
- ▲ 5.86%
- Metro
- Akron, OH
- State GDP YoY
- ▲ 1.98%
- F500 in state
- 48
Industry mix (Fortune 500 HQ in OH)
| Industry | F500 HQs | Revenue |
|---|---|---|
| Insurance | 3 | $145B |
|
||
| Industrial Machinery | 3 | $49B |
|
||
| Financial Services | 3 | $24B |
|
||
| Consumer Goods | 2 | $93B |
|
||
| Aerospace / Defense | 2 | $47B |
|
||
| Utilities | 2 | $33B |
|
||
Price history
+420.5% since first listed6 events — show timeline
- 2026-06-02 Listed $129,600 MLSNOW
- 2022-09-08 Sold (Public Records) $154,000 Public Records
- 2022-06-09 Sold (Public Records) $51,250 Public Records
- 2014-08-21 Sold (MLS) $23,000 MLSNOW
- 2014-07-25 Listing Removed — MLSNOW
- 2014-06-08 Listed $24,900 MLSNOW
Property tax history
+1.8%/yrLatest (2025): $1,692 · -2.3% YoY. Source: county tax records.
Cash-flow waterfall
monthlySold comps — $/sqft
last 12 mo · ≤1 miLoading sold comps…