 🏷️ Likely Rental
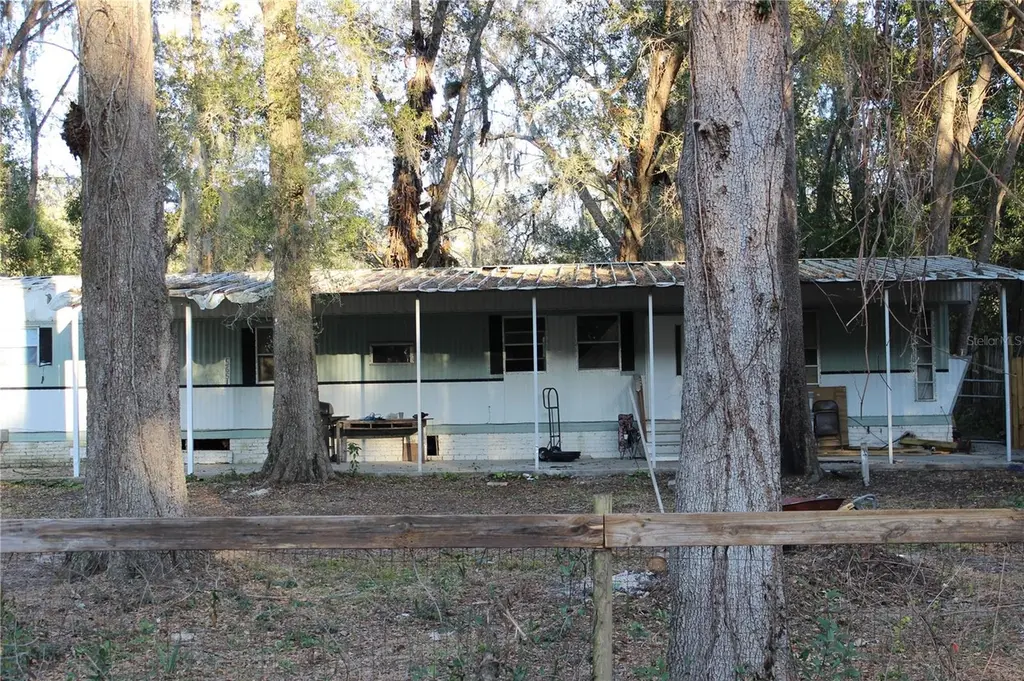
5651 SE 33rd Ct · Ocala, FL
Flood risk 1/10 · Minimal
- FEMA flood zone
- X (unshaded)
- Chance of flooding over 30 yrs
- 0.0%
- Est. flood insurance / yr
- $507 – $1,088
Fire risk 4/10 · Minor
- Est. fire insurance / yr
- $947 – $1,759
Heat risk 8/10 · Major
- Hot days now (above 108°F)
- 6 days/yr
- Hot days in 30 yrs
- 18 days/yr
Wind risk 9/10 · Severe
- Chance of severe wind over 30 yrs
- 99.0%
Air-quality risk 3/10 · Minor
- Unhealthy air days now
- 3 days/yr
- Unhealthy air days in 30 yrs
- 4 days/yr
Risk factors via First Street. Map © Google.
Why this score? — see what drove the B grade
The composite is a weighted blend of 9 inputs, each scored 0–100. Each bar is that input's sub-score; the figure is the points it added to the 100-point composite (weight × sub-score).
- Cash flow +30.0/30.0
- 1% rule +10.0/10.0
- DSCR +10.0/10.0
- ARV discount +7.5/15.0
- Schools +3.6/10.0
- Livability +3.5/5.0
- Rent growth +3.2/5.0
- Condition / age +2.5/5.0
- Appreciation +0.0/10.0
$85,999
🖨 Deal sheet 📄 Offer letter ✓ Due diligence
Listing remarks MLS
5651 SE 33rd Ct - An exceptional opportunity to acquire an income-producing parcel in rapidly growing Ocala. 5651 SE 33rd Ct, is part of a larger 9-property investment portfolio that is available, that consists of a mix of mobile homes. With leases currently in place, the portfolio offers both short-term income continuity and long-term flexibility for future value enhancement at the buyer’s discretion. 5651 SE 33rd Ct is positioned and assembled for maximum leverage and scale. This property provides workforce housing in a market experiencing strong population growth, expanding logistics infrastructure, and continued economic diversification. Rental demand in this corridor remains resilient due to job creation and in-migration from higher-cost states. Ocala’s expansion is supported by significant corporate investment. Major national operators such as FedEx and AutoZone have developed new warehouse and distribution facilities in the area, reinforcing employment stability and long-term rental demand. Additionally, the internationally recognized World Equestrian Center, the largest equestrian complex in the United States, drives year-round tourism, hospitality growth, and seasonal residency — all contributing to housing demand across price points. Strategic Central Florida Location: • Approx. 75 miles (±1 hr 15 min) to Orlando International Airport • Approx. 1 hr 20 min to Daytona Beach (Atlantic Coast) • Approx. 1 hr 30 min to Clearwater Beach (Gulf Coast) • Convenient access to I-75 connecting Tampa, Orlando, and North Florida This central positioning enhances tenant appeal while also strengthening long-term land value fundamentals. Investment & Development Potential: • Stabilized cash-flow asset • Single and (2) Four-parcel assemblage increases redevelopment flexibility • Attractive land-bank strategy in a growth corridor • Opportunity to enhance rents or reposition over time (buyer to verify zoning and land-use possibilities) As Marion County continues to attract industrial, logistics, and tourism-related development, assembled multi-parcel opportunities become increasingly scarce. This offering allows an investor to capture present income while maintaining optionality for future redevelopment or density optimization. A property of this scale — with occupancy in place and corporate-backed regional growth — represent a compelling blend of strong cash flow, appreciation potential, and strategic positioning in one of Central Florida’s fastest-evolving markets. Serious investors and developers should evaluate this opportunity promptly. REF: TB8478180 , TB8478451
Key facts
- Tenant occupied
- Rental demand
- 0.36 acre lot
Tags
Neighborhood map
What this means for you Summary
Snapshot
- This is a 4-bed/2.0-bath manufactured listed at $86k.
Deal economics
- At list price, monthly cash flow is $866 ($10k/yr) — positive.
- The deal already cash-flows at list — no discount required.
- Meets the 1% rule at list price ($2k rent vs $86k).
- Recommended offer: $78k (9.0% below list) — sets the bar for market timing.
- Cap rate 18.4% vs local median 4.2% in Ocala — top-decile yield for the area; either an underpriced asset or a hidden risk that comps aren't pricing in. Stress-test before assuming the spread holds.
Location & tenants
- Location reads 69/100 on livability (#476 in FL) — a middle-class / working-renter tenant base. Strengths: cost of living A+, housing A+, health & safety A+; Watch: crime F, amenities F, commute F.
- Marion (rural): math 42% / reading 43% proficiency, ranked #61 of 73 in FL (top 84%) — families likely to look elsewhere, expect single-tenant / working-renter base with shorter leases; 61% free/reduced lunch — lower-income household profile, screen leases tightly.
- Market conditions: Rents rising (+2.8%/yr); 344 active listings in the ZIP; 7 comparable units currently listed for rent nearby; rentals at typical pace (median 21d on market — plan ~3-4 weeks tenant-placement turnaround); solid renter incomes; 7,071 units permitted in Marion County in 2024 (534 in 5+ unit buildings).
Forward outlook
- Local home prices are declining (-3.0%/yr); year-one equity from $594 of loan paydown is wiped out by about $3k of value loss. Plan a longer hold.
- Marion County population projected at +13% by 2050 — modest demand growth; plan on rents tracking national, not racing it.
- At projected returns (-3.0% appreciation + 2.8% rent growth), your $24k cash investment doubles in ~3 years — after that, you're playing with house money.
Negotiation context
- It's been on market 118 days — a 9% lower offer ($78k) is reasonable based on typical stale-listing flexibility.
- 2 sale attempts since 2y ago; this cycle's ask has dropped $13k (13%) from the opening price — seller is motivated, your offer sets the floor, not the list.
- Current owner paid $25k; list at $86k implies a 244% gain — meaningful room to come down on a strong offer.
Risks & watch-outs
- Climate carrying-cost: severe wind risk, 99% chance of damaging wind over 30y; extreme-heat days projected 6→18/yr by 2055 (HVAC capex compounding) — expect insurance premiums to compound above CPI over the hold.
Questions for the listing agent
- It's been on market 118 days. Have you received any prior offers? Is the seller open to a 9% concession, seller financing, or rate buy-down credit?
- Built in 1970 — when were the roof, HVAC, electrical panel, plumbing, and water heater last replaced?
- Why hasn't it sold? Are there any deal-killer items the seller is aware of (foundation, flood, title, zoning, code violations)?
- Is there a deadline driving the sale (1031 exchange, divorce, estate, relocation)? That informs how much negotiation room exists.
- Crime grade is F in this area — have there been break-ins, vandalism, or insurance claims at this property in the last 3 years? What carrier currently insures it and at what premium?
- What's the average days-on-market for RENTAL listings here right now (not sales)? A rising rental-DOM trend means longer vacancies and softer asking-rent achievability than the comps imply.
- What's the recent tenant-quality profile in this submarket — average credit score on applications, eviction rate, late-payment / NSF rate, and stable-employment percentage? A property-management company in the area should have these aggregated.
- How much new for-sale + rental construction is in the pipeline within 1–3 miles? Heavy new supply typically softens prices + rents 12–24 months out; constrained supply supports both.
Investment metrics
- 1% rule
- 2.16% ✓
- Cap rate
- 18.37%
- Cash-on-cash
- 43.15%
- DSCR
- 2.92
- GRM
- 3.9
CMA / ARV
- ARV (median comp)
- $608,843
- List price
- $85,999
- Delta
- -85.88%
- Verdict
- UNDERPRICED
- Comps
- 1 within 2.0 mi
Show comp detail 1 sale within ~0.75 mi
| Address | Dist | Beds/Ba | Sqft | Sold | Price | $/sf | Match |
|---|---|---|---|---|---|---|---|
| 3103 SE 48th St | 0.70mi | 3/2.0 (-1) | 1,293 (-0%) | 6mo | $165,000 | $128 | 58 |
Match score weights: distance 35% · size 25% · config 20% · recency 20%. Top-matched comps best support the ARV.
Projected returns pro-forma
-3.0% appreciation · 2.84% rent growth · sell at horizon
- IRR
- 39.8%
- Equity multiple
- 2.70×
- Total profit
- $40,939
- Equity at exit
- $12,823
- IRR
- 46.1%
- Equity multiple
- 5.38×
- Total profit
- $105,558
- Equity at exit
- $7,436
Cash invested: $24,080 (down + closing). Projections, not guarantees.
Landlord ↔ Tenant lean methodology
- Overall (STATE)
- 87 Strongly Landlord-Friendly
- State Florida
- 87 Strongly Landlord-Friendly · R+3
- County
- — inherits STATE
- City
- — inherits STATE
ZIP-level market 34480
- Home prices YoY
- -28.7%
- Rents YoY
- 2.8%
- Active inventory
- 344
- Price-to-rent
- 3.9×
Monthly cashflow live
- Estimated rent
- $1,854 high interval (Pro) →
- Mortgage (P&I)
- −$451
- Tax from tax record
- −$112 /mo · $1,341/yr
- Insurance
- −$36
- HOA
- −$0
- Vacancy / Maint / Mgmt
- −$389
- Net cashflow
- $866
Break-even live
UW: 25.0% down · 7.5% · 30yr · 1.5% tax · 5.0% vac · 8.0% maint · 8.0% mgmt
Financing live
Cash to close
- Down payment
- $21,500
- Closing costs
- $2,580
- Reserves months
- —
- Total cash needed
- —
Loan-product check · same deal, 3 products live
Conventional
25% down · 7.5% · 30yr
- Down + closing
- —
- Monthly P&I
- —
- Monthly cashflow
- —
- DSCR
- —
- Eligible?
- —
Personal DTI + credit; lowest rate.
DSCR
20% down · 8.5% · 30yr
- Down + closing
- —
- Monthly P&I
- —
- Monthly cashflow
- —
- DSCR
- —
- Eligible?
- —
No personal income docs; deal must DSCR.
Hard money
10% down · 12.0% · 12mo
- Down + closing
- —
- Monthly P&I
- —
- Monthly cashflow
- —
- DSCR
- —
- Eligible?
- —
Short-term bridge; refi at stabilization.
Rent comps 7 comps
| Address | Beds | Baths | Sqft | Rent | $/sqft | DOM | Units | Dist |
|---|---|---|---|---|---|---|---|---|
| 4861 SE 31st Ter Ocala, FL | 3.0 | 2.0 | 1482 | $1,700 | $1.15 | 21d | 1 | 0.64mi |
| 4760 SE 30th Ct Ocala, FL | 3.0 | 2.0 | 1520 | $1,500 | $0.99 | 21d | 1 | 0.76mi |
| 3851 SE 66th Pl Ocala, FL | 3.0 | 2.0 | 1109 | $1,575 | $1.42 | 21d | 1 | 0.78mi |
| 4440 SE 62nd St Ocala, FL | 3.0 | 2.0 | 1325 | $1,850 | $1.40 | 21d | 1 | 0.93mi |
| 6851 SE 23rd Ave Ocala, FL | 3.0 | 2.0 | 1200 | $1,550 | $1.29 | 21d | 1 | 1.22mi |
| 3700 SE 34th Ct Ocala, FL | 3.0 | 2.0 | 1508 | $2,050 | $1.36 | 21d | 1 | 1.43mi |
| 3674 SE 37th Ct Ocala, FL | 3.0 | 2.5 | 1708 | $1,800 | $1.05 | 13d | 1 | 1.48mi |
Listing history 19 events
-
2026-06-18days on market $85,999 Active 118 DOM
-
2026-06-17days on market $85,999 Active 117 DOM
-
2026-06-16days on market $85,999 Active 116 DOM
-
2026-06-15days on market $85,999 Active 115 DOM
-
2026-06-14days on market $85,999 Active 113 DOM
-
2026-06-13days on market $85,999 Active 112 DOM
-
2026-06-10days on market $85,999 Active 110 DOM
-
2026-06-09days on market $85,999 Active 109 DOM
-
2026-06-08days on market $85,999 Active 108 DOM
-
2026-06-07pricedays on market $85,999 Active 107 DOM
-
2026-06-03days on market $99,000 Active 103 DOM
-
2026-06-02days on market $99,000 Active 102 DOM
-
2026-06-01days on market $99,000 Active 101 DOM
-
2026-05-31days on market $99,000 Active 100 DOM
-
2026-05-30days on market $99,000 Active 99 DOM
-
2026-02-20$99,000 Active 2707-char remark
Show marketing remark (2707 chars)
5651 SE 33rd Ct - An exceptional opportunity to acquire an income-producing parcel in rapidly growing Ocala. 5651 SE 33rd Ct, is part of a larger 9-property investment portfolio that is available, that consists of a mix of mobile homes. With leases currently in place, the portfolio offers both short-term income continuity and long-term flexibility for future value enhancement at the buyer’s discretion. 5651 SE 33rd Ct is positioned and assembled for maximum leverage and scale. This property provides workforce housing in a market experiencing strong population growth, expanding logistics infrastructure, and continued economic diversification. Rental demand in this corridor remains resilient due to job creation and in-migration from higher-cost states. Ocala’s expansion is supported by significant corporate investment. Major national operators such as FedEx and AutoZone have developed new warehouse and distribution facilities in the area, reinforcing employment stability and long-term rental demand. Additionally, the internationally recognized World Equestrian Center, the largest equestrian complex in the United States, drives year-round tourism, hospitality growth, and seasonal residency — all contributing to housing demand across price points. Strategic Central Florida Location: • Approx. 75 miles (±1 hr 15 min) to Orlando International Airport • Approx. 1 hr 20 min to Daytona Beach (Atlantic Coast) • Approx. 1 hr 30 min to Clearwater Beach (Gulf Coast) • Convenient access to I-75 connecting Tampa, Orlando, and North Florida This central positioning enhances tenant appeal while also strengthening long-term land value fundamentals. Investment & Development Potential: • Stabilized cash-flow asset • Single and (2) Four-parcel assemblage increases redevelopment flexibility • Attractive land-bank strategy in a growth corridor • Opportunity to enhance rents or reposition over time (buyer to verify zoning and land-use possibilities) As Marion County continues to attract industrial, logistics, and tourism-related development, assembled multi-parcel opportunities become increasingly scarce. This offering allows an investor to capture present income while maintaining optionality for future redevelopment or density optimization. A property of this scale — with occupancy in place and corporate-backed regional growth — represent a compelling blend of strong cash flow, appreciation potential, and strategic positioning in one of Central Florida’s fastest-evolving markets. Serious investors and developers should evaluate this opportunity promptly. REF: TB8478180 , TB8478451
-
2025-01-16soldstatus $25,000 Closed 116-char remark
Show marketing remark (116 chars)
This is a total rehab project for investor in SE Ocala. Seller has multiple similar properties in the area for sale.
-
2024-12-16status Pending 116-char remark
Show marketing remark (116 chars)
This is a total rehab project for investor in SE Ocala. Seller has multiple similar properties in the area for sale.
-
2024-12-03$40,000 Active 116-char remark
Show marketing remark (116 chars)
This is a total rehab project for investor in SE Ocala. Seller has multiple similar properties in the area for sale.
ⓘ Source: listings_history table (triggers on properties + properties_extension) + one-shot
backfill from property_details.listing_events for pre-trigger history.
Tax reassessment forecast FL · Resets to sale price
- Current annual tax
- $1,341 · $112/mo
- Projected year-2 tax
- $1,341 · $112/mo
- Expected delta
- $0/yr ($0/mo · 0.0%)
ⓘ Screening estimate from a state-policy table — verify with the county assessor before closing.
Climate risk First Street
- Flood 1/10 Low FEMA zone X (unshaded) · 0% chance over 30 yrs
- Wildfire 4/10 Moderate
- Heat 8/10 Severe 6 d/yr ≥108°F today · 18 d/yr by 30 yrs out
- Wind 9/10 Extreme 99% chance of damaging wind over 30 yrs
- Air quality 3/10 Moderate 3 unhealthy d/yr today · 4 by 30 yrs out
Nearby sold comps map
Loading sold comps map…
Walkable amenities ~0.75 mi
Loading nearby amenities…
Taxation est. · year 1
- Rental income
- $22,243
- − Mortgage interest
- −$4,817
- − Property taxes
- −$1,341
- − Insurance
- −$430
- − Repairs & maintenance
- −$1,779
- − Management
- −$1,779
- − Depreciation
- −$2,502
- Taxable income
- $9,594
- Est. tax owed @ 24.0%
- −$2,303
- After-tax cash flow
- $8,087/yr
For passive investors: Depreciation is non-cash, so a rental often shows a tax loss while cash-flowing — sheltering income. Rental losses are passive: they offset passive income freely, and up to $25,000/yr can offset ordinary (W-2) income if you actively participate and your MAGI is under $100k (phasing out to $0 by $150k); unused losses carry forward. On sale, claimed depreciation is recaptured at up to 25%, and gains may owe capital-gains tax (a 1031 exchange can defer both). Figures are a year-1 estimate at your 24.0% rate — not tax advice; consult a CPA.
Schools (NCES district)
- District
- Marion
- NCES district ID
- 1201260
- Math proficiency
- 42% ▼ -7.00%
- Reading proficiency
- 43% ▼ -4.00%
- Median HH income
- $40,015
- Composite
- 35.61/100
- National rank
- #4890
- State rank
- #61 of 73 in FL
Livability — Ocala
- Score
- 69/100
- State rank
- #476
- US rank
- #8461
Category grades
Schools grade is shown separately in the Schools card above.
Census & demographics
- County
- Marion County · 315,796 people
- City population
- 263,375
- Metro
- Ocala, FL
- Population (ZIP)
- 23,517
- Household income
- $77,557
- Rent vs Own
- Severe rent burden
- 169.0
Population outlook (Marion County) Hauer SSP2
- Today (2025)
- 365,905 people
- By 2030
- 376,768 · +3.0%
- By 2040
- 396,555 · +8.4%
- By 2050
- 412,723 · +12.8%
- By 2075
- 446,090 · +21.9%
- By 2100
- 436,193 · +19.2%
Race, ethnicity, and origin ACS 2023
- Neighborhood character
- Predominantly White (73%)
- Race & ethnicity
- White 73% Hispanic / Latino 15% Two or more races 11% Black 6% Asian 2%
- Hispanic origin (detail)
- Mexican 3% Puerto Rican 5% Cuban 2% Dominican 2%
- Common ancestry
- Italian 3% Slovak 3% Lithuanian 2%
- Foreign-born
- 6% · Canada
- Languages at home
- 89% English-only · Spanish 9% Other Asian/Pacific 1%
Political lean MEDSL · Marion
- 2024 margin
- Solid R (+31.6) · D 33.8% · R 65.5%
- 2008→2024 swing
- -20.0pp toward R · 2008: -11.6pp · 2024: -31.6pp
- All cycles
- 2024: R+31.6 2020: R+25.9 2016: R+26.2 2012: R+16.2 2008: R+11.6
Not yet ingested
- Civics
- —
Market trends
- HPI YoY
- ▼ -85.60%
- Current HPI
- 212.4262
- Rent YoY
- ▲ 2.84%
- Metro
- Ocala, FL
- State GDP YoY
- ▲ 3.28%
- F500 in state
- 36
Industry mix (Fortune 500 HQ in FL)
| Industry | F500 HQs | Revenue |
|---|---|---|
| Industrial Technology | 2 | $29B |
|
||
| Insurance | 2 | $17B |
|
||
| Retail | 1 | $60B |
|
||
| Technology Distribution | 1 | $58B |
|
||
| Homebuilding | 1 | $35B |
|
||
| Technology Manufacturing | 1 | $35B |
|
||
Price history
+147.5% since first listed4 events — show timeline
- 2026-02-20 Listed $99,000 Stellar MLS as Distributed by MLS Grid
- 2025-01-16 Sold (MLS) $25,000 Stellar MLS as Distributed by MLS Grid
- 2024-12-16 Pending — Stellar MLS as Distributed by MLS Grid
- 2024-12-03 Listed $40,000 Stellar MLS as Distributed by MLS Grid
Property tax history
+9.8%/yrLatest (2025): $1,341 · +32.4% YoY. Source: county tax records.
Cash-flow waterfall
monthlySold comps — $/sqft
last 12 mo · ≤1 miLoading sold comps…