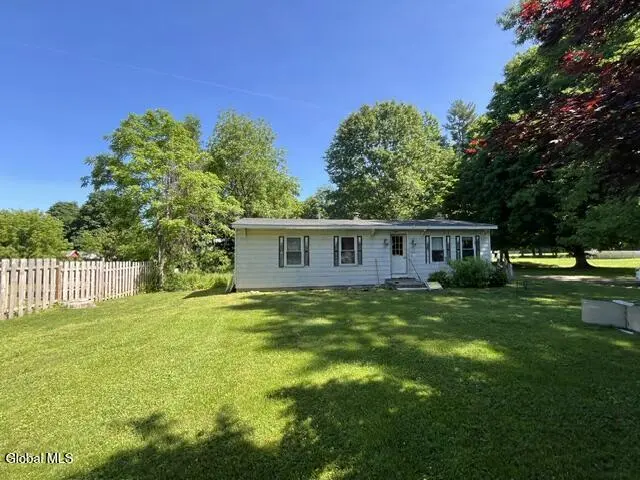
115 Lowber Rd · Schuylerville, NY
Flood risk 1/10 · Minimal
- FEMA flood zone
- X
- Chance of flooding over 30 yrs
- 0.0%
- Est. flood insurance / yr
- $507 – $1,088
Fire risk 2/10 · Minimal
- Est. fire insurance / yr
- $691 – $1,283
Heat risk 3/10 · Minor
- Hot days now (above 95°F)
- 7 days/yr
- Hot days in 30 yrs
- 16 days/yr
Wind risk 2/10 · Minimal
- Chance of severe wind over 30 yrs
- 4.0%
Air-quality risk 2/10 · Minimal
- Unhealthy air days now
- 0 days/yr
- Unhealthy air days in 30 yrs
- 1 days/yr
Risk factors via First Street. Map © Google.
Why this score? — see what drove the D+ grade
The composite is a weighted blend of 9 inputs, each scored 0–100. Each bar is that input's sub-score; the figure is the points it added to the 100-point composite (weight × sub-score).
- Appreciation +10.0/10.0
- Cash flow +8.2/30.0
- ARV discount +7.5/15.0
- Schools +5.3/10.0
- Livability +3.9/5.0
- 1% rule +3.6/10.0
- Rent growth +2.5/5.0
- Condition / age +2.5/5.0
- DSCR +2.2/10.0
$125,000
🖨 Deal sheet 📄 Offer letter ✓ Due diligence
Listing remarks MLS
Nestled on a spacious 0.87acre lot, this 1970 fixer upper offers an incredible opportunity to create your dream home. The property boasts 3 bedrooms, with potential for a 3rd. Enjoy peaceful mornings in the sunroom or entertain on the large deck overlooking a vast yard, perfect for gardening, outdoor activities or future expansion. with solid bones and ample space, this home is ready for your personal touch to restore it's full potential. Whether you're looking for a project or a place to grow, this home offers both.
Key facts
- Large deck
- Private backyard
- Huge shed
Tags
Property features AI
Exterior
- Parking: Driveway with space for 4 vehicles
- Utilities: Septic tank
- Home design: Single-family residence; Property listed in fixer condition
- Construction: Aluminum siding; Asphalt roof
- Exterior features: Deck; Shed(s); Landscaped, level lot
Interior
- Kitchen: Range; Refrigerator
- Bedrooms: Three bedrooms on the first floor
- Flooring: Carpet; Laminate
- Bathrooms: One full bathroom on the first floor
- Heating & cooling: Has heating (type: Other)
- Interior features: Seven total rooms; Full basement; Three-season room; Garden and outdoor lighting (accessible from interior)
- Laundry & utility: Washer/Dryer located on the main level
Neighborhood map
What this means for you Summary
Snapshot
- This is a 2-bed/1.0-bath manufactured listed at $125k.
Deal economics
- At list price, monthly cash flow is $-118 ($-1k/yr) — negative.
- To cash-flow at today's rent, offer at most $104k (16.7% below list).
- To meet the 1% rule (rent ≥ 1% of price), the offer needs to be $107k (14.3% below list).
- Recommended offer: $104k (16.7% below list) — sets the bar for cash-flow.
Location & tenants
- Location reads 77/100 on livability (#186 in NY, #2,863 nationally) — a middle-class / working-renter tenant base. Strengths: housing A+, health & safety A+, crime A; Watch: amenities D, commute F.
- Greenwich Central School District (town): math 59% / reading 60% proficiency, ranked #266 of 755 in NY (top 35%) — acceptable for families but not a draw, mixed tenant base, ~2y average lease.
- Zoned schools: Greenwich Elementary School (math 44% / reading 64%, grade C, #908 of 2,108 statewide, top 46%, 466 students, 37% FRL); Greenwich Junior-Senior High School (math 98% / reading 87%, grade A+, #158 of 1,100 statewide, top 15%, 429 students, 32% FRL).
- Zoned-school proficiency averages 73% at this address vs 60% district-wide (+14 pts) — the actual schools serving this property are materially stronger than the Greenwich Central School District average implies; a family-tenant draw the district grade alone would hide.
- Market conditions: 23 active listings in the ZIP; 106 units permitted in Washington County in 2024 (0 in 5+ unit buildings).
Forward outlook
- In year one you build about $13k of equity ($864 loan paydown + $12k appreciation (10.0% local appreciation)).
- Washington County population projected at -20% by 2050 — secular population decline; favor cash flow + early exit over multi-decade hold.
- By year 3, paydown + projected appreciation supports a ~$34k cash-out refi (75% LTV) — recoverable capital for the next deal without selling this one.
Negotiation context
- Only 7 days on market — expect competitive offers; lowballing is unlikely to land.
- 2 sale attempts since 2y ago with the ask held roughly flat each time — persistent listings suggest the price (not the market) is what's stuck; bring a comps-based counter.
Questions for the listing agent
- What do current leases actually rent for vs. the listed asking? Can we see a recent rent roll and the last 12 months of T-12 income?
- Built in 1970 — when were the roof, HVAC, electrical panel, plumbing, and water heater last replaced?
- Is there a deadline driving the sale (1031 exchange, divorce, estate, relocation)? That informs how much negotiation room exists.
- Schools are B-rated — typically a magnet for longer-tenancy family renters. What's the average tenant stay here, and is there a school-zone premium baked into asking?
- The area grade is low — what's the realistic commute time and amenity access for the typical tenant pool here? Any planned neighborhood developments (good or bad) we should know about?
- What's the average days-on-market for RENTAL listings here right now (not sales)? A rising rental-DOM trend means longer vacancies and softer asking-rent achievability than the comps imply.
- What's the recent tenant-quality profile in this submarket — average credit score on applications, eviction rate, late-payment / NSF rate, and stable-employment percentage? A property-management company in the area should have these aggregated.
- How much new for-sale + rental construction is in the pipeline within 1–3 miles? Heavy new supply typically softens prices + rents 12–24 months out; constrained supply supports both.
Investment metrics
- 1% rule
- 0.86% ✗
- Cap rate
- 5.16%
- Cash-on-cash
- -4.06%
- DSCR
- 0.82
- GRM
- 9.7
CMA / ARV
No comps found within radius.
Projected returns pro-forma
10.0% appreciation · 3.0% rent growth · sell at horizon
- IRR
- 21.4%
- Equity multiple
- 2.73×
- Total profit
- $60,612
- Equity at exit
- $112,610
- IRR
- 19.4%
- Equity multiple
- 6.27×
- Total profit
- $184,581
- Equity at exit
- $242,848
Cash invested: $35,000 (down + closing). Projections, not guarantees.
Landlord ↔ Tenant lean methodology
- Overall (STATE)
- 15 Strongly Tenant-Friendly
- State New York
- 15 Strongly Tenant-Friendly · D+10
- County
- — inherits STATE
- City
- — inherits STATE
ZIP-level market 12834
- Home prices YoY
- 21.5%
- Active inventory
- 23
- Price-to-rent
- 9.7×
Monthly cashflow live
- Estimated rent
- $1,071 medium interval (Pro) →
- Mortgage (P&I)
- −$656
- Tax from tax record
- −$257 /mo · $3,086/yr
- Insurance
- −$52
- HOA
- −$0
- Vacancy / Maint / Mgmt
- −$225
- Net cashflow
- $-118
Break-even live
UW: 25.0% down · 7.5% · 30yr · 1.5% tax · 5.0% vac · 8.0% maint · 8.0% mgmt
Financing live
Cash to close
- Down payment
- $31,250
- Closing costs
- $3,750
- Reserves months
- —
- Total cash needed
- —
Loan-product check · same deal, 3 products live
Conventional
25% down · 7.5% · 30yr
- Down + closing
- —
- Monthly P&I
- —
- Monthly cashflow
- —
- DSCR
- —
- Eligible?
- —
Personal DTI + credit; lowest rate.
DSCR
20% down · 8.5% · 30yr
- Down + closing
- —
- Monthly P&I
- —
- Monthly cashflow
- —
- DSCR
- —
- Eligible?
- —
No personal income docs; deal must DSCR.
Hard money
10% down · 12.0% · 12mo
- Down + closing
- —
- Monthly P&I
- —
- Monthly cashflow
- —
- DSCR
- —
- Eligible?
- —
Short-term bridge; refi at stabilization.
Listing history 7 events
-
2026-06-18days on market $125,000 Active 7 DOM
-
2026-06-17days on market $125,000 Active 6 DOM
-
2026-06-16days on market $125,000 Active 5 DOM
-
2026-06-15days on market $125,000 Active 4 DOM
-
2026-06-13days on market $125,000 Active 2 DOM
-
2026-06-12remarks 471-char remark
-
2026-06-12$125,000 Active 1 DOM
ⓘ Source: listings_history table (triggers on properties + properties_extension) + one-shot
backfill from property_details.listing_events for pre-trigger history.
Tax reassessment forecast NY · Partial reset (capped growth)
- Current annual tax
- $3,086 · $257/mo
- Projected year-2 tax
- $3,086 · $257/mo
- Expected delta
- $0/yr ($0/mo · 0.0%)
ⓘ Screening estimate from a state-policy table — verify with the county assessor before closing.
Climate risk First Street
- Flood 1/10 Low FEMA zone X · 0% chance over 30 yrs
- Wildfire 2/10 Low
- Heat 3/10 Moderate 7 d/yr ≥95°F today · 16 d/yr by 30 yrs out
- Wind 2/10 Low 4% chance of damaging wind over 30 yrs
- Air quality 2/10 Low 0 unhealthy d/yr today · 1 by 30 yrs out
Nearby sold comps map
Loading sold comps map…
Walkable amenities ~0.75 mi
Loading nearby amenities…
Taxation est. · year 1
- Rental income
- $12,856
- − Mortgage interest
- −$7,002
- − Property taxes
- −$3,086
- − Insurance
- −$625
- − Repairs & maintenance
- −$1,028
- − Management
- −$1,028
- − Depreciation
- −$3,636
- Taxable loss
- −$3,551
- Est. tax savings @ 24.0%
- +$852
- After-tax cash flow
- $-569/yr
For passive investors: Depreciation is non-cash, so a rental often shows a tax loss while cash-flowing — sheltering income. Rental losses are passive: they offset passive income freely, and up to $25,000/yr can offset ordinary (W-2) income if you actively participate and your MAGI is under $100k (phasing out to $0 by $150k); unused losses carry forward. On sale, claimed depreciation is recaptured at up to 25%, and gains may owe capital-gains tax (a 1031 exchange can defer both). Figures are a year-1 estimate at your 24.0% rate — not tax advice; consult a CPA.
Schools (NCES district)
- District
- Greenwich Central School District
- NCES district ID
- 3612900
- Math proficiency
- 59% ▲ 2.00%
- Reading proficiency
- 60% ▼ -2.00%
- Median HH income
- $62,128
- Composite
- 53.45/100
- National rank
- #3147
- State rank
- #266 of 755 in NY
Livability — Schuylerville
- Score
- 77/100
- State rank
- #186
- US rank
- #2863
Category grades
Schools grade is shown separately in the Schools card above.
Census & demographics
- Population (ZIP)
- 6,137
Population outlook (Washington County) Hauer SSP2
- Today (2025)
- 59,576 people
- By 2030
- 57,618 · -3.3%
- By 2040
- 52,751 · -11.5%
- By 2050
- 47,514 · -20.2%
- By 2075
- 35,690 · -40.1%
- By 2100
- 24,807 · -58.4%
Race, ethnicity, and origin ACS 2023
- Neighborhood character
- Predominantly White (95%)
- Race & ethnicity
- White 95% Hispanic / Latino 3% Two or more races 2% Asian 1%
- Common ancestry
- Lithuanian 6% Romanian 4% Iranian 3%
- Foreign-born
- 4% · Canada, China
- Languages at home
- 96% English-only · Chinese 1% French/Haitian/Cajun 1% Spanish 1%
Political lean MEDSL · Washington
- 2024 margin
- Strong R (+21.2) · D 39.4% · R 60.6%
- 2008→2024 swing
- -22.0pp toward R · 2008: 0.8pp · 2024: -21.2pp
- All cycles
- 2024: R+21.2 2020: R+15.6 2016: R+20.2 2012: D+1.6 2008: D+0.8
Not yet ingested
- Civics
- —
Market trends
- HPI YoY
- ▲ 66.00%
- Current HPI
- 373.2809
- Rent YoY
- —
- Metro
- —
- State GDP YoY
- ▲ 2.60%
- F500 in state
- 92
Industry mix (Fortune 500 HQ in NY)
| Industry | F500 HQs | Revenue |
|---|---|---|
| Financial Services | 10 | $950B |
|
||
| Consumer Goods | 9 | $162B |
|
||
| Insurance | 4 | $225B |
|
||
| Telecommunications | 2 | $144B |
|
||
| Pharmaceuticals | 2 | $112B |
|
||
| Media / Entertainment | 2 | $69B |
|
||
Price history
-19.4% since first listed9 events — show timeline
- 2026-06-11 Listed $125,000 Global MLS
- 2025-03-28 Sold (Public Records) $110,000 Public Records
- 2025-03-24 Sold (MLS) $110,000 Global MLS
- 2025-02-09 Pending — Global MLS
- 2025-01-05 Price Changed $119,000 Global MLS
- 2024-12-16 Price Changed $129,900 Global MLS
- 2024-12-03 Price Changed $139,900 Global MLS
- 2024-11-09 Price Changed $149,900 Global MLS
- 2024-10-18 Listed $155,000 Global MLS
Property tax history
+7.3%/yrLatest (2025): $3,086 · +8.1% YoY. Source: county tax records.
Cash-flow waterfall
monthlySold comps — $/sqft
last 12 mo · ≤1 miLoading sold comps…