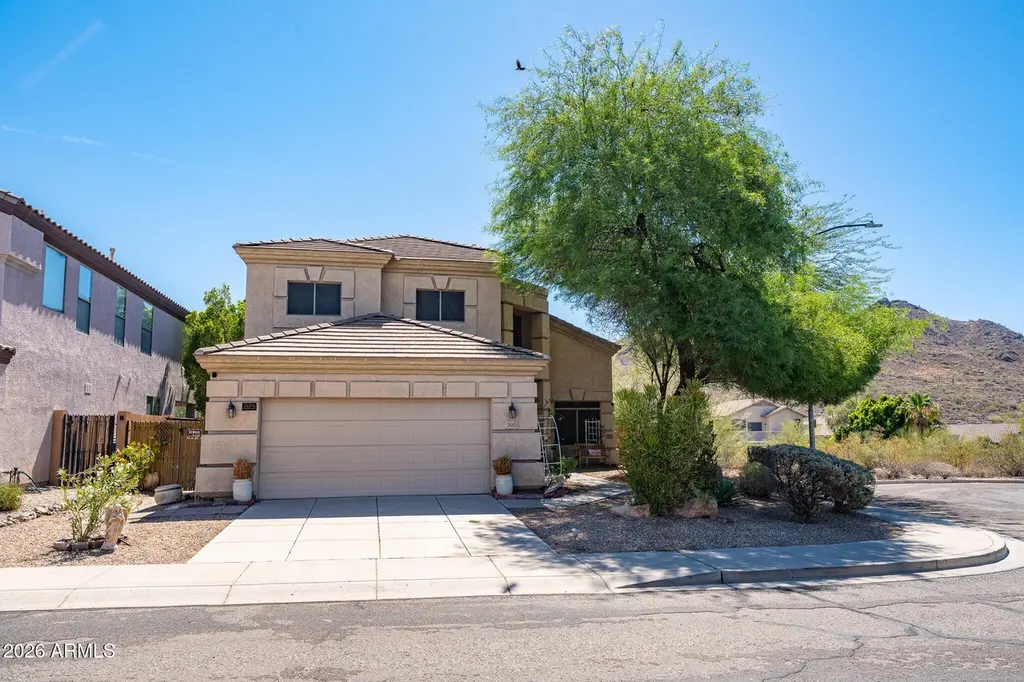
26815 N 65th Ave · Phoenix, AZ
Flood risk 1/10 · Minimal
- FEMA flood zone
- X (shaded)
- Chance of flooding over 30 yrs
- 0.0%
- Est. flood insurance / yr
- $507 – $1,088
Fire risk 5/10 · Moderate
- Est. fire insurance / yr
- $610 – $1,132
Heat risk 8/10 · Major
- Hot days now (above 111°F)
- 7 days/yr
- Hot days in 30 yrs
- 16 days/yr
Wind risk 1/10 · Minimal
- Chance of severe wind over 30 yrs
- —
Air-quality risk 2/10 · Minimal
- Unhealthy air days now
- 2 days/yr
- Unhealthy air days in 30 yrs
- 2 days/yr
Risk factors via First Street. Map © Google.
Why this score? — see what drove the D+ grade
The composite is a weighted blend of 9 inputs, each scored 0–100. Each bar is that input's sub-score; the figure is the points it added to the 100-point composite (weight × sub-score).
- ARV discount +15.0/15.0
- Appreciation +10.0/10.0
- Cash flow +6.9/30.0
- Schools +4.7/10.0
- Livability +3.8/5.0
- Rent growth +3.1/5.0
- Condition / age +2.5/5.0
- DSCR +1.1/10.0
- 1% rule +0.9/10.0
$506,999
🖨 Deal sheet (PDF) 📄 Offer letter ✓ Due diligence
Listing remarks
Nestled on a private cul-de-sac corner lot within the highly desirable gated community of Eagle Highlands North, this beautifully maintained 4-bedroom, 2.5-bath home offers the perfect blend of privacy, comfort, and breathtaking Arizona scenery. Surrounded by stunning mountain views in every direction, this home captures everything buyers love about North Phoenix living. Step inside to discover a spacious split-floor plan featuring rich wood flooring, formal living and dining spaces, custom finishes, and an inviting layout designed for both everyday living and entertaining. The expansive eat-in kitchen is the heart of the home, offering abundant cabinetry, generous counter space, built-in a
Key facts
- Gated community
- Split-floor plan
- Rich wood flooring
Tags
Property features AI
Finance
- HOA & community: Community association with $75 monthly fee; Association fee includes grounds maintenance; Biking/walking paths
Exterior
- Parking: 2 covered parking spaces; 2 open parking spaces; 2-car garage with garage door opener, extended length and direct access
- Security: Gated community; Fire sprinkler system
- Utilities: City water; Public sewer (connected)
- Home design: Single-family residence; Fee simple ownership; Desert and mountain views; Asphalt road access
- Construction: Stucco and painted wood frame construction; Tile roof
- Exterior features: Private play pool; Sprinklers in front and rear; Corner lot; Desert front and back landscaping; Cul-de-sac lot; City maintained road
Interior
- Kitchen: Built-in microwave; Laminate counters; Pantry; Refrigerator; Dishwasher; Disposal; Built-in electric oven
- Bedrooms: Up to 5 possible bedrooms
- Flooring: Carpet; Tile; Wood
- Bathrooms: 2 full bathrooms; 1 half bathroom
- Heating & cooling: Heat pump (electric); Central air; Ceiling fans
- Interior features: High speed internet; Double vanity; Master bedroom on main level; Eat-in kitchen; Breakfast bar; 9+ foot flat ceilings; Vaulted ceilings; Pantry; Primary bathroom with separate shower and tub; Laminate counters; Low-emissivity windows; Solar screens; Dual pane windows; Vinyl window frames; Multi-zone HVAC
- Laundry & utility: Inside laundry
Neighborhood map
What this means for you Summary
Snapshot
- This is a 4-bed/4.0-bath single-family listed at $507k.
Deal economics
- At list price, monthly cash flow is $-764 ($-9k/yr) — negative.
- To cash-flow at today's rent, offer at most $372k (26.6% below list).
- To meet the 1% rule (rent ≥ 1% of price), the offer needs to be $300k (40.8% below list).
- Recommended offer: $300k (40.8% below list) — sets the bar for 1% rule.
- Cap rate 4.5% vs local median 3.3% in Phoenix — top-decile yield for the area; either an underpriced asset or a hidden risk that comps aren't pricing in. Stress-test before assuming the spread holds.
Location & tenants
- Location reads 75/100 on livability (#16 in AZ, #3,924 nationally) — a middle-class / working-renter tenant base. Strengths: amenities A+, commute A+, housing A+; Watch: health & safety C-, crime F.
- Deer Valley Unified District (4246) (urban): math 50% / reading 55% proficiency, ranked #33 of 249 in AZ (top 13%) — acceptable for families but not a draw, mixed tenant base, ~2y average lease.
- Zoned schools: Terramar Academy of The Arts (math 52% / reading 59%, grade C, #201 of 1,109 statewide, top 18%, 1,015 students, 13% FRL); Mountain Ridge High School (math 51% / reading 55%, grade C-, #29 of 381 statewide, top 8%, 2,771 students, 10% FRL).
- Market conditions: Rents rising (+2.3%/yr); 123 active listings in the ZIP; 40 comparable units currently listed for rent nearby; rentals at typical pace (median 17d on market — plan ~3-4 weeks tenant-placement turnaround); high-income renter base; 36,011 units permitted in Maricopa County in 2024 (12,801 in 5+ unit buildings).
Forward outlook
- In year one you build about $54k of equity ($4k loan paydown + $51k appreciation (10.0% local appreciation)).
- Maricopa County population projected at +38% by 2050 — long-run rental-demand tailwind backs the buy-and-hold thesis.
- By year 2, paydown + projected appreciation supports a ~$87k cash-out refi (75% LTV) — recoverable capital for the next deal without selling this one.
Negotiation context
- It's been on market 17 days — a 2% lower offer ($499k) is reasonable based on typical stale-listing flexibility.
- 6 sale attempts since 16y ago with the ask held roughly flat each time — persistent listings suggest the price (not the market) is what's stuck; bring a comps-based counter.
- Current owner paid $281k; list at $507k implies a 80% gain — meaningful room to come down on a strong offer.
Risks & watch-outs
- Climate carrying-cost: moderate wildfire risk; extreme-heat days projected 7→16/yr by 2055 (HVAC capex compounding) — expect insurance premiums to compound above CPI over the hold.
Questions for the listing agent
- What do current leases actually rent for vs. the listed asking? Can we see a recent rent roll and the last 12 months of T-12 income?
- What does the HOA fee cover, when was the last increase, and are there any pending special assessments or reserve-fund shortfalls?
- Is there a deadline driving the sale (1031 exchange, divorce, estate, relocation)? That informs how much negotiation room exists.
- Crime grade is F in this area — have there been break-ins, vandalism, or insurance claims at this property in the last 3 years? What carrier currently insures it and at what premium?
- The area grade is low — what's the realistic commute time and amenity access for the typical tenant pool here? Any planned neighborhood developments (good or bad) we should know about?
- What's the average days-on-market for RENTAL listings here right now (not sales)? A rising rental-DOM trend means longer vacancies and softer asking-rent achievability than the comps imply.
- What's the recent tenant-quality profile in this submarket — average credit score on applications, eviction rate, late-payment / NSF rate, and stable-employment percentage? A property-management company in the area should have these aggregated.
- How much new for-sale + rental construction is in the pipeline within 1–3 miles? Heavy new supply typically softens prices + rents 12–24 months out; constrained supply supports both.
Investment metrics
- 1% rule
- 0.59% ✗
- Cap rate
- 4.48%
- Cash-on-cash
- -6.46%
- DSCR
- 0.71
- GRM
- 14.1
CMA / ARV
- ARV (on-the-fly)
- $693,396
- Comps found
- 12
Show comp detail 12 sales within ~0.75 mi
| Address | Dist | Beds/Ba | Sqft | Sold | Price | $/sf | Match |
|---|---|---|---|---|---|---|---|
| 27383 N 69th Ln | 0.61mi | 4/3.0 | 2,084 (-7%) | 1mo | $644,990 | $309 | 55 |
| 6964 W Buckhorn Trl | 0.64mi | 4/3.0 | 2,084 (-7%) | 1mo | $624,990 | $300 | 54 |
| 6999 W Pinnacle Vista Dr | 0.68mi | 4/3.0 | 2,084 (-7%) | 0mo | $639,990 | $307 | 52 |
| 7023 W Pinnacle Vista Dr | 0.71mi | 4/3.0 | 2,084 (-7%) | 0mo | $650,000 | $312 | 51 |
| 6827 W EL Cortez Pl | 0.73mi | 4/2.0 | 2,339 (+4%) | 1mo | $600,000 | $257 | 50 |
| 27292 N 70th Rd | 0.73mi | 4/3.0 | 2,084 (-7%) | 0mo | $676,400 | $325 | 50 |
| 6915 W Briles Rd | 0.69mi | 4/2.0 | 2,384 (+6%) | 0mo | $595,000 | $250 | 49 |
| 6764 W Tether Trl | 0.40mi | 5/3.0 (+1) | 2,556 (+14%) | 0mo | $510,000 | $200 | 49 |
| 6967 W Pinnacle Vista Dr | 0.64mi | 3/2.5 (-1) | 1,989 (-11%) | 1mo | $651,300 | $327 | 40 |
| 6972 W Buckhorn Trl | 0.65mi | 3/2.5 (-1) | 1,989 (-11%) | 1mo | $620,000 | $312 | 39 |
| 6991 W Pinnacle Vista Dr | 0.67mi | 3/2.5 (-1) | 1,989 (-11%) | 1mo | $625,000 | $314 | 38 |
| 7048 W Quail Track Dr | 0.69mi | 3/2.5 (-1) | 2,508 (+12%) | 0mo | $730,000 | $291 | 37 |
Match score weights: distance 35% · size 25% · config 20% · recency 20%. Top-matched comps best support the ARV.
Projected returns pro-forma
10.0% appreciation · 2.29% rent growth · sell at horizon
- IRR
- 19.5%
- Equity multiple
- 2.59×
- Total profit
- $225,144
- Equity at exit
- $456,745
- IRR
- 17.8%
- Equity multiple
- 5.91×
- Total profit
- $696,728
- Equity at exit
- $984,988
Cash invested: $141,960 (down + closing). Projections, not guarantees.
Landlord ↔ Tenant lean methodology
- Overall (STATE)
- 87 Strongly Landlord-Friendly
- State Arizona
- 87 Strongly Landlord-Friendly · R+3
- County
- — inherits STATE
- City
- — inherits STATE
ZIP-level market 85083
- Home prices YoY
- 5.4%
- Rents YoY
- 2.3%
- Active inventory
- 123
- Price-to-rent
- 14.1×
Monthly cashflow live
- Estimated rent
- $3,003 high interval (Pro) →
- Mortgage (P&I)
- −$2,659
- Tax from tax record
- −$192 /mo · $2,300/yr
- Insurance
- −$211
- HOA
- −$75
- Vacancy / Maint / Mgmt
- −$631
- Net cashflow
- $-764
Break-even live
Sensitivity live
| Price | -10% $-477 | -5% $-621 | +0% $-764 | +5% $-908 | +10% $-1,051 |
|---|---|---|---|---|---|
| Rent | -10% $-1,001 | -5% $-883 | +0% $-764 | +5% $-646 | +10% $-527 |
| Rate | -1.0pp $-509 | -0.5pp $-635 | base $-764 | +0.5pp $-896 | +1.0pp $-1,029 |
UW: 25.0% down · 7.5% · 30yr · 1.5% tax · 5.0% vac · 8.0% maint · 8.0% mgmt
Financing live
Cash to close
- Down payment
- $126,750
- Closing costs
- $15,210
- Reserves months
- —
- Total cash needed
- —
Loan-product check · same deal, 3 products live
Conventional
25% down · 7.5% · 30yr
- Down + closing
- —
- Monthly P&I
- —
- Monthly cashflow
- —
- DSCR
- —
- Eligible?
- —
Personal DTI + credit; lowest rate.
DSCR
20% down · 8.5% · 30yr
- Down + closing
- —
- Monthly P&I
- —
- Monthly cashflow
- —
- DSCR
- —
- Eligible?
- —
No personal income docs; deal must DSCR.
Hard money
10% down · 12.0% · 12mo
- Down + closing
- —
- Monthly P&I
- —
- Monthly cashflow
- —
- DSCR
- —
- Eligible?
- —
Short-term bridge; refi at stabilization.
Rent comps 40 comps
| Address | Beds | Baths | Sqft | Rent | $/sqft | DOM | Units | Dist |
|---|---|---|---|---|---|---|---|---|
| 6506 W Molly Ln Phoenix, AZ | 5.0 | 3.0 | 2876 | $3,100 | $1.08 | 7d | 1 | 0.07mi |
| 6602 W Molly Ln Phoenix, AZ | 4.0 | 2.5 | 2793 | $3,300 | $1.18 | 0d | 1 | 0.17mi |
| 6539 W Jomax Rd Phoenix, AZ | 3.0 | 3.0 | 2526 | $2,495 | $0.99 | 12d | 1 | 0.19mi |
| 6539 W Jomax Rd Phoenix, AZ | 3.0 | 3.0 | 2526 | $2,495 | $0.99 | 26d | 1 | 0.19mi |
| 6539 W Jomax Rd Phoenix, AZ | 3.0 | 3.0 | 2526 | $2,495 | $0.99 | 23d | 1 | 0.19mi |
| 6618 W Honeysuckle Dr Phoenix, AZ | 3.0 | 2.0 | 2436 | $2,200 | $0.90 | 45d | 1 | 0.56mi |
| 25828 N 67th Dr Peoria, AZ | 4.0 | 2.5 | 2773 | $3,099 | $1.12 | 14d | 1 | 0.60mi |
| 6326 W El Cortez Pl Phoenix, AZ | 4.0 | 2.5 | 2579 | $3,450 | $1.34 | 4d | 1 | 0.60mi |
| 27383 N 69th Ln Peoria, AZ | 4.0 | 3.0 | 2084 | $2,995 | $1.44 | 9d | 1 | 0.63mi |
| 27383 N 69th Ln Peoria, AZ | 4.0 | 3.0 | 2084 | $2,995 | $1.44 | 14d | 1 | 0.63mi |
| 27513 N 63rd Dr Phoenix, AZ | 3.0 | 2.5 | 1866 | $2,395 | $1.28 | 16d | 1 | 0.63mi |
| 6964 W Buckhorn Trl Peoria, AZ | 4.0 | 3.0 | 2084 | $2,950 | $1.42 | 14d | 1 | 0.65mi |
| 6972 W Buckhorn Trl Peoria, AZ | 3.0 | 2.5 | 1989 | $2,850 | $1.43 | 3d | 1 | 0.66mi |
| 6988 W Buckhorn Trl Peoria, AZ | 5.0 | 3.0 | 2837 | $3,880 | $1.37 | 26d | 1 | 0.68mi |
| 6991 W Pinnacle Vista Dr Peoria, AZ | 3.0 | 2.5 | 1989 | $2,850 | $1.43 | 16d | 1 | 0.68mi |
| 6458 W Blue Sky Dr Phoenix, AZ | 4.0 | 3.0 | 2230 | $2,095 | $0.94 | 16d | 1 | 0.68mi |
| 6853 W Remuda Dr Peoria, AZ | 4.0 | 2.0 | 2162 | $2,550 | $1.18 | 16d | 1 | 0.69mi |
| 6999 W Pinnacle Vista Dr Peoria, AZ | 4.0 | 3.0 | 2084 | $2,950 | $1.42 | 1d | 1 | 0.69mi |
| 6889 W Paso Trl Peoria, AZ | 4.0 | 2.0 | 1854 | $2,450 | $1.32 | 14d | 1 | 0.71mi |
| 7103 W Jasmine Trl Peoria, AZ | 3.0 | 2.0 | 1962 | $2,700 | $1.38 | 26d | 1 | 0.76mi |
| 7104 W Spur Dr Peoria, AZ | 3.0 | 2.5 | 2253 | $2,700 | $1.20 | 45d | 1 | 0.76mi |
| 6424 W Saddlehorn Rd Phoenix, AZ | 4.0 | 2.0 | 1647 | $2,195 | $1.33 | 9d | 1 | 0.78mi |
| 7117 W Andrea Dr Peoria, AZ | 3.0 | 2.0 | 2012 | $2,550 | $1.27 | 45d | 1 | 0.78mi |
| 6933 W Remuda Dr Peoria, AZ | 3.0 | 2.0 | 2161 | $2,795 | $1.29 | 26d | 1 | 0.79mi |
| 25223 N 63rd Dr Phoenix, AZ | 3.0 | 2.5 | 2113 | $2,200 | $1.04 | 45d | 1 | 0.85mi |
| 6602 W Desert Hollow Dr Phoenix, AZ | 3.0 | 2.0 | 1571 | $2,150 | $1.37 | 19d | 1 | 0.85mi |
| 6602 W Desert Hollow Dr Phoenix, AZ | 3.0 | 2.0 | 1571 | $2,150 | $1.37 | 3d | 1 | 0.85mi |
| 6833 W Cottontail Ln Peoria, AZ | 4.0 | 2.0 | 2339 | $2,699 | $1.15 | 45d | 1 | 0.86mi |
| 6425 W Desert Hollow Dr Phoenix, AZ | 3.0 | 2.5 | 2295 | $2,250 | $0.98 | 7d | 1 | 0.86mi |
| 7053 W Oberlin Way Peoria, AZ | 4.0 | 2.5 | 2479 | $3,150 | $1.27 | 16d | 1 | 0.87mi |
| 6611 W Desert Hollow Dr Phoenix, AZ | 3.0 | 2.0 | 1571 | $2,350 | $1.50 | 26d | 1 | 0.88mi |
| 6427 W Silver Sage Ln Phoenix, AZ | 4.0 | 2.5 | 2318 | $2,390 | $1.03 | 12d | 1 | 0.92mi |
| 6427 W Silver Sage Ln Phoenix, AZ | 4.0 | 2.5 | 2318 | $2,415 | $1.04 | 22d | 1 | 0.92mi |
| 6017 W Running Deer Trl Phoenix, AZ | 5.0 | 3.0 | 2563 | $2,750 | $1.07 | 4d | 1 | 0.95mi |
| 6771 W Bronco Trl Peoria, AZ | 4.0 | 2.5 | 2101 | $2,500 | $1.19 | 45d | 1 | 0.95mi |
| 27807 N 59th Dr Phoenix, AZ | 5.0 | 3.0 | 2983 | $2,999 | $1.01 | 1d | 1 | 0.96mi |
| 7308 W Tombstone Trl Peoria, AZ | 3.0 | 2.5 | 2508 | $3,000 | $1.20 | 0d | 1 | 0.97mi |
| 7148 W Oberlin Way Peoria, AZ | 4.0 | 3.0 | 2490 | $2,700 | $1.08 | 45d | 1 | 1.04mi |
| 6427 W Villa Linda Dr Glendale, AZ | 3.0 | 2.0 | 1532 | $2,150 | $1.40 | 45d | 1 | 1.07mi |
| 25014 N 68th Ave Peoria, AZ | 3.0 | 2.0 | 1600 | $2,350 | $1.47 | 45d | 1 | 1.08mi |
HOA detail
- Monthly dues
- $75 · $900/yr
- Likely covers
- security
Listing history 11 events
-
2026-06-21days on market $506,999 Active 17 DOM
-
2026-06-18days on market $506,999 Active 14 DOM
-
2026-06-17days on market $506,999 Active 13 DOM
-
2026-06-16days on market $506,999 Active 12 DOM
-
2026-06-15days on market $506,999 Active 11 DOM
-
2026-06-13days on market $506,999 Active 9 DOM
-
2026-06-13days on market $506,999 Active 8 DOM
-
2026-06-09days on market $506,999 Active 5 DOM
-
2026-06-08days on market $506,999 Active 4 DOM
-
2026-06-07remarks 699-char remark
-
2026-06-07$506,999 Active 3 DOM
ⓘ Source: listings_history table (triggers on properties + properties_extension) + one-shot
backfill from property_details.listing_events for pre-trigger history.
Tax reassessment forecast AZ · Resets to sale price
- Current annual tax
- $2,300 · $192/mo
- Projected year-2 tax
- $3,346 · $279/mo
- Expected delta
- +$1,046/yr (+$87/mo · 45.5%)
ⓘ Screening estimate from a state-policy table — verify with the county assessor before closing.
Climate risk First Street
- Flood 1/10 Low FEMA zone X (shaded) · 0% chance over 30 yrs
- Wildfire 5/10 Major
- Heat 8/10 Severe 7 d/yr ≥111°F today · 16 d/yr by 30 yrs out
- Wind 1/10 Low
- Air quality 2/10 Low 2 unhealthy d/yr today · 2 by 30 yrs out
Nearby sold comps map
Loading sold comps map…
Walkable amenities ~0.75 mi
Loading nearby amenities…
Taxation est. · year 1
- Rental income
- $36,039
- − Mortgage interest
- −$28,400
- − Property taxes
- −$2,300
- − Insurance
- −$2,535
- − Repairs & maintenance
- −$2,883
- − Management
- −$2,883
- − HOA
- −$900
- − Depreciation
- −$14,749
- Taxable loss
- −$18,612
- Est. tax savings @ 24.0%
- +$4,467
- After-tax cash flow
- $-4,703/yr
For passive investors: Depreciation is non-cash, so a rental often shows a tax loss while cash-flowing — sheltering income. Rental losses are passive: they offset passive income freely, and up to $25,000/yr can offset ordinary (W-2) income if you actively participate and your MAGI is under $100k (phasing out to $0 by $150k); unused losses carry forward. On sale, claimed depreciation is recaptured at up to 25%, and gains may owe capital-gains tax (a 1031 exchange can defer both). Figures are a year-1 estimate at your 24.0% rate — not tax advice; consult a CPA.
Schools (NCES district)
- District
- Deer Valley Unified District (4246)
- NCES district ID
- 0407750
- Math proficiency
- 50% ▼ -9.00%
- Reading proficiency
- 55% ▼ -6.00%
- Median HH income
- $72,516
- Composite
- 47.0/100
- National rank
- #2346
- State rank
- #33 of 249 in AZ
Livability — Phoenix
- Score
- 75/100
- State rank
- #16
- US rank
- #3924
Category grades
Schools grade is shown separately in the Schools card above.
Census & demographics
- Census place
- Phoenix, AZ
- County
- Maricopa County · 4,537,380 people
- City population
- 1,500,198
- Metro
- Phoenix-Mesa-Chandler, AZ
- Population (ZIP)
- 21,022
- Household income
- $149,087
- Rent vs Own
- Severe rent burden
- 81.0
Population outlook (Maricopa County) Hauer SSP2
- Today (2025)
- 4,979,203 people
- By 2030
- 5,378,229 · +8.0%
- By 2040
- 6,156,598 · +23.6%
- By 2050
- 6,872,376 · +38.0%
- By 2075
- 8,401,270 · +68.7%
- By 2100
- 9,247,439 · +85.7%
Race, ethnicity, and origin ACS 2023
- Neighborhood character
- Predominantly White (74%)
- Race & ethnicity
- White 74% Asian 10% Hispanic / Latino 10% Two or more races 6% Black 2%
- Hispanic origin (detail)
- Mexican 8%
- Common ancestry
- Portuguese 3% Lithuanian 2% Scandinavian 2%
- Foreign-born
- 14% · Canada, China, Vietnam
- Languages at home
- 83% English-only · Other Indo-European 7% Other Asian/Pacific 3% Spanish 3%
Political lean MEDSL · Maricopa
- 2024 margin
- Toss-up / Even · D 47.7% · R 51.2% · Other 1.1%
- 2008→2024 swing
- +7.1pp toward D · 2008: -10.6pp · 2024: -3.5pp
- All cycles
- 2024: R+3.5 2020: D+2.2 2016: R+3.5 2012: R+12.0 2008: R+10.6
Not yet ingested
- Civics
- —
Market trends
- HPI YoY
- ▲ 14.78%
- Current HPI
- 289.2128
- Rent YoY
- ▲ 2.29%
- Metro
- Phoenix-Mesa-Chandler, AZ
- State GDP YoY
- ▲ 4.54%
- F500 in state
- 20
Industry mix (Fortune 500 HQ in AZ)
| Industry | F500 HQs | Revenue |
|---|---|---|
| Technology | 2 | $13B |
|
||
| Mining / Metals | 1 | $23B |
|
||
| Environmental Services | 1 | $16B |
|
||
| Metals / Steel | 1 | $14B |
|
||
| Technology Distribution | 1 | $9B |
|
||
| Homebuilding | 1 | $8B |
|
||
Price history
+124.4% since first listed15 events — show timeline
- 2026-06-04 Listed $506,999 ARMLS
- 2025-04-10 Listing Removed — ARMLS
- 2025-03-12 Listed $615,999 ARMLS
- 2025-02-26 Listing Removed — ARMLS
- 2025-02-18 Listed $539,900 ARMLS
- 2024-12-31 Listing Removed — ARMLS
- 2024-11-25 Price Changed $581,000 ARMLS
- 2024-11-14 Price Changed $619,000 ARMLS
- 2024-10-25 Listed $649,000 ARMLS
- 2016-03-10 Sold (Public Records) $281,000 Public Records
- 2016-02-29 Sold (MLS) $281,000 ARMLS
- 2016-01-15 Pending — ARMLS
- 2015-11-21 Listed $285,000 ARMLS
- 2010-05-09 Listing Removed — ARMLS
- 2010-04-11 Listed $225,900 ARMLS
Property tax history
+0.4%/yrLatest (2025): $2,300 · +1.0% YoY. Source: county tax records.
Cash-flow waterfall
monthlySold comps — $/sqft
last 12 mo · ≤1 miLoading sold comps…