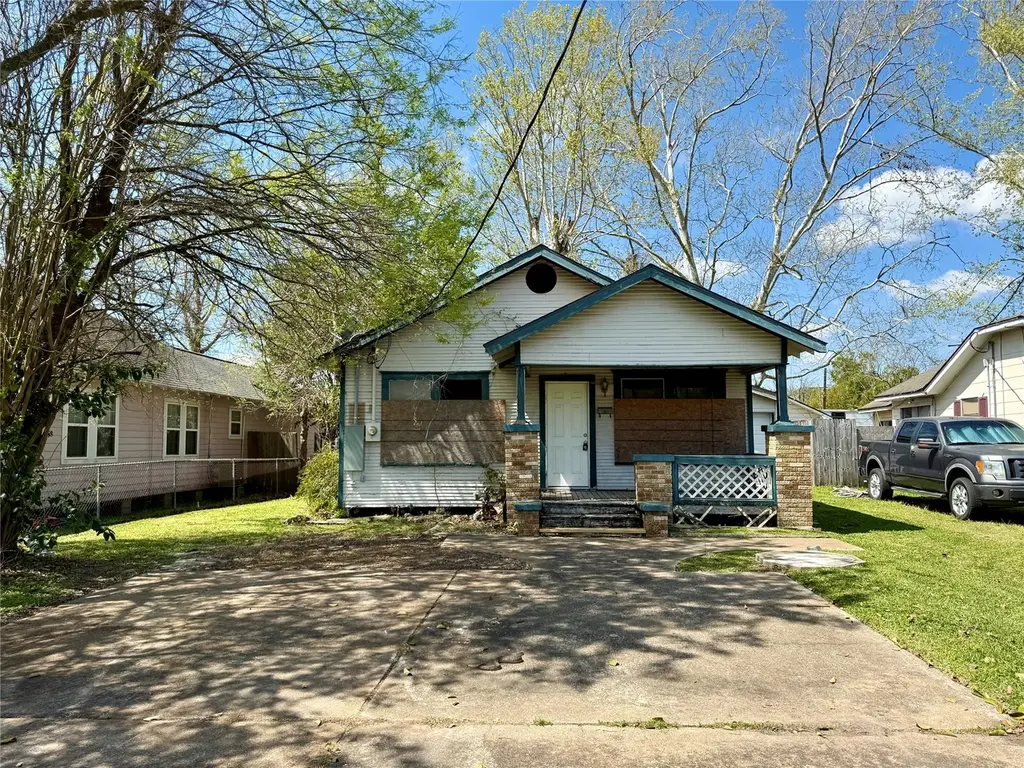
202 S Magnolia St · Highlands, TX
Flood risk No data
- FEMA flood zone
- —
- Chance of flooding over 30 yrs
- —
- Est. flood insurance / yr
- —
Fire risk No data
- Est. fire insurance / yr
- —
Heat risk No data
- Hot days now (above threshold)
- —
- Hot days in 30 yrs
- —
Wind risk No data
- Chance of severe wind over 30 yrs
- —
Air-quality risk No data
- Unhealthy air days now
- —
- Unhealthy air days in 30 yrs
- —
Risk factors via First Street. Map © Google.
Why this score? — see what drove the B- grade
The composite is a weighted blend of 9 inputs, each scored 0–100. Each bar is that input's sub-score; the figure is the points it added to the 100-point composite (weight × sub-score).
- Cash flow +27.3/30.0
- ARV discount +12.3/15.0
- DSCR +9.5/10.0
- 1% rule +7.7/10.0
- Schools +3.2/10.0
- Livability +3.2/5.0
- Rent growth +2.5/5.0
- Condition / age +2.5/5.0
- Appreciation +0.0/10.0
$172,000
🖨 Deal sheet (PDF) 📄 Offer letter ✓ Due diligence
Listing remarks MLS
Nice quiet area close to the water. Priced to move. 3 bedroom home on a nice lot.
Key facts
- 0.23 acre lot
- Built 1955
- Listed 88 days
Neighborhood map
What this means for you Summary
Snapshot
- This is a 3-bed/1.0-bath single-family listed at $172k.
Deal economics
- At list price, monthly cash flow is $497 ($6k/yr) — positive.
- The deal already cash-flows at list — no discount required.
- Meets the 1% rule at list price ($2k rent vs $172k).
- Recommended offer: $162k (6.0% below list) — sets the bar for market timing.
- Cap rate 9.8% vs local median 5.2% in Highlands — top-decile yield for the area; either an underpriced asset or a hidden risk that comps aren't pricing in. Stress-test before assuming the spread holds.
Location & tenants
- Location reads 64/100 on livability (#738 in TX) — a middle-class / working-renter tenant base. Strengths: cost of living A+, housing A+; Watch: crime C-, employment D+, schools D-.
- Goose Creek CISD (urban): math 37% / reading 36% proficiency, ranked #473 of 826 in TX (top 57%) — families likely to look elsewhere, expect single-tenant / working-renter base with shorter leases; 61% free/reduced lunch — lower-income household profile, screen leases tightly.
- Market conditions: 74 active listings in the ZIP; 2 comparable units currently listed for rent nearby; 29,883 units permitted in Harris County in 2024 (8,621 in 5+ unit buildings).
Forward outlook
- Local home prices are declining (-3.0%/yr); year-one equity from $1k of loan paydown is wiped out by about $5k of value loss. Plan a longer hold.
- Harris County population projected at +47% by 2050 — long-run rental-demand tailwind backs the buy-and-hold thesis.
- At projected returns (-3.0% appreciation + 3.0% rent growth), your $48k cash investment doubles in ~10 years — after that, you're playing with house money.
Negotiation context
- It's been on market 88 days — a 6% lower offer ($162k) is reasonable based on typical stale-listing flexibility.
- 3 sale attempts; this cycle's ask is 9197% above the opening price — seller raised mid-cycle; expect resistance to lowballs.
Risks & watch-outs
- Watch-outs: built in 1955 — expect roof / HVAC / electrical / plumbing capex.
Questions for the listing agent
- It's been on market 88 days. Have you received any prior offers? Is the seller open to a 6% concession, seller financing, or rate buy-down credit?
- Built in 1955 — when were the roof, HVAC, electrical panel, plumbing, and water heater last replaced?
- Why hasn't it sold? Are there any deal-killer items the seller is aware of (foundation, flood, title, zoning, code violations)?
- Is there a deadline driving the sale (1031 exchange, divorce, estate, relocation)? That informs how much negotiation room exists.
- Schools are D-rated, which usually means shorter tenancies and higher turnover. Who's the typical renter profile here, and what's been the actual vacancy rate?
- What's the average days-on-market for RENTAL listings here right now (not sales)? A rising rental-DOM trend means longer vacancies and softer asking-rent achievability than the comps imply.
- What's the recent tenant-quality profile in this submarket — average credit score on applications, eviction rate, late-payment / NSF rate, and stable-employment percentage? A property-management company in the area should have these aggregated.
- How much new for-sale + rental construction is in the pipeline within 1–3 miles? Heavy new supply typically softens prices + rents 12–24 months out; constrained supply supports both.
Investment metrics
- 1% rule
- 1.27% ✓
- Cap rate
- 9.76%
- Cash-on-cash
- 12.38%
- DSCR
- 1.55
- GRM
- 6.6
CMA / ARV
- ARV (median comp)
- $192,543
- List price
- $172,000
- Delta
- -10.67%
- Verdict
- UNDERPRICED
- Comps
- 20 within 1.0 mi
Show comp detail 12 sales within ~0.75 mi
| Address | Dist | Beds/Ba | Sqft | Sold | Price | $/sf | Match |
|---|---|---|---|---|---|---|---|
| 206 Avenue C | 0.04mi | 3/2.0 | 1,668 (+3%) | 10mo | $85,000 | $51 | 80 |
| 110 Kerry Rd | 0.25mi | 3/1.0 | 1,636 (+1%) | 8mo | $125,000 | $76 | 80 |
| 402 E Oak St | 0.44mi | 3/2.0 | 1,590 (-2%) | 17mo | $235,000 | $148 | 59 |
| 316 N Magnolia St | 0.39mi | 3/2.0 | 1,748 (+8%) | 7mo | $430,000 | $246 | 58 |
| 310 Hackberry Dr | 0.50mi | 3/2.0 | 1,644 (+2%) | 15mo | $219,000 | $133 | 57 |
| 327 Enfield Dr | 0.65mi | 3/2.0 | 1,569 (-3%) | 6mo | $205,000 | $131 | 56 |
| 306 Hackberry Dr | 0.52mi | 3/2.0 | 1,564 (-3%) | 14mo | $249,900 | $160 | 55 |
| 309 W Wallisville Rd | 0.31mi | 3/2.0 | 1,456 (-10%) | 14mo | $189,900 | $130 | 53 |
| 327 Brompton Ct | 0.70mi | 3/2.0 | 1,494 (-8%) | 4mo | $180,000 | $120 | 48 |
| 331 Enfield Dr | 0.66mi | 3/2.0 | 1,494 (-8%) | 9mo | $210,000 | $141 | 45 |
| 414 Enfield Dr | 0.68mi | 3/3.0 | 1,494 (-8%) | 11mo | $240,000 | $161 | 39 |
| 311 Brompton Ct | 0.67mi | 3/2.0 | 1,421 (-12%) | 12mo | $205,000 | $144 | 34 |
Match score weights: distance 35% · size 25% · config 20% · recency 20%. Top-matched comps best support the ARV.
Projected returns pro-forma
-3.0% appreciation · 3.0% rent growth · sell at horizon
- IRR
- 2.1%
- Equity multiple
- 1.08×
- Total profit
- $3,824
- Equity at exit
- $25,646
- IRR
- 11.7%
- Equity multiple
- 1.92×
- Total profit
- $44,291
- Equity at exit
- $14,871
Cash invested: $48,160 (down + closing). Projections, not guarantees.
Landlord ↔ Tenant lean methodology
- Overall (STATE)
- 87 Strongly Landlord-Friendly
- State Texas
- 87 Strongly Landlord-Friendly · R+5
- County
- — inherits STATE
- City
- — inherits STATE
ZIP-level market 77562
- Home prices YoY
- -24.9%
- Active inventory
- 74
- Price-to-rent
- 6.6×
Monthly cashflow live
- Estimated rent
- $2,177 medium interval (Pro) →
- Mortgage (P&I)
- −$902
- Tax from tax record
- −$249 /mo · $2,988/yr
- Insurance
- −$72
- HOA
- −$0
- Vacancy / Maint / Mgmt
- −$457
- Net cashflow
- $497
Break-even live
Sensitivity live
| Price | -10% $594 | -5% $545 | +0% $497 | +5% $448 | +10% $399 |
|---|---|---|---|---|---|
| Rent | -10% $325 | -5% $411 | +0% $497 | +5% $583 | +10% $669 |
| Rate | -1.0pp $583 | -0.5pp $541 | base $497 | +0.5pp $452 | +1.0pp $407 |
UW: 25.0% down · 7.5% · 30yr · 1.5% tax · 5.0% vac · 8.0% maint · 8.0% mgmt
Financing live
Cash to close
- Down payment
- $43,000
- Closing costs
- $5,160
- Reserves months
- —
- Total cash needed
- —
Loan-product check · same deal, 3 products live
Conventional
25% down · 7.5% · 30yr
- Down + closing
- —
- Monthly P&I
- —
- Monthly cashflow
- —
- DSCR
- —
- Eligible?
- —
Personal DTI + credit; lowest rate.
DSCR
20% down · 8.5% · 30yr
- Down + closing
- —
- Monthly P&I
- —
- Monthly cashflow
- —
- DSCR
- —
- Eligible?
- —
No personal income docs; deal must DSCR.
Hard money
10% down · 12.0% · 12mo
- Down + closing
- —
- Monthly P&I
- —
- Monthly cashflow
- —
- DSCR
- —
- Eligible?
- —
Short-term bridge; refi at stabilization.
Rent comps 2 comps
| Address | Beds | Baths | Sqft | Rent | $/sqft | DOM | Units | Dist |
|---|---|---|---|---|---|---|---|---|
| 508 Julie Ln Highlands, TX | 3.0 | 2.0 | 1282 | $1,750 | $1.37 | 44d | 1 | 1.05mi |
| 305 Riverside St Highlands, TX | 3.0 | 2.0 | 1404 | $2,600 | $1.85 | 3d | 1 | 1.14mi |
Listing history 26 events
-
2026-06-18days on market $172,000 Active 88 DOM
-
2026-06-17days on market $172,000 Active 87 DOM
-
2026-06-16days on market $172,000 Active 86 DOM
-
2026-06-15days on market $172,000 Active 85 DOM
-
2026-06-13days on market $172,000 Active 83 DOM
-
2026-06-09days on market $172,000 Active 79 DOM
-
2026-06-07days on market $172,000 Active 77 DOM
-
2026-06-04days on market $172,000 Active 74 DOM
-
2026-06-03days on market $172,000 Active 73 DOM
-
2026-06-02days on market $172,000 Active 72 DOM
-
2026-06-01days on market $172,000 Active 71 DOM
-
2026-05-31days on market $172,000 Active 70 DOM
-
2026-05-09price $1,550
-
2026-05-08price $172,000 81-char remark
Show marketing remark (81 chars)
Nice quiet area close to the water. Priced to move. 3 bedroom home on a nice lot.
-
2026-04-26price $1,600
-
2026-04-24price $179,000 81-char remark
Show marketing remark (81 chars)
Nice quiet area close to the water. Priced to move. 3 bedroom home on a nice lot.
-
2026-04-09price $1,650
-
2026-03-23$1,850
-
2026-03-21$185,000 Active 81-char remark
Show marketing remark (81 chars)
Nice quiet area close to the water. Priced to move. 3 bedroom home on a nice lot.
-
2026-03-17soldstatus
-
2025-11-01historical
-
2025-09-16price $115,000
-
2025-08-28$120,000 Active
-
2023-05-04soldstatus
-
2023-02-01soldstatus
-
1988-01-02soldstatus
ⓘ Source: listings_history table (triggers on properties + properties_extension) + one-shot
backfill from property_details.listing_events for pre-trigger history.
Tax reassessment forecast TX · Resets to sale price
- Current annual tax
- $2,988 · $249/mo
- Projected year-2 tax
- $3,148 · $262/mo
- Expected delta
- +$159/yr (+$13/mo · 5.3%)
ⓘ Screening estimate from a state-policy table — verify with the county assessor before closing.
Nearby sold comps map
Loading sold comps map…
Walkable amenities ~0.75 mi
Loading nearby amenities…
Taxation est. · year 1
- Rental income
- $26,119
- − Mortgage interest
- −$9,635
- − Property taxes
- −$2,988
- − Insurance
- −$860
- − Repairs & maintenance
- −$2,089
- − Management
- −$2,089
- − Depreciation
- −$5,004
- Taxable income
- $3,453
- Est. tax owed @ 24.0%
- −$829
- After-tax cash flow
- $5,133/yr
For passive investors: Depreciation is non-cash, so a rental often shows a tax loss while cash-flowing — sheltering income. Rental losses are passive: they offset passive income freely, and up to $25,000/yr can offset ordinary (W-2) income if you actively participate and your MAGI is under $100k (phasing out to $0 by $150k); unused losses carry forward. On sale, claimed depreciation is recaptured at up to 25%, and gains may owe capital-gains tax (a 1031 exchange can defer both). Figures are a year-1 estimate at your 24.0% rate — not tax advice; consult a CPA.
Schools (NCES district)
- District
- Goose Creek CISD
- NCES district ID
- 4821150
- Math proficiency
- 37% ▼ -11.00%
- Reading proficiency
- 36% ▼ -4.00%
- Median HH income
- $52,468
- Composite
- 31.84/100
- National rank
- #5877
- State rank
- #473 of 826 in TX
Livability — Highlands
- Score
- 64/100
- State rank
- #738
- US rank
- #13697
Category grades
Schools grade is shown separately in the Schools card above.
Census & demographics
- Census place
- Highlands, TX
- City population
- 9,805
- Population (ZIP)
- 9,805
Population outlook (Harris County) Hauer SSP2
- Today (2025)
- 5,571,493 people
- By 2030
- 6,089,821 · +9.3%
- By 2040
- 7,142,806 · +28.2%
- By 2050
- 8,185,864 · +46.9%
- By 2075
- 10,574,329 · +89.8%
- By 2100
- 12,109,958 · +117.4%
Race, ethnicity, and origin ACS 2023
- Neighborhood character
- Diverse neighborhood (Simpson 0.62)
- Race & ethnicity
- White 48% Hispanic / Latino 38% Two or more races 19% Black 7% Native American 2%
- Hispanic origin (detail)
- Mexican 30%
- Common ancestry
- Lithuanian 2% Italian 1% Iranian 1%
- Foreign-born
- 15% · Canada, Jamaica
- Languages at home
- 69% English-only · Spanish 29% German/W. Germanic 1%
Political lean MEDSL · Harris
- 2024 margin
- Lean D (+5.5) · D 52.0% · R 46.4% · Other 1.6%
- 2008→2024 swing
- +3.9pp toward D · 2008: 1.6pp · 2024: 5.5pp
- All cycles
- 2024: D+5.5 2020: D+13.3 2016: D+12.4 2012: D+0.1 2008: D+1.6
Not yet ingested
- Civics
- —
Market trends
- HPI YoY
- ▼ -100.57%
- Current HPI
- 303.5126
- Rent YoY
- —
- Metro
- —
- State GDP YoY
- ▲ 3.95%
- F500 in state
- 110
Industry mix (Fortune 500 HQ in TX)
| Industry | F500 HQs | Revenue |
|---|---|---|
| Energy | 16 | $1,198B |
|
||
| Technology | 5 | $198B |
|
||
| Engineering / Construction | 4 | $72B |
|
||
| Energy Services | 3 | $60B |
|
||
| Utilities | 3 | $41B |
|
||
| Healthcare | 2 | $330B |
|
||
Price history
-98.7% since first listed14 events — show timeline
- 2026-05-09 Price Changed $1,550 HARMLS
- 2026-05-08 Price Changed $172,000 HARMLS
- 2026-04-26 Price Changed $1,600 HARMLS
- 2026-04-24 Price Changed $179,000 HARMLS
- 2026-04-09 Price Changed $1,650 HARMLS
- 2026-03-23 Listed for Rent $1,850 HARMLS
- 2026-03-21 Listed $185,000 HARMLS
- 2026-03-17 Sold (Public Records) — Public Records
- 2025-11-01 Listing Removed — HARMLS
- 2025-09-16 Price Changed $115,000 HARMLS
- 2025-08-28 Listed $120,000 HARMLS
- 2023-05-04 Sold (Public Records) — Public Records
- 2023-02-01 Sold (Public Records) — Public Records
- 1988-01-02 Sold (Public Records) — Public Records
Property tax history
+10.5%/yrLatest (2025): $2,988 · +1.5% YoY. Source: county tax records.
Cash-flow waterfall
monthlySold comps — $/sqft
last 12 mo · ≤1 miLoading sold comps…