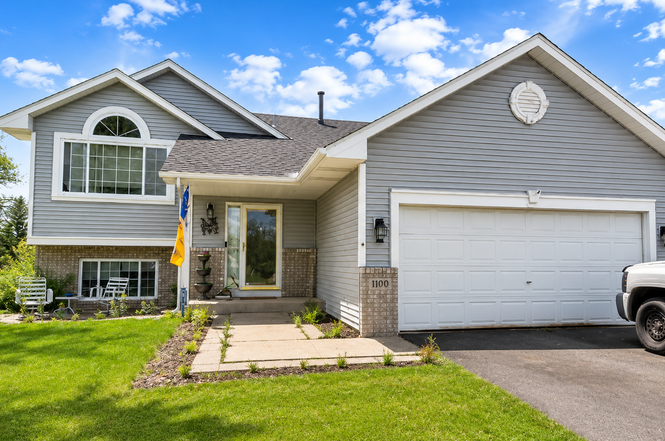
1100 Kilbirnie Rd · Big Lake, MN
Flood risk 1/10 · Minimal
- FEMA flood zone
- X (unshaded)
- Chance of flooding over 30 yrs
- 0.0%
- Est. flood insurance / yr
- $473 – $860
Fire risk 4/10 · Minor
- Est. fire insurance / yr
- $888 – $1,650
Heat risk 2/10 · Minimal
- Hot days now (above 99°F)
- 7 days/yr
- Hot days in 30 yrs
- 14 days/yr
Wind risk 2/10 · Minimal
- Chance of severe wind over 30 yrs
- —
Air-quality risk 2/10 · Minimal
- Unhealthy air days now
- 2 days/yr
- Unhealthy air days in 30 yrs
- 2 days/yr
Risk factors via First Street. Map © Google.
Why this score? — see what drove the D+ grade
The composite is a weighted blend of 9 inputs, each scored 0–100. Each bar is that input's sub-score; the figure is the points it added to the 100-point composite (weight × sub-score).
- ARV discount +15.0/15.0
- Cash flow +11.9/30.0
- Schools +4.6/10.0
- Livability +4.0/5.0
- 1% rule +3.6/10.0
- DSCR +3.5/10.0
- Rent growth +2.5/5.0
- Condition / age +2.5/5.0
- Appreciation +0.0/10.0
$309,900
🖨 Deal sheet (PDF) 📄 Offer letter ✓ Due diligence
Listing remarks MLS
Your home for the holidays! Welcome to this updated split level within walking distance to Lake Mitchell and Big Lake! Enter to a spacious two-story foyer and head up to the main level featuring bright windows, vaulted ceilings, plus new flooring and lighting. The living room leads into the kitchen and dining room to make hosting a breeze. The kitchen is complete with stainless steel appliances and a peninsula for additional storage and prep space as well as breakfast bar seating. Step out to the deck and spend quiet mornings sipping coffee or grilling dinner in the evenings. Two of the four bedrooms, both with walk-in closets and the full bathroom complete this level. Downstairs, the spacious family room includes an amusement area and walks out to the fenced-in back yard. Enjoy the convenient location near parks and trails around the lakes, and just minutes to a variety of shops and restaurants.
Key facts
- Large deck
- Oak cabinetry
- Walkout lower level
Tags
Property features AI
Finance
- Financial info: Conventional financing available; Other annual assessment amount listed
Exterior
- Parking: Attached 3-car garage (22 x 30, 7' garage door height, 16' garage door width)
- Utilities: City water (connected); City sewer (connected); Natural gas; Electric service with circuit breakers, 100 amp
- Home design: Residential split-entry (bi-level) home; Facing direction not specified; Entry level details not specified
- Construction: Block and frame construction; Asphalt roof (age 8 years or less); Block foundation (foundation area 960)
- Exterior features: Deck; Stone and vinyl exterior; Chain link fencing; Medium tree coverage
Interior
- Kitchen: Range; Microwave; Dishwasher; Refrigerator; Stainless steel appliances
- Bedrooms: 4 bedrooms (three on main level and lower-level bedroom) — includes Bedroom 2 and Bedroom 3 on lower level and bedrooms on main
- Bathrooms: Main floor full bathroom; Basement three-quarter bathroom
- Heating & cooling: Forced air heating; Central air conditioning
- Interior features: Finished full basement with walkout and sump pump; Informal dining area combined with kitchen; Water softener (owned); Stainless steel appliances
- Laundry & utility: Main/lower level laundry room; Washer; Dryer; Gas water heater
Neighborhood map
What this means for you Summary
Snapshot
- This is a 4-bed/2.0-bath single-family listed at $310k.
Deal economics
- At list price, monthly cash flow is $-78 ($-941/yr) — negative.
- To cash-flow at today's rent, offer at most $296k (4.5% below list).
- To meet the 1% rule (rent ≥ 1% of price), the offer needs to be $266k (14.3% below list).
- Recommended offer: $266k (14.3% below list) — sets the bar for 1% rule.
- Cap rate 6.0% vs local median 4.0% in Big Lake — top-decile yield for the area; either an underpriced asset or a hidden risk that comps aren't pricing in. Stress-test before assuming the spread holds.
Location & tenants
- Location reads 80/100 on livability (#84 in MN, #1,950 nationally) — a professional / high-income tenant draw. Strengths: crime A+, employment A+, housing A+; Watch: amenities F, commute F.
- Big Lake Public School District (town): math 47% / reading 55% proficiency, ranked #78 of 301 in MN (top 26%) — acceptable for families but not a draw, mixed tenant base, ~2y average lease; only 19% free/reduced lunch — higher-income household profile.
- Zoned schools: Independence Elementary (math 53% / reading 57%, grade C, #310 of 857 statewide, top 37%, 660 students, 40% FRL); Big Lake Middle School (math 43% / reading 52%, grade C-, #93 of 258 statewide, top 37%, 686 students, 40% FRL); Big Lake Senior High (math 42% / reading 62%, grade D+, #111 of 471 statewide, top 26%, 899 students, 30% FRL) — zoned schools average 37% FRL vs 19% district-wide (17 pts higher); higher-poverty schools than district average — tighter screening recommended.
- Market conditions: 125 active listings in the ZIP; 4 comparable units currently listed for rent nearby; rentals leasing fast (median 13d on market — plan ~1-2 weeks tenant-placement turnaround); high-income renter base; 334 units permitted in Sherburne County in 2024 (58 in 5+ unit buildings).
Forward outlook
- Local home prices are declining (-3.0%/yr); year-one equity from $2k of loan paydown is wiped out by about $9k of value loss. Plan a longer hold.
Negotiation context
- Only 4 days on market — expect competitive offers; lowballing is unlikely to land.
- 5 sale attempts since 26y ago with the ask held roughly flat each time — persistent listings suggest the price (not the market) is what's stuck; bring a comps-based counter.
- Current owner paid $226k; 37% above their basis — modest negotiation headroom, anchor on the comps not their cost.
Questions for the listing agent
- What do current leases actually rent for vs. the listed asking? Can we see a recent rent roll and the last 12 months of T-12 income?
- Is there a deadline driving the sale (1031 exchange, divorce, estate, relocation)? That informs how much negotiation room exists.
- Schools are A-rated — typically a magnet for longer-tenancy family renters. What's the average tenant stay here, and is there a school-zone premium baked into asking?
- The area grade is low — what's the realistic commute time and amenity access for the typical tenant pool here? Any planned neighborhood developments (good or bad) we should know about?
- What's the average days-on-market for RENTAL listings here right now (not sales)? A rising rental-DOM trend means longer vacancies and softer asking-rent achievability than the comps imply.
- What's the recent tenant-quality profile in this submarket — average credit score on applications, eviction rate, late-payment / NSF rate, and stable-employment percentage? A property-management company in the area should have these aggregated.
- How much new for-sale + rental construction is in the pipeline within 1–3 miles? Heavy new supply typically softens prices + rents 12–24 months out; constrained supply supports both.
Investment metrics
- 1% rule
- 0.86% ✗
- Cap rate
- 5.99%
- Cash-on-cash
- -1.08%
- DSCR
- 0.95
- GRM
- 9.7
CMA / ARV
- ARV (on-the-fly)
- $561,540
- Comps found
- 1
Show comp detail 1 sale within ~0.75 mi
| Address | Dist | Beds/Ba | Sqft | Sold | Price | $/sf | Match |
|---|---|---|---|---|---|---|---|
| 1491 Hiawatha Ave | 0.42mi | 4/3.0 | 2,100 (+10%) | 0mo | $618,000 | $294 | 59 |
Match score weights: distance 35% · size 25% · config 20% · recency 20%. Top-matched comps best support the ARV.
Projected returns pro-forma
-3.0% appreciation · 3.0% rent growth · sell at horizon
- IRR
- -18.1%
- Equity multiple
- 0.36×
- Total profit
- $-55,150
- Equity at exit
- $46,207
- IRR
- -10.2%
- Equity multiple
- 0.38×
- Total profit
- $-54,206
- Equity at exit
- $26,794
Cash invested: $86,772 (down + closing). Projections, not guarantees.
Landlord ↔ Tenant lean methodology
- Overall (STATE)
- 46 Balanced
- State Minnesota
- 46 Balanced · D+2
- County
- — inherits STATE
- City
- — inherits STATE
ZIP-level market 55309
- Home prices YoY
- -30.7%
- Active inventory
- 125
- Price-to-rent
- 9.7×
Monthly cashflow live
- Estimated rent
- $2,655 medium interval (Pro) →
- Mortgage (P&I)
- −$1,625
- Tax from tax record
- −$422 /mo · $5,060/yr
- Insurance
- −$129
- HOA
- −$0
- Lot rent
- −$0
- Vacancy / Maint / Mgmt
- −$558
- Net cashflow
- $-78
Break-even live
Sensitivity live
| Price | -10% $97 | -5% $9 | +0% $-78 | +5% $-166 | +10% $-254 |
|---|---|---|---|---|---|
| Rent | -10% $-288 | -5% $-183 | +0% $-78 | +5% $26 | +10% $131 |
| Rate | -1.0pp $78 | -0.5pp $0 | base $-78 | +0.5pp $-159 | +1.0pp $-240 |
UW: 25.0% down · 7.5% · 30yr · 1.5% tax · 5.0% vac · 8.0% maint · 8.0% mgmt
Financing live
Cash to close
- Down payment
- $77,475
- Closing costs
- $9,297
- Reserves months
- —
- Total cash needed
- —
Loan-product check · same deal, 3 products live
Conventional
25% down · 7.5% · 30yr
- Down + closing
- —
- Monthly P&I
- —
- Monthly cashflow
- —
- DSCR
- —
- Eligible?
- —
Personal DTI + credit; lowest rate.
DSCR
20% down · 8.5% · 30yr
- Down + closing
- —
- Monthly P&I
- —
- Monthly cashflow
- —
- DSCR
- —
- Eligible?
- —
No personal income docs; deal must DSCR.
Hard money
10% down · 12.0% · 12mo
- Down + closing
- —
- Monthly P&I
- —
- Monthly cashflow
- —
- DSCR
- —
- Eligible?
- —
Short-term bridge; refi at stabilization.
Rent comps 4 comps
| Address | Beds | Baths | Sqft | Rent | $/sqft | DOM | Units | Dist |
|---|---|---|---|---|---|---|---|---|
| 5535 Highland Trl Big Lake, MN | 4.0 | 1.5 | 1904 | $2,619 | $1.38 | 0d | 1 | 0.28mi |
| 21476 Lena Trl Big Lake, MN | 5.0 | 2.5 | 2150 | $2,600 | $1.21 | 12d | 1 | 0.58mi |
| 5726 Egret Ave Big Lake, MN | 4.0 | 2.0 | 1894 | $2,600 | $1.37 | 0d | 1 | 0.81mi |
| 4702 Blanding Ct Big Lake, MN | 4.0 | 2.0 | 1768 | $2,500 | $1.41 | 12d | 1 | 0.88mi |
Listing history 4 events
-
2026-06-22days on market $309,900 Active 4 DOM
-
2026-06-21days on market $309,900 Active 3 DOM
-
2026-06-19remarks 662-char remark
-
2026-06-19$309,900 Active 1 DOM
ⓘ Source: listings_history table (triggers on properties + properties_extension) + one-shot
backfill from property_details.listing_events for pre-trigger history.
Tax reassessment forecast MN · Partial reset (capped growth)
- Current annual tax
- $5,060 · $422/mo
- Projected year-2 tax
- $5,060 · $422/mo
- Expected delta
- $0/yr ($0/mo · 0.0%)
ⓘ Screening estimate from a state-policy table — verify with the county assessor before closing.
Climate risk First Street
- Flood 1/10 Low FEMA zone X (unshaded) · 0% chance over 30 yrs
- Wildfire 4/10 Moderate
- Heat 2/10 Low 7 d/yr ≥99°F today · 14 d/yr by 30 yrs out
- Wind 2/10 Low
- Air quality 2/10 Low 2 unhealthy d/yr today · 2 by 30 yrs out
Nearby sold comps map
Loading sold comps map…
Walkable amenities ~0.75 mi
Loading nearby amenities…
Taxation est. · year 1
- Rental income
- $31,861
- − Mortgage interest
- −$17,359
- − Property taxes
- −$5,060
- − Insurance
- −$1,550
- − Repairs & maintenance
- −$2,549
- − Management
- −$2,549
- − Depreciation
- −$9,015
- Taxable loss
- −$6,221
- Est. tax savings @ 24.0%
- +$1,493
- After-tax cash flow
- $552/yr
For passive investors: Depreciation is non-cash, so a rental often shows a tax loss while cash-flowing — sheltering income. Rental losses are passive: they offset passive income freely, and up to $25,000/yr can offset ordinary (W-2) income if you actively participate and your MAGI is under $100k (phasing out to $0 by $150k); unused losses carry forward. On sale, claimed depreciation is recaptured at up to 25%, and gains may owe capital-gains tax (a 1031 exchange can defer both). Figures are a year-1 estimate at your 24.0% rate — not tax advice; consult a CPA.
Schools (NCES district)
- District
- Big Lake Public School District
- NCES district ID
- 2705460
- Math proficiency
- 47% ▼ -16.00%
- Reading proficiency
- 55% ▼ -8.00%
- Median HH income
- $75,817
- Composite
- 46.06/100
- National rank
- #2519
- State rank
- #78 of 301 in MN
Livability — Big Lake
- Score
- 80/100
- State rank
- #84
- US rank
- #1950
Category grades
Schools grade is shown separately in the Schools card above.
Census & demographics
- Census place
- Big Lake, MN
- County
- Sherburne County · 120,363 people
- City population
- 21,378
- Metro
- Minneapolis-St. Paul-Bloomington, MN-WI
- Population (ZIP)
- 21,378
- Household income
- $121,711
- Rent vs Own
- Severe rent burden
- 90.0
Population outlook (Sherburne County) Hauer SSP2
- Today (2025)
- 97,402 people
- By 2030
- 99,341 · +2.0%
- By 2040
- 101,188 · +3.9%
- By 2050
- 99,214 · +1.9%
- By 2075
- 88,700 · -8.9%
- By 2100
- 72,241 · -25.8%
Race, ethnicity, and origin ACS 2023
- Neighborhood character
- Predominantly White (90%)
- Race & ethnicity
- White 90% Hispanic / Latino 4% Two or more races 4% Black 2%
- Common ancestry
- Portuguese 14% Romanian 6% Italian 2%
- Foreign-born
- 3% · Canada
- Languages at home
- 96% English-only · Spanish 3%
Political lean MEDSL · Sherburne
- 2024 margin
- Solid R (+34.9) · D 31.7% · R 66.6% · Other 1.7%
- 2008→2024 swing
- -16.7pp toward R · 2008: -18.2pp · 2024: -34.9pp
- All cycles
- 2024: R+34.9 2020: R+32.6 2016: R+37.0 2012: R+22.1 2008: R+18.2
Not yet ingested
- Civics
- —
Market trends
- HPI YoY
- ▼ -106.02%
- Current HPI
- 238.8781
- Rent YoY
- —
- Metro
- Minneapolis-St. Paul-Bloomington, MN-WI
- State GDP YoY
- ▲ 2.41%
- F500 in state
- 34
Industry mix (Fortune 500 HQ in MN)
| Industry | F500 HQs | Revenue |
|---|---|---|
| Healthcare | 2 | $407B |
|
||
| Retail | 2 | $150B |
|
||
| Consumer Goods | 2 | $32B |
|
||
| Industrial Machinery | 2 | $6B |
|
||
| Agriculture | 1 | $40B |
|
||
| Healthcare / Medical Devices | 1 | $32B |
|
||
Price history
+148.1% since first listed18 events — show timeline
- 2026-06-17 Listed $309,900 NORTHSTARMLS as Distributed by MLS Grid
- 2019-11-14 Sold (Public Records) $226,000 Public Records
- 2019-10-30 Sold (MLS) $226,000 NORTHSTARMLS as Distributed by MLS Grid
- 2019-10-01 Pending — NORTHSTARMLS as Distributed by MLS Grid
- 2019-09-26 Contingent — NORTHSTARMLS as Distributed by MLS Grid
- 2019-09-19 Listed $225,000 NORTHSTARMLS as Distributed by MLS Grid
- 2019-06-25 Listing Removed — NORTHSTARMLS as Distributed by MLS Grid
- 2019-06-25 Pending — NORTHSTARMLS as Distributed by MLS Grid
- 2019-06-15 Contingent — NORTHSTARMLS as Distributed by MLS Grid
- 2019-06-13 Listed $220,000 NORTHSTARMLS as Distributed by MLS Grid
- 2017-05-31 Sold (Public Records) $198,000 Public Records
- 2017-05-19 Sold (MLS) $198,000 NORTHSTARMLS as Distributed by MLS Grid
- 2017-05-02 Pending — NORTHSTARMLS as Distributed by MLS Grid
- 2017-03-30 Contingent — NORTHSTARMLS as Distributed by MLS Grid
- 2017-03-16 Listed $198,000 NORTHSTARMLS as Distributed by MLS Grid
- 2000-05-31 Sold (MLS) $131,900 NORTHSTARMLS as Distributed by MLS Grid
- 2000-05-05 Listing Removed — NORTHSTARMLS as Distributed by MLS Grid
- 2000-03-23 Listed $124,900 NORTHSTARMLS as Distributed by MLS Grid
Property tax history
+5.0%/yrLatest (2025): $5,060 · +38.6% YoY. Source: county tax records.
Cash-flow waterfall
monthlySold comps — $/sqft
last 12 mo · ≤1 miLoading sold comps…