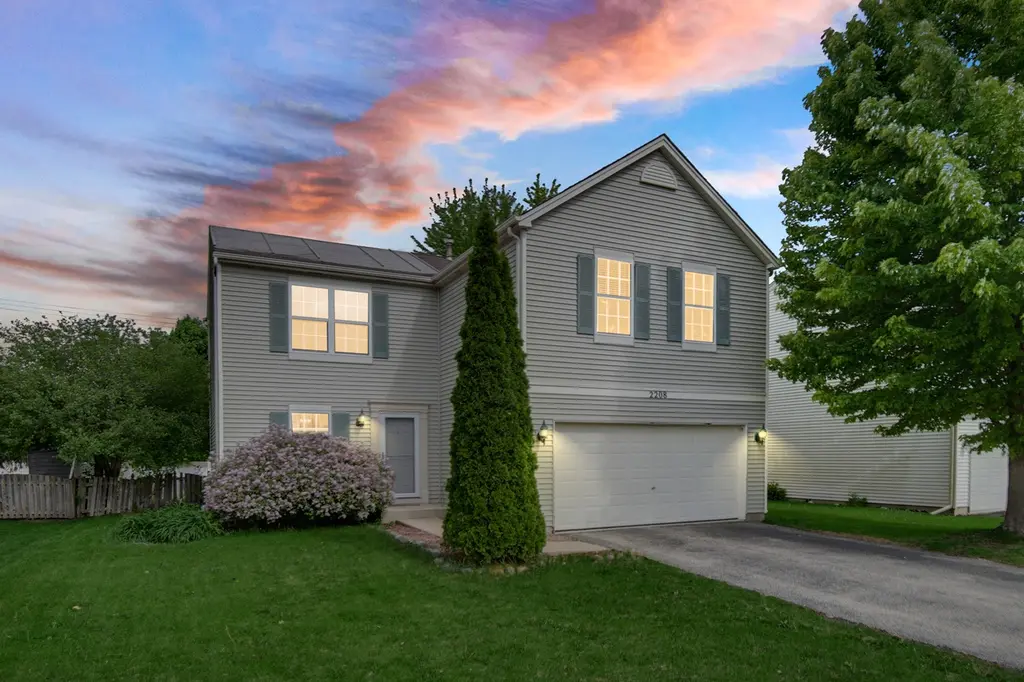
2208 Cherry Ridge Dr · Joliet, IL
Flood risk 1/10 · Minimal
- FEMA flood zone
- X (unshaded)
- Chance of flooding over 30 yrs
- 0.0%
- Est. flood insurance / yr
- $473 – $860
Fire risk 1/10 · Minimal
- Est. fire insurance / yr
- $804 – $1,492
Heat risk 3/10 · Minor
- Hot days now (above 102°F)
- 7 days/yr
- Hot days in 30 yrs
- 15 days/yr
Wind risk 2/10 · Minimal
- Chance of severe wind over 30 yrs
- 1.0%
Air-quality risk 3/10 · Minor
- Unhealthy air days now
- 3 days/yr
- Unhealthy air days in 30 yrs
- 4 days/yr
Risk factors via First Street. Map © Google.
Why this score? — see what drove the C- grade
The composite is a weighted blend of 9 inputs, each scored 0–100. Each bar is that input's sub-score; the figure is the points it added to the 100-point composite (weight × sub-score).
- ARV discount +15.0/15.0
- Cash flow +14.3/30.0
- 1% rule +4.8/10.0
- DSCR +4.4/10.0
- Livability +3.9/5.0
- Rent growth +3.6/5.0
- Schools +2.9/10.0
- Condition / age +2.5/5.0
- Appreciation +0.0/10.0
$292,900
🖨 Deal sheet (PDF) 📄 Offer letter ✓ Due diligence
Listing remarks MLS
Perfect 2 Story Home in a Quiet Cul de Sac. Lovely Fenced Yard with huge deck ideal for entertaining. This home offers a spacious open concept Layout. Great location, with walking distance to bike trail/path and much more. Well maintained.
Key facts
- 7,840 sq ft lot
- 2 garage spots
- Built 2001
Neighborhood map
What this means for you Summary
Snapshot
- This is a 3-bed/1.5-bath single-family listed at $293k.
Deal economics
- At list price, monthly cash flow is $55 ($664/yr) — positive.
- The deal already cash-flows at list — no discount required.
- To meet the 1% rule (rent ≥ 1% of price), the offer needs to be $288k (1.7% below list).
- Recommended offer: $284k (3.0% below list) — sets the bar for market timing.
- Cap rate 6.5% vs local median 4.8% in Joliet — top-decile yield for the area; either an underpriced asset or a hidden risk that comps aren't pricing in. Stress-test before assuming the spread holds.
Location & tenants
- Location reads 78/100 on livability (#153 in IL, #2,772 nationally) — a middle-class / working-renter tenant base. Strengths: commute A+, housing A+, cost of living A; Watch: amenities C-, health & safety C-.
- Plainfield SD 202 (suburban): math 25% / reading 32% proficiency, ranked #213 of 620 in IL (top 34%) — low school quality limits family demand, transient renter base, plan for 1-2y turnover; only 17% free/reduced lunch — higher-income household profile.
- Zoned schools: Ridge Elementary School (math 17% / reading 28%, grade F, #934 of 2,056 statewide, top 46%, 501 students, 0% FRL); Drauden Point Middle School (math 17% / reading 29%, grade F, #377 of 665 statewide, top 58%, 688 students, 0% FRL); Plainfield South High School (math 21% / reading 25%, grade F, #312 of 693 statewide, top 46%, 2,411 students, 0% FRL) — zoned schools average 0% FRL vs 17% district-wide (17 pts lower); this property's tenant base skews higher-income than the district average.
- Market conditions: Rents rising fast (+4.3%/yr); 114 active listings in the ZIP; 13 comparable units currently listed for rent nearby; rentals at typical pace (median 21d on market — plan ~3-4 weeks tenant-placement turnaround); 46% of comp listings sitting > 30 days — soft ceiling on asking rent; high-income renter base; 2,028 units permitted in Will County in 2024 (530 in 5+ unit buildings).
Forward outlook
- Local home prices are declining (-3.0%/yr); year-one equity from $2k of loan paydown is wiped out by about $9k of value loss. Plan a longer hold.
- Will County population projected to shrink 4% by 2050 — rents likely to lag national; underwrite the cash flow, not the appreciation.
Negotiation context
- It's been on market 43 days — a 3% lower offer ($284k) is reasonable based on typical stale-listing flexibility.
- 5 sale attempts since 14y ago with the ask held roughly flat each time — persistent listings suggest the price (not the market) is what's stuck; bring a comps-based counter.
- Current owner paid $209k; 40% above their basis — modest negotiation headroom, anchor on the comps not their cost.
Questions for the listing agent
- It's been on market 43 days. Have you received any prior offers? Is the seller open to a 3% concession, seller financing, or rate buy-down credit?
- What does the HOA fee cover, when was the last increase, and are there any pending special assessments or reserve-fund shortfalls?
- Is there a deadline driving the sale (1031 exchange, divorce, estate, relocation)? That informs how much negotiation room exists.
- Schools are F-rated, which usually means shorter tenancies and higher turnover. Who's the typical renter profile here, and what's been the actual vacancy rate?
- What's the average days-on-market for RENTAL listings here right now (not sales)? A rising rental-DOM trend means longer vacancies and softer asking-rent achievability than the comps imply.
- What's the recent tenant-quality profile in this submarket — average credit score on applications, eviction rate, late-payment / NSF rate, and stable-employment percentage? A property-management company in the area should have these aggregated.
- How much new for-sale + rental construction is in the pipeline within 1–3 miles? Heavy new supply typically softens prices + rents 12–24 months out; constrained supply supports both.
Investment metrics
- 1% rule
- 0.98% ✗
- Cap rate
- 6.52%
- Cash-on-cash
- 0.81%
- DSCR
- 1.04
- GRM
- 8.5
CMA / ARV
- ARV (median comp)
- $375,610
- List price
- $292,900
- Delta
- -22.02%
- Verdict
- UNDERPRICED
- Comps
- 20 within 1.0 mi
Show comp detail 12 sales within ~0.75 mi
| Address | Dist | Beds/Ba | Sqft | Sold | Price | $/sf | Match |
|---|---|---|---|---|---|---|---|
| 2310 Gray Hawk Dr | 0.17mi | 3/2.5 | 1,754 (+1%) | 7mo | $405,000 | $231 | 81 |
| 6302 Meadow Ridge Dr | 0.38mi | 3/1.5 | 1,758 (+1%) | 8mo | $335,000 | $191 | 75 |
| 25011 W Ann Ct | 0.40mi | 3/3.5 | 1,791 (+3%) | 2mo | $385,000 | $215 | 67 |
| 6510 Jack Rogers Ln | 0.71mi | 3/1.5 | 1,792 (+3%) | 2mo | $360,000 | $201 | 61 |
| 1902 Westmore Grove Dr | 0.74mi | 3/2.5 | 1,753 (+0%) | 1mo | $360,000 | $205 | 60 |
| 6512 Jack Rogers Ln | 0.73mi | 3/2.0 | 1,792 (+3%) | 1mo | $365,000 | $204 | 58 |
| 2006 Westmore Grove Dr | 0.62mi | 3/2.5 | 1,694 (-3%) | 8mo | $330,000 | $195 | 55 |
| 2509 Ruth Fitzgerald Dr | 0.71mi | 3/2.0 | 1,792 (+3%) | 9mo | $285,000 | $159 | 53 |
| 1891 Westmore Grove Dr | 0.73mi | 3/2.5 | 1,694 (-3%) | 6mo | $385,000 | $227 | 52 |
| 2033 Ridge Moor Dr | 0.46mi | 3/2.5 | 1,563 (-10%) | 8mo | $308,000 | $197 | 51 |
| 2110 Wynham Lakes Ct | 0.54mi | 3/2.0 | 1,968 (+13%) | 1mo | $385,000 | $196 | 50 |
| 2117 Wesmere Lakes Dr | 0.62mi | 4/2.5 (+1) | 1,920 (+10%) | 2mo | $395,000 | $206 | 44 |
Match score weights: distance 35% · size 25% · config 20% · recency 20%. Top-matched comps best support the ARV.
Projected returns pro-forma
-3.0% appreciation · 4.29% rent growth · sell at horizon
- IRR
- -13.4%
- Equity multiple
- 0.51×
- Total profit
- $-39,989
- Equity at exit
- $43,672
- IRR
- -2.3%
- Equity multiple
- 0.83×
- Total profit
- $-13,669
- Equity at exit
- $25,325
Cash invested: $82,012 (down + closing). Projections, not guarantees.
Landlord ↔ Tenant lean methodology
- Overall (STATE)
- 43 Moderately Tenant-Leaning
- State Illinois
- 43 Moderately Tenant-Leaning · D+7
- County
- — inherits STATE
- City
- — inherits STATE
ZIP-level market 60586
- Home prices YoY
- -33.7%
- Rents YoY
- 4.3%
- Active inventory
- 114
- Price-to-rent
- 8.5×
Monthly cashflow live
- Estimated rent
- $2,880 high interval (Pro) →
- Mortgage (P&I)
- −$1,536
- Tax from tax record
- −$545 /mo · $6,541/yr
- Insurance
- −$122
- HOA
- −$17
- Vacancy / Maint / Mgmt
- −$605
- Net cashflow
- $55
Break-even live
Sensitivity live
| Price | -10% $221 | -5% $138 | +0% $55 | +5% $-28 | +10% $-110 |
|---|---|---|---|---|---|
| Rent | -10% $-172 | -5% $-58 | +0% $55 | +5% $169 | +10% $283 |
| Rate | -1.0pp $203 | -0.5pp $130 | base $55 | +0.5pp $-21 | +1.0pp $-98 |
UW: 25.0% down · 7.5% · 30yr · 1.5% tax · 5.0% vac · 8.0% maint · 8.0% mgmt
Financing live
Cash to close
- Down payment
- $73,225
- Closing costs
- $8,787
- Reserves months
- —
- Total cash needed
- —
Loan-product check · same deal, 3 products live
Conventional
25% down · 7.5% · 30yr
- Down + closing
- —
- Monthly P&I
- —
- Monthly cashflow
- —
- DSCR
- —
- Eligible?
- —
Personal DTI + credit; lowest rate.
DSCR
20% down · 8.5% · 30yr
- Down + closing
- —
- Monthly P&I
- —
- Monthly cashflow
- —
- DSCR
- —
- Eligible?
- —
No personal income docs; deal must DSCR.
Hard money
10% down · 12.0% · 12mo
- Down + closing
- —
- Monthly P&I
- —
- Monthly cashflow
- —
- DSCR
- —
- Eligible?
- —
Short-term bridge; refi at stabilization.
Rent comps 13 comps
| Address | Beds | Baths | Sqft | Rent | $/sqft | DOM | Units | Dist |
|---|---|---|---|---|---|---|---|---|
| 2529 Stonybrook Dr Plainfield, IL | 3.0 | 2.5 | 1382 | $2,550 | $1.85 | 12d | 1 | 0.72mi |
| 5440 Sugarloaf Ct Plainfield, IL | 3.0 | 2.5 | 1684 | $2,595 | $1.54 | 45d | 1 | 0.92mi |
| 2808 River Bend Ln Plainfield, IL | 3.0 | 2.5 | 1748 | $2,800 | $1.60 | 45d | 1 | 1.00mi |
| 2914 Frank Turk Dr Plainfield, IL | 4.0 | 2.0 | 1792 | $2,800 | $1.56 | 45d | 1 | 1.09mi |
| 6906 Townsend Blvd Plainfield, IL | 3.0 | 2.0 | 1528 | $2,700 | $1.77 | 20d | 1 | 1.12mi |
| 2105 Three Forks Dr Plainfield, IL | 3.0 | 2.0 | 1528 | $2,631 | $1.72 | 0d | 1 | 1.16mi |
| 5117 Woodmere Ct Plainfield, IL | 3.0 | 2.5 | 1728 | $3,500 | $2.03 | 4d | 1 | 1.39mi |
| 2625 Canyon Dr Unit 2625 Plainfield, IL | 3.0 | 2.5 | 1280 | $2,495 | $1.95 | 45d | 1 | 1.40mi |
| 7211 Bradley Dr Plainfield, IL | 3.0 | 1.5 | 1316 | $2,399 | $1.82 | 20d | 1 | 1.43mi |
| 7211 Bradley Dr Plainfield, IL | 3.0 | 1.5 | 1316 | $2,299 | $1.75 | 45d | 1 | 1.43mi |
| 7211 Bradley Dr Plainfield, IL | 4.0 | 1.5 | 1316 | $2,399 | $1.82 | 17d | 1 | 1.43mi |
| 2745 Canyon Dr Plainfield, IL | 2.0 | 1.5 | 1280 | $2,500 | $1.95 | 17d | 1 | 1.44mi |
| 2745 Canyon Dr Plainfield, IL | 2.0 | 1.5 | 1280 | $2,650 | $2.07 | 45d | 1 | 1.44mi |
HOA detail
- Monthly dues
- $17 · $204/yr
Listing history 27 events
-
2026-06-10status $292,900 Pending 43 DOM
-
2026-06-09days on market $292,900 Active 43 DOM
-
2026-06-08days on market $292,900 Active 42 DOM
-
2026-06-07days on market $292,900 Active 41 DOM
-
2026-06-04days on market $292,900 Active 38 DOM
-
2026-06-03days on market $292,900 Active 37 DOM
-
2026-06-02days on market $292,900 Active 36 DOM
-
2026-06-01days on market $292,900 Active 35 DOM
-
2026-05-31days on market $292,900 Active 34 DOM
-
2026-05-18price $298,900 213-char remark
-
2026-04-27$305,000 Active 213-char remark
-
2018-12-11soldstatus $209,000
-
2018-11-19soldstatus $209,000 Closed Sale 239-char remark
Show marketing remark (239 chars)
Perfect 2 Story Home in a Quiet Cul de Sac. Lovely Fenced Yard with huge deck ideal for entertaining. This home offers a spacious open concept Layout. Great location, with walking distance to bike trail/path and much more. Well maintained.
-
2018-08-21historical Contingent 239-char remark
Show marketing remark (239 chars)
Perfect 2 Story Home in a Quiet Cul de Sac. Lovely Fenced Yard with huge deck ideal for entertaining. This home offers a spacious open concept Layout. Great location, with walking distance to bike trail/path and much more. Well maintained.
-
2018-08-06$209,900 New 239-char remark
Show marketing remark (239 chars)
Perfect 2 Story Home in a Quiet Cul de Sac. Lovely Fenced Yard with huge deck ideal for entertaining. This home offers a spacious open concept Layout. Great location, with walking distance to bike trail/path and much more. Well maintained.
-
2018-07-20historical
-
2018-07-17New
-
2016-04-11soldstatus $145,230 Closed Sale
-
2016-01-10status Pending
-
2015-12-22$141,000 New
-
2012-11-16soldstatus $165,000
-
2012-11-07soldstatus $165,000 Closed Sale
-
2012-10-06status Pending
-
2012-09-06historical Contingent
-
2012-08-29price $169,000 Price Change
-
2012-06-19$175,900 New
-
2005-03-16soldstatus $186,000
ⓘ Source: listings_history table (triggers on properties + properties_extension) + one-shot
backfill from property_details.listing_events for pre-trigger history.
Tax reassessment forecast IL · Partial reset (capped growth)
- Current annual tax
- $6,541 · $545/mo
- Projected year-2 tax
- $6,595 · $550/mo
- Expected delta
- +$54/yr (+$5/mo · 0.8%)
ⓘ Screening estimate from a state-policy table — verify with the county assessor before closing.
Climate risk First Street
- Flood 1/10 Low FEMA zone X (unshaded) · 0% chance over 30 yrs
- Wildfire 1/10 Low
- Heat 3/10 Moderate 7 d/yr ≥102°F today · 15 d/yr by 30 yrs out
- Wind 2/10 Low 100% chance of damaging wind over 30 yrs
- Air quality 3/10 Moderate 3 unhealthy d/yr today · 4 by 30 yrs out
Nearby sold comps map
Loading sold comps map…
Walkable amenities ~0.75 mi
Loading nearby amenities…
Taxation est. · year 1
- Rental income
- $34,563
- − Mortgage interest
- −$16,407
- − Property taxes
- −$6,541
- − Insurance
- −$1,464
- − Repairs & maintenance
- −$2,765
- − Management
- −$2,765
- − HOA
- −$204
- − Depreciation
- −$8,521
- Taxable loss
- −$4,104
- Est. tax savings @ 24.0%
- +$985
- After-tax cash flow
- $1,649/yr
For passive investors: Depreciation is non-cash, so a rental often shows a tax loss while cash-flowing — sheltering income. Rental losses are passive: they offset passive income freely, and up to $25,000/yr can offset ordinary (W-2) income if you actively participate and your MAGI is under $100k (phasing out to $0 by $150k); unused losses carry forward. On sale, claimed depreciation is recaptured at up to 25%, and gains may owe capital-gains tax (a 1031 exchange can defer both). Figures are a year-1 estimate at your 24.0% rate — not tax advice; consult a CPA.
Schools (NCES district)
- District
- Plainfield SD 202
- NCES district ID
- 1731740
- Math proficiency
- 25% ▼ -16.00%
- Reading proficiency
- 32% ▼ -14.00%
- Median HH income
- $90,706
- Composite
- 28.83/100
- National rank
- #6653
- State rank
- #213 of 620 in IL
Livability — Joliet
- Score
- 78/100
- State rank
- #153
- US rank
- #2772
Category grades
Schools grade is shown separately in the Schools card above.
Census & demographics
- Census place
- Joliet, IL
- County
- Will County · 412,448 people
- City population
- 68,632
- Metro
- Chicago-Naperville-Elgin, IL-IN-WI
- Population (ZIP)
- 47,834
- Household income
- $131,637
- Rent vs Own
- Severe rent burden
- 178.0
Population outlook (Will County) Hauer SSP2
- Today (2025)
- 705,368 people
- By 2030
- 708,154 · +0.4%
- By 2040
- 702,692 · -0.4%
- By 2050
- 680,249 · -3.6%
- By 2075
- 611,990 · -13.2%
- By 2100
- 516,215 · -26.8%
Race, ethnicity, and origin ACS 2023
- Neighborhood character
- Diverse neighborhood (Simpson 0.57)
- Race & ethnicity
- White 61% Hispanic / Latino 22% Two or more races 12% Black 11% Asian 4%
- Hispanic origin (detail)
- Mexican 17% Puerto Rican 2%
- Common ancestry
- Romanian 11% Italian 2% Iranian 1%
- Foreign-born
- 11% · Canada, China
- Languages at home
- 81% English-only · Spanish 12% Other Indo-European 3% Russian/Polish/Slavic 2%
Political lean MEDSL · Will
- 2024 margin
- Toss-up / Even · D 50.1% · R 48.5% · Other 1.4%
- 2008→2024 swing
- -11.6pp toward R · 2008: 13.2pp · 2024: 1.6pp
- All cycles
- 2024: D+1.6 2020: D+8.3 2016: D+5.7 2012: D+3.7 2008: D+13.2
Not yet ingested
- Civics
- —
Market trends
- HPI YoY
- ▼ -105.85%
- Current HPI
- 208.2858
- Rent YoY
- ▲ 4.29%
- Metro
- Chicago-Naperville-Elgin, IL-IN-WI
- State GDP YoY
- ▲ 1.59%
- F500 in state
- 60
Industry mix (Fortune 500 HQ in IL)
| Industry | F500 HQs | Revenue |
|---|---|---|
| Insurance | 4 | $201B |
|
||
| Consumer Goods | 4 | $87B |
|
||
| Industrial Machinery | 3 | $64B |
|
||
| Healthcare | 2 | $55B |
|
||
| Retail / Pharmacy | 1 | $148B |
|
||
| Agriculture / Food | 1 | $86B |
|
||
Price history
+57.5% since first listed20 events — show timeline
- 2026-06-09 Pending — MRED as Distributed by MLS Grid
- 2026-05-26 Price Changed $292,900 MRED as Distributed by MLS Grid
- 2026-05-18 Price Changed $298,900 MRED as Distributed by MLS Grid
- 2026-04-27 Listed $305,000 MRED as Distributed by MLS Grid
- 2018-12-11 Sold (Public Records) $209,000 Public Records
- 2018-11-19 Sold (MLS) $209,000 MRED as Distributed by MLS Grid
- 2018-08-21 Contingent — MRED as Distributed by MLS Grid
- 2018-08-06 Listed $209,900 MRED as Distributed by MLS Grid
- 2018-07-20 Listing Removed — MRED as Distributed by MLS Grid
- 2018-07-17 Listed — MRED as Distributed by MLS Grid
- 2016-04-11 Sold (MLS) $145,230 MRED as Distributed by MLS Grid
- 2016-01-10 Pending — MRED as Distributed by MLS Grid
- 2015-12-22 Listed $141,000 MRED as Distributed by MLS Grid
- 2012-11-16 Sold (Public Records) $165,000 Public Records
- 2012-11-07 Sold (MLS) $165,000 MRED as Distributed by MLS Grid
- 2012-10-06 Pending — MRED as Distributed by MLS Grid
- 2012-09-06 Contingent — MRED as Distributed by MLS Grid
- 2012-08-29 Price Changed $169,000 MRED as Distributed by MLS Grid
- 2012-06-19 Listed $175,900 MRED as Distributed by MLS Grid
- 2005-03-16 Sold (Public Records) $186,000 Public Records
Property tax history
+2.1%/yrLatest (2024): $6,541 · +4.6% YoY. Source: county tax records.
Cash-flow waterfall
monthlySold comps — $/sqft
last 12 mo · ≤1 miLoading sold comps…