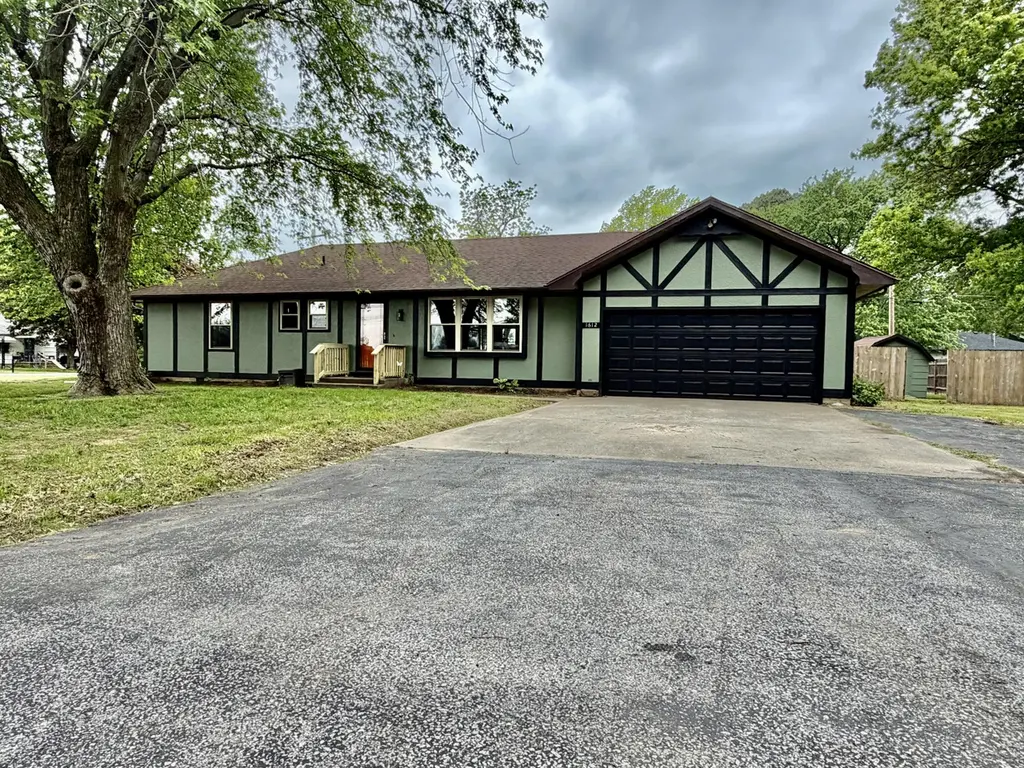
1612 S Vernon St · El Dorado Springs, MO
Flood risk 1/10 · Minimal
- FEMA flood zone
- X (unshaded)
- Chance of flooding over 30 yrs
- 0.0%
- Est. flood insurance / yr
- $507 – $1,088
Fire risk 4/10 · Minor
- Est. fire insurance / yr
- $1,054 – $1,958
Heat risk 5/10 · Moderate
- Hot days now (above 108°F)
- 7 days/yr
- Hot days in 30 yrs
- 18 days/yr
Wind risk 2/10 · Minimal
- Chance of severe wind over 30 yrs
- 2.0%
Air-quality risk 2/10 · Minimal
- Unhealthy air days now
- 0 days/yr
- Unhealthy air days in 30 yrs
- 1 days/yr
Risk factors via First Street. Map © Google.
Why this score? — see what drove the C- grade
The composite is a weighted blend of 9 inputs, each scored 0–100. Each bar is that input's sub-score; the figure is the points it added to the 100-point composite (weight × sub-score).
- Cash flow +19.7/30.0
- Appreciation +10.0/10.0
- DSCR +6.2/10.0
- 1% rule +4.1/10.0
- Livability +3.1/5.0
- ARV discount +2.7/15.0
- Rent growth +2.5/5.0
- Condition / age +2.5/5.0
- Schools +2.4/10.0
$159,900
🖨 Deal sheet 📄 Offer letter ✓ Due diligence
Listing remarks MLS
Three bedroom, 1-1/2 bath ranch style home in nice neighborhood in El Dorado Springs. This is a Fannie Mae HomePath property. Purchase this property for as little as 3% down. This property is approved for HomePath Mortgage Financing and approved for HomePath Renovation Mortgage Financing. Entered into MLS 03/19/2010.
Key facts
- New paint
- New appliances
- New light fixtures
Tags
Neighborhood map
What this means for you Summary
Snapshot
- This is a 3-bed/2.0-bath single-family listed at $160k.
Deal economics
- At list price, monthly cash flow is $187 ($2k/yr) — positive.
- The deal already cash-flows at list — no discount required.
- To meet the 1% rule (rent ≥ 1% of price), the offer needs to be $145k (9.3% below list).
- Recommended offer: $145k (9.3% below list) — sets the bar for 1% rule.
- Cap rate 7.7% vs local median 4.9% in El Dorado Springs — top-decile yield for the area; either an underpriced asset or a hidden risk that comps aren't pricing in. Stress-test before assuming the spread holds.
Location & tenants
- Location reads 62/100 on livability (#370 in MO) — a middle-class / working-renter tenant base. Strengths: cost of living A+, housing A+, health & safety A+; Watch: amenities F, commute F, employment F.
- El Dorado Springs R-II (town): math 25% / reading 34% proficiency, ranked #279 of 324 in MO (top 86%) — low school quality limits family demand, transient renter base, plan for 1-2y turnover.
- Zoned schools: El Dorado Springs Elem. (math 26% / reading 34%, grade F, #808 of 1,115 statewide, top 73%, 580 students, 100% FRL); El Dorado Springs Middle (math 28% / reading 31%, grade F, #291 of 391 statewide, top 76%, 244 students, 51% FRL); El Dorado Springs High (math 12% / reading 47%, grade F, #382 of 521 statewide, top 78%, 348 students, 40% FRL).
- Market conditions: 81 active listings in the ZIP; 1 comparable units currently listed for rent nearby; 4 units permitted in Cedar County in 2024 (0 in 5+ unit buildings).
Forward outlook
- In year one you build about $17k of equity ($1k loan paydown + $16k appreciation (10.0% local appreciation)).
- Cedar County population projected at -12% by 2050 — secular population decline; favor cash flow + early exit over multi-decade hold.
- At projected returns (10.0% appreciation + 3.0% rent growth), your $45k cash investment doubles in ~3 years — after that, you're playing with house money.
- By year 3, paydown + projected appreciation supports a ~$43k cash-out refi (75% LTV) — recoverable capital for the next deal without selling this one.
Negotiation context
- Only 1 days on market — expect competitive offers; lowballing is unlikely to land.
- 3 sale attempts since 18y ago with the ask held roughly flat each time — persistent listings suggest the price (not the market) is what's stuck; bring a comps-based counter.
Risks & watch-outs
- Climate carrying-cost: extreme-heat days projected 7→18/yr by 2055 (HVAC capex compounding) — expect insurance premiums to compound above CPI over the hold.
Questions for the listing agent
- Built in 1977 — when were the roof, HVAC, electrical panel, plumbing, and water heater last replaced?
- Is there a deadline driving the sale (1031 exchange, divorce, estate, relocation)? That informs how much negotiation room exists.
- Schools are D-rated, which usually means shorter tenancies and higher turnover. Who's the typical renter profile here, and what's been the actual vacancy rate?
- What's the average days-on-market for RENTAL listings here right now (not sales)? A rising rental-DOM trend means longer vacancies and softer asking-rent achievability than the comps imply.
- What's the recent tenant-quality profile in this submarket — average credit score on applications, eviction rate, late-payment / NSF rate, and stable-employment percentage? A property-management company in the area should have these aggregated.
- How much new for-sale + rental construction is in the pipeline within 1–3 miles? Heavy new supply typically softens prices + rents 12–24 months out; constrained supply supports both.
Investment metrics
- 1% rule
- 0.91% ✗
- Cap rate
- 7.69%
- Cash-on-cash
- 5.00%
- DSCR
- 1.22
- GRM
- 9.2
CMA / ARV
- ARV (on-the-fly)
- $144,384
- Comps found
- 7
Show comp detail 7 sales within ~0.75 mi
| Address | Dist | Beds/Ba | Sqft | Sold | Price | $/sf | Match |
|---|---|---|---|---|---|---|---|
| 1509 S Vernon St | 0.14mi | 3/1.0 | 1,054 (-7%) | 2mo | $139,900 | $133 | 77 |
| 1704 Van Dr | 0.20mi | 3/1.5 | 1,211 (+7%) | 13mo | $1 | — | 66 |
| 1405 S Schrock St | 0.34mi | 3/2.0 | 1,266 (+12%) | 1mo | $159,500 | $126 | 63 |
| 1709 Witt Dr | 0.17mi | 3/1.5 | 1,056 (-6%) | 21mo | $135,000 | $128 | 62 |
| 1707 S Witt Dr | 0.17mi | 4/2.5 (+1) | 1,272 (+13%) | 10mo | $153,900 | $121 | 55 |
| 1609 S Jackson St | 0.58mi | 3/1.0 | 1,056 (-6%) | 16mo | $133,900 | $127 | 45 |
| 107 W Carman Rd | 0.50mi | 3/2.5 | 1,218 (+8%) | 23mo | $210,000 | $172 | 43 |
Match score weights: distance 35% · size 25% · config 20% · recency 20%. Top-matched comps best support the ARV.
Projected returns pro-forma
10.0% appreciation · 3.0% rent growth · sell at horizon
- IRR
- 27.9%
- Equity multiple
- 3.21×
- Total profit
- $98,906
- Equity at exit
- $144,051
- IRR
- 24.3%
- Equity multiple
- 7.29×
- Total profit
- $281,778
- Equity at exit
- $310,651
Cash invested: $44,772 (down + closing). Projections, not guarantees.
Landlord ↔ Tenant lean methodology
- Overall (STATE)
- 81 Strongly Landlord-Friendly
- State Missouri
- 81 Strongly Landlord-Friendly · R+10
- County
- — inherits STATE
- City
- — inherits STATE
ZIP-level market 64744
- Home prices YoY
- 5.2%
- Active inventory
- 81
- Price-to-rent
- 9.2×
Monthly cashflow live
- Estimated rent
- $1,450 medium interval (Pro) →
- Mortgage (P&I)
- −$839
- Tax from tax record
- −$54 /mo · $644/yr
- Insurance
- −$67
- HOA
- −$0
- Vacancy / Maint / Mgmt
- −$304
- Net cashflow
- $187
Break-even live
UW: 25.0% down · 7.5% · 30yr · 1.5% tax · 5.0% vac · 8.0% maint · 8.0% mgmt
Financing live
Cash to close
- Down payment
- $39,975
- Closing costs
- $4,797
- Reserves months
- —
- Total cash needed
- —
Loan-product check · same deal, 3 products live
Conventional
25% down · 7.5% · 30yr
- Down + closing
- —
- Monthly P&I
- —
- Monthly cashflow
- —
- DSCR
- —
- Eligible?
- —
Personal DTI + credit; lowest rate.
DSCR
20% down · 8.5% · 30yr
- Down + closing
- —
- Monthly P&I
- —
- Monthly cashflow
- —
- DSCR
- —
- Eligible?
- —
No personal income docs; deal must DSCR.
Hard money
10% down · 12.0% · 12mo
- Down + closing
- —
- Monthly P&I
- —
- Monthly cashflow
- —
- DSCR
- —
- Eligible?
- —
Short-term bridge; refi at stabilization.
Rent comps 1 comps
| Address | Beds | Baths | Sqft | Rent | $/sqft | DOM | Units | Dist |
|---|---|---|---|---|---|---|---|---|
| 410 S Ohio St El Dorado Springs, MO | 3.0 | 2.0 | 1020 | $1,450 | $1.42 | 43d | 1 | 1.14mi |
Listing history 7 events
-
2026-04-25status Pending
-
2026-04-24$159,900 Active
-
2015-10-26soldstatus
-
2010-06-23soldstatus 318-char remark
Show marketing remark (318 chars)
Three bedroom, 1-1/2 bath ranch style home in nice neighborhood in El Dorado Springs. This is a Fannie Mae HomePath property. Purchase this property for as little as 3% down. This property is approved for HomePath Mortgage Financing and approved for HomePath Renovation Mortgage Financing. Entered into MLS 03/19/2010.
-
2010-03-19$69,900 318-char remark
Show marketing remark (318 chars)
Three bedroom, 1-1/2 bath ranch style home in nice neighborhood in El Dorado Springs. This is a Fannie Mae HomePath property. Purchase this property for as little as 3% down. This property is approved for HomePath Mortgage Financing and approved for HomePath Renovation Mortgage Financing. Entered into MLS 03/19/2010.
-
2008-03-10soldstatus 291-char remark
Show marketing remark (291 chars)
NEW VINYL IN KITCHEN. NEW CARPET. CHAIN LINK DOG PEN. 8X12 STORAGE BLDG. VAULTED CEILING IN LR. HAS BEEN PARTIALLY REPAINTED IN THE LAST 6 MO. 4' CHAIN LINK FENCE AROUND BACK YARD. LANDSCAPING. REFRIGERATOR IS NEGOTIABLE. WATER HEATER, FURNACE, A/C ARE 4 YRS. OLD. GREAT SOUTHSIDE LOCATION.
-
2008-01-03$89,000 291-char remark
Show marketing remark (291 chars)
NEW VINYL IN KITCHEN. NEW CARPET. CHAIN LINK DOG PEN. 8X12 STORAGE BLDG. VAULTED CEILING IN LR. HAS BEEN PARTIALLY REPAINTED IN THE LAST 6 MO. 4' CHAIN LINK FENCE AROUND BACK YARD. LANDSCAPING. REFRIGERATOR IS NEGOTIABLE. WATER HEATER, FURNACE, A/C ARE 4 YRS. OLD. GREAT SOUTHSIDE LOCATION.
ⓘ Source: listings_history table (triggers on properties + properties_extension) + one-shot
backfill from property_details.listing_events for pre-trigger history.
Tax reassessment forecast MO · Resets to sale price
- Current annual tax
- $644 · $54/mo
- Projected year-2 tax
- $1,551 · $129/mo
- Expected delta
- +$907/yr (+$76/mo · 140.8%)
ⓘ Screening estimate from a state-policy table — verify with the county assessor before closing.
Climate risk First Street
- Flood 1/10 Low FEMA zone X (unshaded) · 0% chance over 30 yrs
- Wildfire 4/10 Moderate
- Heat 5/10 Major 7 d/yr ≥108°F today · 18 d/yr by 30 yrs out
- Wind 2/10 Low 2% chance of damaging wind over 30 yrs
- Air quality 2/10 Low 0 unhealthy d/yr today · 1 by 30 yrs out
Nearby sold comps map
Loading sold comps map…
Walkable amenities ~0.75 mi
Loading nearby amenities…
Taxation est. · year 1
- Rental income
- $17,400
- − Mortgage interest
- −$8,957
- − Property taxes
- −$644
- − Insurance
- −$800
- − Repairs & maintenance
- −$1,392
- − Management
- −$1,392
- − Depreciation
- −$4,652
- Taxable loss
- −$436
- Est. tax savings @ 24.0%
- +$105
- After-tax cash flow
- $2,345/yr
For passive investors: Depreciation is non-cash, so a rental often shows a tax loss while cash-flowing — sheltering income. Rental losses are passive: they offset passive income freely, and up to $25,000/yr can offset ordinary (W-2) income if you actively participate and your MAGI is under $100k (phasing out to $0 by $150k); unused losses carry forward. On sale, claimed depreciation is recaptured at up to 25%, and gains may owe capital-gains tax (a 1031 exchange can defer both). Figures are a year-1 estimate at your 24.0% rate — not tax advice; consult a CPA.
Schools (NCES district)
- District
- El Dorado Springs R-II
- NCES district ID
- 2911310
- Math proficiency
- 25% ▼ -5.00%
- Reading proficiency
- 34% ▼ -5.00%
- Median HH income
- $31,880
- Composite
- 24.02/100
- National rank
- #7772
- State rank
- #279 of 324 in MO
Livability — El Dorado Springs
- Score
- 62/100
- State rank
- #370
- US rank
- #16324
Category grades
Schools grade is shown separately in the Schools card above.
Census & demographics
- Census place
- El Dorado Springs, MO
- Population (ZIP)
- 8,547
Population outlook (Cedar County) Hauer SSP2
- Today (2025)
- 13,424 people
- By 2030
- 13,080 · -2.6%
- By 2040
- 12,434 · -7.4%
- By 2050
- 11,841 · -11.8%
- By 2075
- 10,171 · -24.2%
- By 2100
- 7,744 · -42.3%
Race, ethnicity, and origin ACS 2023
- Neighborhood character
- Predominantly White (95%)
- Race & ethnicity
- White 95% Two or more races 4%
- Common ancestry
- Italian 6% Iranian 3% Romanian 3%
- Foreign-born
- 1% · Canada
- Languages at home
- 94% English-only · German/W. Germanic 5% Spanish 1%
Political lean MEDSL · Cedar
- 2024 margin
- Solid R (+69.6) · D 14.8% · R 84.4%
- 2008→2024 swing
- -36.0pp toward R · 2008: -33.6pp · 2024: -69.6pp
- All cycles
- 2024: R+69.6 2020: R+65.9 2016: R+63.9 2012: R+47.0 2008: R+33.6
Not yet ingested
- Civics
- —
Market trends
- HPI YoY
- ▲ 11.88%
- Current HPI
- 242.0421
- Rent YoY
- —
- Metro
- —
- State GDP YoY
- ▲ 1.84%
- F500 in state
- 20
Industry mix (Fortune 500 HQ in MO)
| Industry | F500 HQs | Revenue |
|---|---|---|
| Healthcare | 1 | $163B |
|
||
| Insurance | 1 | $21B |
|
||
| Industrial Technology | 1 | $17B |
|
||
| Retail | 1 | $16B |
|
||
| Industrial Distribution | 1 | $10B |
|
||
| Utilities | 1 | $9B |
|
||
Price history
+79.7% since first listed7 events — show timeline
- 2026-04-25 Pending — SOMO
- 2026-04-24 Listed $159,900 SOMO
- 2015-10-26 Sold (Public Records) — Public Records
- 2010-06-23 Sold (MLS) — Heartland MLS as Distributed by MLS Grid
- 2010-03-19 Listed $69,900 Heartland MLS as Distributed by MLS Grid
- 2008-03-10 Sold (MLS) — Heartland MLS as Distributed by MLS Grid
- 2008-01-03 Listed $89,000 Heartland MLS as Distributed by MLS Grid
Property tax history
+3.2%/yrLatest (2025): $644 · +8.5% YoY. Source: county tax records.
Cash-flow waterfall
monthlySold comps — $/sqft
last 12 mo · ≤1 miLoading sold comps…