2534 County Road 676 · Dayton, TX
Flood risk No data
- FEMA flood zone
- —
- Chance of flooding over 30 yrs
- —
- Est. flood insurance / yr
- —
Fire risk No data
- Est. fire insurance / yr
- —
Heat risk No data
- Hot days now (above threshold)
- —
- Hot days in 30 yrs
- —
Wind risk No data
- Chance of severe wind over 30 yrs
- —
Air-quality risk No data
- Unhealthy air days now
- —
- Unhealthy air days in 30 yrs
- —
Risk factors via First Street. Map © Google.
Why this score? — see what drove the D grade
The composite is a weighted blend of 9 inputs, each scored 0–100. Each bar is that input's sub-score; the figure is the points it added to the 100-point composite (weight × sub-score).
- Cash flow +16.4/30.0
- ARV discount +7.5/15.0
- DSCR +5.1/10.0
- 1% rule +4.1/10.0
- Schools +3.0/10.0
- Livability +3.0/5.0
- Rent growth +2.5/5.0
- Condition / age +2.5/5.0
- Appreciation +0.0/10.0
$165,000
🖨 Deal sheet 📄 Offer letter ✓ Due diligence
Listing remarks
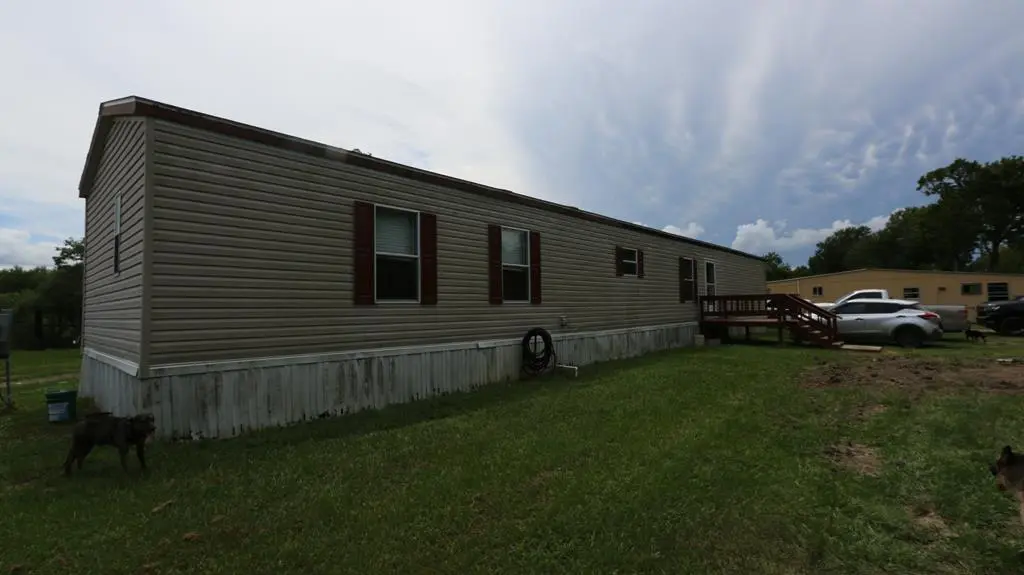
Discover peaceful country living on 1.8+ secluded acres at the end of County Road 646. This property features a well-kept 2011 manufactured home offering 3 bedrooms and 2 full baths, complete with an aerobic septic system and private water well for self-sufficient living. With no through traffic, this tucked-away location offers the perfect blend of privacy and comfort while still keeping you within reach of nearby amenities. Enjoy wildlife in your front yard!
Key facts
- Tucked-away location
- Secluded acres
- Private water well
Tags
Property features AI
Exterior
- Parking: No garage
- Utilities: Private well water
- Home design: Residential mobile home
- Construction: Vinyl siding
- Exterior features: Composition roof; Lot approximately 1.894 acres
Interior
- Flooring: Carpet; Vinyl
- Bathrooms: 2 full bathrooms
- Heating & cooling: Central air conditioning; Electric heating
- Interior features: Carpet and vinyl flooring
Neighborhood map
What this means for you Summary
Snapshot
- This is a 3-bed/1.0-bath single-family listed at $165k.
Deal economics
- At list price, monthly cash flow is $94 ($1k/yr) — positive.
- The deal already cash-flows at list — no discount required.
- To meet the 1% rule (rent ≥ 1% of price), the offer needs to be $150k (9.3% below list).
- Recommended offer: $150k (9.3% below list) — sets the bar for 1% rule.
- Cap rate 7.0% vs local median 3.2% in Dayton — top-decile yield for the area; either an underpriced asset or a hidden risk that comps aren't pricing in. Stress-test before assuming the spread holds.
Location & tenants
- Location reads 60/100 on livability (#1,066 in TX) — a middle-class / working-renter tenant base. Strengths: cost of living A+, housing A+, crime B+; Watch: schools D-, amenities F, commute F.
- Dayton ISD (town): math 34% / reading 35% proficiency, ranked #512 of 826 in TX (top 62%) — families likely to look elsewhere, expect single-tenant / working-renter base with shorter leases.
- Market conditions: 1209 active listings in the ZIP; solid renter incomes; 1,321 units permitted in Liberty County in 2024 (0 in 5+ unit buildings).
Forward outlook
- Local home prices are declining (-3.0%/yr); year-one equity from $1k of loan paydown is wiped out by about $5k of value loss. Plan a longer hold.
- Liberty County population projected at +24% by 2050 — long-run rental-demand tailwind backs the buy-and-hold thesis.
Negotiation context
- It's been on market 52 days — a 3% lower offer ($160k) is reasonable based on typical stale-listing flexibility.
- 3 sale attempts; this cycle's ask has dropped $15k (8%) from the opening price — seller is motivated, your offer sets the floor, not the list.
Questions for the listing agent
- It's been on market 52 days. Have you received any prior offers? Is the seller open to a 9% concession, seller financing, or rate buy-down credit?
- Is there a deadline driving the sale (1031 exchange, divorce, estate, relocation)? That informs how much negotiation room exists.
- Schools are D-rated, which usually means shorter tenancies and higher turnover. Who's the typical renter profile here, and what's been the actual vacancy rate?
- The area grade is low — what's the realistic commute time and amenity access for the typical tenant pool here? Any planned neighborhood developments (good or bad) we should know about?
- What's the average days-on-market for RENTAL listings here right now (not sales)? A rising rental-DOM trend means longer vacancies and softer asking-rent achievability than the comps imply.
- What's the recent tenant-quality profile in this submarket — average credit score on applications, eviction rate, late-payment / NSF rate, and stable-employment percentage? A property-management company in the area should have these aggregated.
- How much new for-sale + rental construction is in the pipeline within 1–3 miles? Heavy new supply typically softens prices + rents 12–24 months out; constrained supply supports both.
Investment metrics
- 1% rule
- 0.91% ✗
- Cap rate
- 6.97%
- Cash-on-cash
- 2.44%
- DSCR
- 1.11
- GRM
- 9.2
CMA / ARV
No comps found within radius.
Projected returns pro-forma
-3.0% appreciation · 3.0% rent growth · sell at horizon
- IRR
- -12.5%
- Equity multiple
- 0.55×
- Total profit
- $-20,774
- Equity at exit
- $24,602
- IRR
- -3.4%
- Equity multiple
- 0.77×
- Total profit
- $-10,437
- Equity at exit
- $14,266
Cash invested: $46,200 (down + closing). Projections, not guarantees.
Landlord ↔ Tenant lean methodology
- Overall (STATE)
- 87 Strongly Landlord-Friendly
- State Texas
- 87 Strongly Landlord-Friendly · R+5
- County
- — inherits STATE
- City
- — inherits STATE
ZIP-level market 77535
- Home prices YoY
- -24.8%
- Active inventory
- 1209
- Price-to-rent
- 9.2×
Monthly cashflow live
- Estimated rent
- $1,496 medium interval (Pro) →
- Mortgage (P&I)
- −$865
- Tax from tax record
- −$154 /mo · $1,849/yr
- Insurance
- −$69
- HOA
- −$0
- Vacancy / Maint / Mgmt
- −$314
- Net cashflow
- $94
Break-even live
UW: 25.0% down · 7.5% · 30yr · 1.5% tax · 5.0% vac · 8.0% maint · 8.0% mgmt
Financing live
Cash to close
- Down payment
- $41,250
- Closing costs
- $4,950
- Reserves months
- —
- Total cash needed
- —
Loan-product check · same deal, 3 products live
Conventional
25% down · 7.5% · 30yr
- Down + closing
- —
- Monthly P&I
- —
- Monthly cashflow
- —
- DSCR
- —
- Eligible?
- —
Personal DTI + credit; lowest rate.
DSCR
20% down · 8.5% · 30yr
- Down + closing
- —
- Monthly P&I
- —
- Monthly cashflow
- —
- DSCR
- —
- Eligible?
- —
No personal income docs; deal must DSCR.
Hard money
10% down · 12.0% · 12mo
- Down + closing
- —
- Monthly P&I
- —
- Monthly cashflow
- —
- DSCR
- —
- Eligible?
- —
Short-term bridge; refi at stabilization.
Listing history 20 events
-
2026-06-18days on market $165,000 Active 52 DOM
-
2026-06-17days on market $165,000 Active 51 DOM
-
2026-06-16days on market $165,000 Active 50 DOM
-
2026-06-15days on market $165,000 Active 49 DOM
-
2026-06-13days on market $165,000 Active 47 DOM
-
2026-06-13days on market $165,000 Active 46 DOM
-
2026-06-09days on market $165,000 Active 43 DOM
-
2026-06-08days on market $165,000 Active 42 DOM
-
2026-06-07days on market $165,000 Active 41 DOM
-
2026-06-04days on market $165,000 Active 38 DOM
-
2026-06-02days on market $165,000 Active 36 DOM
-
2026-06-01days on market $165,000 Active 35 DOM
-
2026-05-31days on market $165,000 Active 34 DOM
-
2026-02-16historical
-
2025-10-17price $165,000
-
2025-10-17price $165,000
-
2025-08-29$180,000 Active
-
2025-08-26$180,000 Active
-
2025-08-22$165,000 Active
-
2018-11-09soldstatus
ⓘ Source: listings_history table (triggers on properties + properties_extension) + one-shot
backfill from property_details.listing_events for pre-trigger history.
Tax reassessment forecast TX · Resets to sale price
- Current annual tax
- $1,849 · $154/mo
- Projected year-2 tax
- $3,020 · $252/mo
- Expected delta
- +$1,170/yr (+$98/mo · 63.3%)
ⓘ Screening estimate from a state-policy table — verify with the county assessor before closing.
Nearby sold comps map
Loading sold comps map…
Walkable amenities ~0.75 mi
Loading nearby amenities…
Taxation est. · year 1
- Rental income
- $17,953
- − Mortgage interest
- −$9,243
- − Property taxes
- −$1,849
- − Insurance
- −$825
- − Repairs & maintenance
- −$1,436
- − Management
- −$1,436
- − Depreciation
- −$4,800
- Taxable loss
- −$1,636
- Est. tax savings @ 24.0%
- +$393
- After-tax cash flow
- $1,518/yr
For passive investors: Depreciation is non-cash, so a rental often shows a tax loss while cash-flowing — sheltering income. Rental losses are passive: they offset passive income freely, and up to $25,000/yr can offset ordinary (W-2) income if you actively participate and your MAGI is under $100k (phasing out to $0 by $150k); unused losses carry forward. On sale, claimed depreciation is recaptured at up to 25%, and gains may owe capital-gains tax (a 1031 exchange can defer both). Figures are a year-1 estimate at your 24.0% rate — not tax advice; consult a CPA.
Schools (NCES district)
- District
- Dayton ISD
- NCES district ID
- 4816410
- Math proficiency
- 34% ▼ -6.00%
- Reading proficiency
- 35% ▲ 2.00%
- Median HH income
- $53,293
- Composite
- 30.25/100
- National rank
- #6287
- State rank
- #512 of 826 in TX
Livability — Dayton
- Score
- 60/100
- State rank
- #1066
- US rank
- #18940
Category grades
Schools grade is shown separately in the Schools card above.
Census & demographics
- County
- Liberty County · 82,189 people
- City population
- 82,189
- Metro
- Houston-The Woodlands-Sugar Land, TX
- Population (ZIP)
- 39,504
- Household income
- $84,497
- Rent vs Own
- Severe rent burden
- 321.0
Population outlook (Liberty County) Hauer SSP2
- Today (2025)
- 87,956 people
- By 2030
- 92,161 · +4.8%
- By 2040
- 100,784 · +14.6%
- By 2050
- 109,471 · +24.5%
- By 2075
- 133,470 · +51.7%
- By 2100
- 147,372 · +67.6%
Race, ethnicity, and origin ACS 2023
- Neighborhood character
- Majority White (64%)
- Race & ethnicity
- White 64% Hispanic / Latino 26% Two or more races 12% Black 7%
- Hispanic origin (detail)
- Mexican 23%
- Common ancestry
- Lithuanian 3% Slovak 2% Serbian 1%
- Foreign-born
- 7% · Canada
- Languages at home
- 79% English-only · Spanish 19% Russian/Polish/Slavic 1%
Political lean MEDSL · Liberty
- 2024 margin
- Solid R (+61.6) · D 19.0% · R 80.6%
- 2008→2024 swing
- -17.9pp toward R · 2008: -43.7pp · 2024: -61.6pp
- All cycles
- 2024: R+61.6 2020: R+59.7 2016: R+58.0 2012: R+53.3 2008: R+43.7
Not yet ingested
- Civics
- —
Market trends
- HPI YoY
- ▼ -75.61%
- Current HPI
- 229.0925
- Rent YoY
- —
- Metro
- Houston-The Woodlands-Sugar Land, TX
- State GDP YoY
- ▲ 3.95%
- F500 in state
- 110
Industry mix (Fortune 500 HQ in TX)
| Industry | F500 HQs | Revenue |
|---|---|---|
| Energy | 16 | $1,198B |
|
||
| Technology | 5 | $198B |
|
||
| Engineering / Construction | 4 | $72B |
|
||
| Energy Services | 3 | $60B |
|
||
| Utilities | 3 | $41B |
|
||
| Healthcare | 2 | $330B |
|
||
Price history
+0.0% since first listed7 events — show timeline
- 2026-02-16 Listing Removed — HARMLS
- 2025-10-17 Price Changed $165,000 HARMLS
- 2025-10-17 Price Changed $165,000 BBOR
- 2025-08-29 Listed $180,000 BBOR
- 2025-08-26 Listed $180,000 HARMLS
- 2025-08-22 Listed $165,000 Deep East Texas MLS
- 2018-11-09 Sold (Public Records) — Public Records
Property tax history
+8.0%/yrLatest (2025): $1,849 · +14.4% YoY. Source: county tax records.
Cash-flow waterfall
monthlySold comps — $/sqft
last 12 mo · ≤1 miLoading sold comps…